Instruction Frequency Data
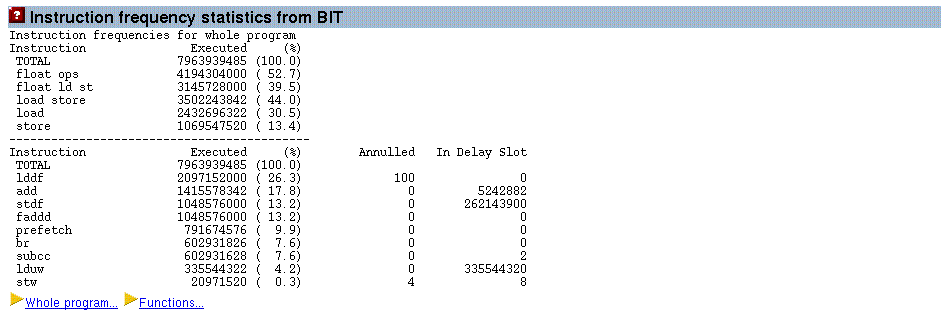
The Binary Improvement Tool (BIT) generates a report on the frequency with which different assembly language instructions are used during the run of the application. This provides a more detailed kind of instruction count.
The BIT software does not give information about the performance of the application, but it does give information about what the application is doing. For example, the BIT software will show how many floating point instructions are executed. There are a couple of terms used in the BIT software’s output which are worth elaborating on.
-
Every branch instruction has a delay slot, which is the next instruction immediately following the branch. This instruction gets executed together with the branch. The original idea of having delay slots was to give the processor something to do whilst it was waiting for new instructions from the target address of the branch.
-
It is possible for the branch to annul the instruction in the delay slot. This means that the instruction is only performed if the branch is taken.
The report from the BIT software includes information on the number of instructions executed, and of these instructions how many were located in delay slot and how many instructions were annulled (not executed).
Figure 3–5 Report from BIT Showing the Frequency of use of Assembly Language Instructions

Note –
The BIT software works by running a modified version of the application. The modified version contains instrumentation code which gathers counts data over the course of the run of the application. For this to work, it is necessary for the application be compiled with the compiler flag -xbinopt=prepare, and an optimisation level of -xO1 or higher.
Note –
In this release the BIT software will not gather data on shared library calls made by the application. More information on this topic can be found in the BIT User’s Guide and man page.
The tool BIT can also be invoked stand-alone, outside of spot. Type bit -h to get a list of the options, and consult the BIT man page and the BIT User’s Guide for more details.
- © 2010, Oracle Corporation and/or its affiliates
