| Sun Netra T5220 Server |
| Sun Netra T5220 Server |
| C H A P T E R 1 |
 Server Diagnostics
 |
This chapter describes the diagnostics that are available for monitoring and troubleshooting the server.
The following topics are covered:
If you have installed the server, and upon initial power up, you see errors indicating faults with the Fully Buffered DIMMs (FB-DIMMs), PCI cards, or other components, the suspect component might have become loosened or ajar during shipment.
Conduct a visual inspection of the server internals and its components. Remove the top cover and physically reseat the cable connections, the PCI cards, and the FB-DIMMs. See:
If performing these tasks is not successful, then continue to Server Diagnostics Overview.
There are a variety of diagnostic tools, commands, and indicators you can use to monitor and troubleshoot a server:
 - An application that exercises the system, provides hardware validation, and discloses possible faulty components with recommendations for repair.
The LEDs, ILOM, Solaris OS PSH, and many of the log files and console messages are integrated. For example, a fault detected by the Solaris software will display the fault, log it, pass information to ILOM where it is logged, and depending on the fault, might light one or more LEDs.
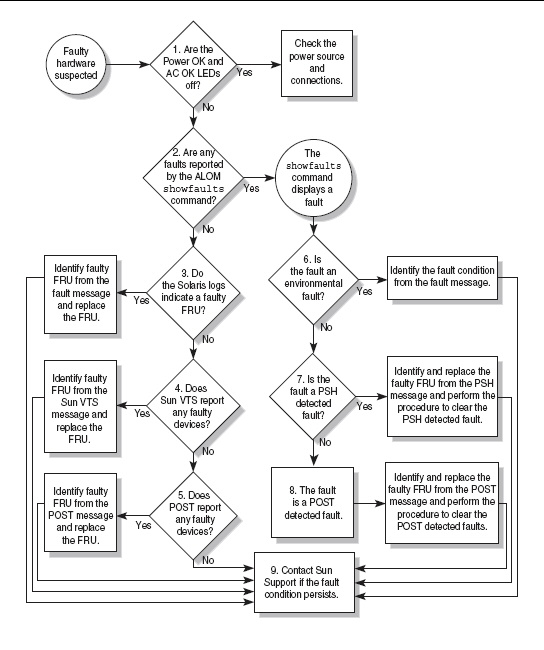
The diagnostic flowchart in FIGURE 1-1 and TABLE 1-1 describes an approach for using the server diagnostics to identify a faulty field-replaceable unit (FRU). The diagnostics you use, and the order in which you use them, depend on the nature of the problem you are troubleshooting. So you might perform some actions and not others.
The flowchart assumes that you have already performed some rudimentary troubleshooting such as verification of proper installation, visual inspection of cables and power, and possibly performed a reset of the server (refer to the server installation guide and server administration guide for details).
Use this flowchart to understand what diagnostics are available to troubleshoot faulty hardware. Use TABLE 1-1 to find more information about each diagnostic in this chapter.
FIGURE 1-1 Diagnostic Flowchart
|
The Power OK LED is located on the front and rear of the chassis. The Input OK LED is located on the rear of the server on each power supply. If these LEDs are not on, check the power source and power connections to the server. |
|||
|
Run the ALOM CMT CLI showfaults command to check for faults. |
The showfaults command displays the following kinds of faults: Faulty FRUs are identified in fault messages using the FRU name. For a list of FRU names, see TABLE 2-1. |
||
|
The Solaris message buffer and log files record system events and provide information about faults.
|
|||
|
SunVTS is an application you can run to exercise and diagnose FRUs. To run SunVTS, the server must be running the Solaris OS.
|
|||
|
POST performs basic tests of the server components and reports faulty FRUs. |
|||
|
If the fault listed by the showfaults command displays a temperature or voltage fault, then the fault is an environmental fault. Environmental faults can be caused by faulty FRUs (power supply, fan, or blower), or by environmental conditions such as when computer room ambient temperature is too high, or the server airflow is blocked. When the environmental condition is corrected, the fault will automatically clear. |
|||
|
If the fault indicates that a fan, blower, or power supply is bad, you can perform a hot-swap of the FRU. You can also use the fault LEDs on the server to identify the faulty FRU (fans, blower, and power supplies). |
|||
|
If the fault message displays the following text, the fault was detected by the Solaris Predictive Self-Healing software:
|
|||
|
If the fault is a PSH detected fault, identify the faulty FRU from the fault message and replace the faulty FRU. |
|||
|
After replacing the FRU, perform the procedure to clear PSH detected faults. |
|||
|
POST performs basic tests of the server components and reports faulty FRUs. When POST detects a faulty FRU, it logs the fault and if possible, takes the FRU offline. POST detected FRUs display the following text in the fault message: |
|||
|
In this case, replace the FRU and run the procedure to clear POST detected faults. |
A variety of features play a role in how the memory subsystem is configured and how memory faults are handled. Understanding the underlying features helps you identify and repair memory problems. This section describes how the memory is configured and how the server deals with memory faults.
In the server memory there are 16 slots that hold DDR-2 memory FB-DIMMs in the following FB-DIMM sizes:
FB-DIMMs are installed in groups of 8, called ranks (ranks 0 and 1). At minimum, rank 0 must be fully populated with eight FB-DIMMs of the same capacity. A second rank of FB-DIMMs of the same capacity can be added to fill rank 1.
See Replacing FB-DIMMs for instructions about adding memory to a server.
The server uses an advanced ECC technology, called chipkill, that corrects up to 4 bits in error on nibble boundaries, as long as all of the bits are in the same DRAM. If a DRAM fails, the FB-DIMM continues to function.
The following server features independently manage memory faults:
For correctable memory errors (CEs), POST forwards the error to the Solaris Predictive Self-Healing (PSH) daemon for error handling. If an uncorrectable memory fault is detected or if a “storm” of CEs is detected, POST displays the fault with the device name of the faulty FB-DIMMs, logs the fault, and disables the faulty FB-DIMMs by placing them in the ASR blacklist. Depending on the memory configuration and the location of the faulty FB-DIMM, POST disables half of physical memory in the system, or half the physical memory and half the processor threads. When this offlining process occurs in normal operation, you must replace the faulty FB-DIMMs based on the fault message. You then must enable the disabled FB-DIMMs with the ALOM CMT CLI enablecomponent command.
If you suspect that the server has a memory problem, follow the flowchart (FIGURE 1-1). Run the ALOM CMT compatability CLI (in ILOM) showfaults command, see Using the ALOM CMT Compatibility CLI in ILOM and Displaying System Faults. The showfaults command lists memory faults and lists the specific FB-DIMMS that are associated with the fault. Once you identify which FB-DIMMs to replace, see Replacing FB-DIMMs for FB-DIMM replacement instructions. You must perform the instructions in that chapter to clear the faults and enable the replaced FB-DIMMs.
The server provides the following groups of LEDs:
These LEDs provide a quick visual check of the state of the system.
The seven front panel LEDs (FIGURE 1-2) are located in the upper left corner of the server chassis. Three of these LEDs are also provided on the rear panel (FIGURE 1-3).
FIGURE 1-2 Location of the Bezel Server Status and Alarm Status Indicators

FIGURE 1-3 Rear Panel Connectors, LEDs, and Features on the Sun Netra T5220 Server

TABLE 1-2 lists and describes the front and rear panel LEDs.
The hard drive LEDs (FIGURE 1-4 and TABLE 1-3) are located on the front of each hard drive that is installed in the server chassis.

The power supply LEDs (FIGURE 1-5 and TABLE 1-4) are located on the rear of each power supply.

The ILOM management Ethernet port and the four 10/100/1000 Mbps Ethernet ports each have two LEDs, as shown in FIGURE 1-6 and described in TABLE 1-5.

|
Link/Activity indicator LED (Same location for all Ethernet ports) |
|
| Note - The NET MGT port operates only in 100-Mbps or 10-Mbps so the speed indicator LED can be green or off (never amber). |
The Sun Integrated Lights Out Manager (ILOM) firmware is a service processor in the server that enables you to remotely manage and administer your server.
ILOM enables you to remotely run diagnostics, such as power-on self-test (POST), that would otherwise require physical proximity to the server’s serial port. You can also configure ILOM to send email alerts of hardware failures, hardware warnings, and other events related to the server or to ILOM.
The service processor runs independently of the server, using the server’s standby power. Therefore, ILOM firmware and software continue to function when the server operating system goes offline or when the server is powered off.
Faults detected by ILOM, POST, and the Solaris Predictive Self-Healing (PSH) technology are forwarded to ILOM for fault handling (FIGURE 1-7).
In the event of a system fault, ILOM ensures that the fault LED is lit, FRU ID PROMs are updated, the fault is logged, and alerts are displayed (faulty FRUs are identified in fault messages using the FRU name). For a list of FRU names, see TABLE 2-1.
FIGURE 1-7 ILOM Fault Management

The service processor detects when a fault is no longer present and clears the fault in several ways:
The service processor also detects the removal of a FRU, in many cases even if the FRU is removed while the service processor is powered off (that is, if the system power cables are unplugged during service procedures). This situation enables ILOM to know that a fault, diagnosed to a specific FRU, has been repaired.
| Note - ILOM does not automatically detect hard drive replacement. |
Many environmental faults can automatically recover. A temperature that is exceeding a threshold might return to normal limits. An unplugged power supply can be plugged in, and so on. Recovery of environmental faults is automatically detected. Recovery events are reported using one of two forms:
Environmental faults can be repaired through hot-removal of the faulty FRU. FRU removal is automatically detected by the environmental monitoring, and all faults associated with the removed FRU are cleared. The message for that case, and the alert sent for all FRU removals is:
fru at location has been removed.
There is no ILOM command to manually repair an environmental fault.
The Solaris Predictive Self-Healing technology does not monitor the hard drive for faults. As a result, the service processor does not recognize hard drive faults, and will not light the fault LEDs on either the chassis or the hard drive itself. Use the Solaris message files to view hard drive faults. See Collecting Information From Solaris OS Files and Commands.
There are three methods of interacting with the service processor:
| Note - The examples in this section use the ALOM CMT compatibility CLI. |
The ALOM CMT CLI emulates the ALOM CMT interface supported on the previous generation of CMT servers. Using the ALOM CMT CLI (with few exceptions) you can use commands that resemble the ALOM CMT commands. The comparisons between the ILOM CLI and The ALOM CMT compatibility CLI are described in the Sun Integrated Lights Out Management 2.0 Supplement for the Sun Netra T5220 Server.
The service processor sends alerts to all ALOM CMT CLI users that are logged in, sending the alert through email to a configured email address, and writing the event to the ILOM event log.
To create an ALOM CMT CLI, do the following:
1. Log in to the service processor with username: root.
When powered on, the service processor boots to the ILOM login prompt. The factory default password is changeme.
2. Create a new user, set the account role to Administrator and the CLI mode to alom.
| Note - The asterisks in the example will not appear when you enter your password. |
You can combine the create and set commands on a single line:
-> create /SP/users/admin role=Administrator cli_mode=alomCreating user...Enter new password: ********Enter new password again: ********Created /SP/users/admin |
3. Log out of the root account after you have finished creating the new account.
4. Log in to the ALOM CMT CLI (indicated by the sc> prompt) from the ILOM login prompt.
| Note - Multiple service processor accounts can be active concurrently. A user can be logged in under one account using the ILOM CLI, and another account using the ALOM CMT CLI. |
This section describes commands commonly used for service-related activities.
Before you can run ALOM CMT CLI commands, you must connect to the service processor in one of two ways:
| Note - Refer to the Sun Integrated Lights Out Management 2.0 Supplement for the Sun Netra T5220 Server for instructions on configuring and connecting to the service processor. |
TABLE 1-6 describes the typical ALOM CMT CLI commands for servicing a server. For descriptions of all ALOM CMT CLI commands, issue the help command or refer to the Integrated Lights Out Management User’s Guide.
|
Displays a list of all ALOM CMT CLI commands with syntax and descriptions. Specifying a command name as an option displays help for that command. |
|
|
Takes the host server from the OS to either kmdb or OpenBoot PROM (equivalent to a Stop-A), depending on the mode Solaris software was booted. |
|
|
Manually clears host-detected faults. The UUID is the unique fault ID of the fault to be cleared. |
|
|
Connects you to the host system. The -f option forces the console to have read and write capabilities. |
|
|
Displays the contents of the system’s console buffer. The following options enable you to specify how the output is displayed: |
|
|
Enables control of the firmware during system initialization with the following options: |
|
|
Performs a poweroff followed by poweron. The -f option forces an immediate poweroff, otherwise the command attempts a graceful shutdown. |
|
|
Powers off the host server. The -y option enables you to skip the confirmation question. The -f option forces an immediate shutdown. |
|
|
Powers on the host server. Using the -c option executes a console command after completion of the poweron command. |
|
|
Indicates if it is okay to perform a hot-swap of a power supply. This command does not perform any action, but it provides a warning if the power supply should not be removed because the other power supply is not enabled. |
|
|
Generates a hardware reset on the host server. The -y option enables you to skip the confirmation question. The -c option executes a console command after completion of the reset command. |
|
|
Reboots the service processor. The -y option enables you to skip the confirmation question. |
|
|
Sets the virtual keyswitch. The -y option enables you to skip the confirmation question when setting the keyswitch to stby. |
|
|
Displays the environmental status of the host server. This information includes system temperatures, power supply, front panel LED, hard drive, fan, voltage, and current sensor status. See Displaying the Server’s Environmental Status. |
|
|
Displays current system faults. See Displaying System Faults. |
|
|
Displays information about the FRUs in the server.
|
|
|
Displays the current state of the Locator LED as either on or off. |
|
|
showlogs [-b lines | -e lines | -v] [-g lines] [-p logtype[r|p]]] |
Displays the history of all events logged in the ALOM CMT event buffers (in RAM or the persistent buffers). |
|
Displays information about the host system’s hardware configuration, the system serial number, and whether the hardware is providing service. |
| Note - See TABLE 1-10 for the ALOM CMT CLI automatic system recover (ASR) commands. |
The ALOM CMT CLI showfaults command displays the following kinds of faults:
Use the showfaults command for the following reasons:
 At the sc> prompt, type the showfaults command.
The following showfaults command examples show the different kinds of output from the showfaults command:
sc> showfaults Last POST run: THU MAR 09 16:52:44 2006 POST status: Passed all devices No failures found in System |
sc> showfaults Last POST Run: Wed Jun 27 21:29:02 2007 Post Status: Passed all devices ID FRU Fault 0 /SYS/MB/CMP0/BR3/CH1/D1 SP detected fault: /SYS/MB/CMP0/BR3/CH1/D1 Forced fail (POST) |
The ALOM CMT CLI clearfault command enables you to manually clear PSH diagnosed faults from the service processor without a FRU replacement or if the service processor was unable to automatically detect the FRU replacement.
At the sc> prompt, type the clearfault command.
The showenvironment command displays a snapshot of the server’s environmental status. This command displays system temperatures, hard drive status, power supply and fan status, front panel LED status, and voltage and current sensors. The output uses a format similar to the Solaris OS command prtdiag (1m).
At the sc> prompt, type the showenvironment command.
The output differs according to your system’s model and configuration.
EXAMPLE 1-1 shows abridged output of the showenvironment command.
| Note - Some environmental information might not be available when the server is in standby mode. |
The showfru command displays information about the FRUs in the server. Use this command to see information about an individual FRU, or for all the FRUs.
| Note - By default, the output of the showfru command for all FRUs is very long. |
At the sc> prompt, enter the showfru command.
In the following example, the showfru command is used to get information about the motherboard (MB).
Power-on self-test (POST) is a group of PROM-based tests that run when the server is powered on or reset. POST checks the basic integrity of the critical hardware components in the server (CPU, memory, and I/O buses).
If POST detects a faulty component, the component is disabled automatically, preventing faulty hardware from potentially harming any software. If the system is capable of running without the disabled component, the system will boot when POST is complete. For example, if one of the processor cores is deemed faulty by POST, the core will be disabled, and the system will boot and run using the remaining cores.
The server can be configured for normal, extensive, or no POST execution. You can also control the level of tests that run, the amount of POST output that is displayed, and which reset events trigger POST by using ALOM CMT CLI variables.
TABLE 1-7 lists the ALOM CMT CLI variables used to configure POST. FIGURE 1-8 shows how the variables work together.
| Note - Use the ALOM CMT CLI setsc command to set all the parameters in TABLE 1-7 except setkeyswitch. |
|
The system can power on and run POST (based on the other parameter settings). For details see FIGURE 1-8. This parameter overrides all other commands. |
||
|
The system can power on and run POST, but no flash updates can be made. |
||
|
Runs POST with preset values for diag_level and diag_verbosity. |
||
|
If diag_mode = normal, runs all the minimum tests plus extensive CPU and memory tests. |
||
|
Only runs POST for the first power on. This option is the default. |
||
|
POST output displays functional tests with a banner and pinwheel. |
||
|
POST displays all test, informational, and some debugging messages. |
FIGURE 1-8 Flowchart of ALOM CMT CLI Variables for POST Configuration

TABLE 1-8 shows typical combinations of ALOM CMT CLI variables and associated POST modes.
|
setkeyswitch[1] |
||||
|
This is the default POST configuration. This configuration tests the system thoroughly, and suppresses some of the detailed POST output. |
POST does not run, resulting in quick system initialization. This is not a suggested configuration. |
POST runs the full spectrum of tests with the maximum output displayed. |
POST runs the full spectrum of tests with the maximum output displayed. |
1. Access the ALOM CMT CLI sc> prompt:
At the console, issue the #. key sequence:
2. Use the ALOM CMT CLI sc> prompt to change the POST parameters.
Refer to TABLE 1-7 for a list of ALOM CMT CLI POST parameters and their values.
The setkeyswitch parameter sets the virtual keyswitch, so this parameter does not use the setsc command. For example, to change the POST parameters using the setkeyswitch command, enter the following:
To change the POST parameters using the setsc command, you must first set the setkeyswitch parameter to normal. Then you can change the POST parameters using the setsc command:
You can use POST for basic hardware verification and diagnosis, and for troubleshooting as described in the following sections.
POST tests critical hardware components to verify functionality before the system boots and accesses software. If POST detects an error, the faulty component is disabled automatically, preventing faulty hardware from potentially harming software.
You can use POST as an initial diagnostic tool for the system hardware. In this case, configure POST to run in maximum mode (diag_mode=service, setkeyswitch=diag, diag_level=max) for thorough test coverage and verbose output.
This procedure describes how to run POST when you want maximum testing, as in the case when you are troubleshooting a server or verifying a hardware upgrade or repair.
1. Switch from the system console prompt to the sc> prompt by issuing the #. escape sequence.
2. Set the virtual keyswitch to diag so that POST will run in service mode.
3. Reset the system so that POST runs.
There are several ways to initiate a reset. EXAMPLE 1-2 shows the powercycle command. For other methods, refer to the Sun Netra T5220 Server Administration Guide.
4. Switch to the system console to view the POST output:
EXAMPLE 1-3 depicts abridged POST output.
5. Perform further investigation if needed.
a. Interpret the POST messages:
POST error messages use the following syntax:
c:s > ERROR: TEST = failing-test
c:s > H/W under test = FRU
c:s > Repair Instructions: Replace items in order listed by H/W under test above
c:s > MSG = test-error-message
c:s > END_ERROR
In this syntax, c = the core number, s = the strand number.
Warning and informational messages use the following syntax:
In EXAMPLE 1-4, POST reports a memory error at FB-DIMM location /SYS/MB/CMP0/BR2/CH0/D0. The error was detected by POST running on core 7, strand 2.
b. Run the showfaults command to obtain additional fault information.
The fault is captured by ALOM CMT CLI, where the fault is logged, the Service Required LED is lit, and the faulty component is disabled.
ok .# sc> showfaults Last POST Run: Wed Jun 27 21:29:02 2007 Post Status: Passed all devices ID FRU Fault 0 /SYS/MB/CMP0/BR2/CH0/D0 SP detected fault: /SYS/MB/CMP0/BR2/CH0/D0 Forced fail (POST) |
In this example, /SYS/MB/CMP0/BR2/CH0/D0 is disabled. The system can boot using memory that was not disabled until the faulty component is replaced.
| Note - You can use ASR commands to display and control disabled components. See Managing Components With Automatic System Recovery Commands. |
In most cases, when POST detects a faulty component, POST logs the fault and automatically takes the failed component out of operation by placing the component in the ASR blacklist (see Managing Components With Automatic System Recovery Commands).
In most cases, the replacement of the faulty FRU is detected when the service processor is reset or power cycled. In this case, the fault is automatically cleared from the system. This procedure describes how to identify POST detected faults and, if necessary, manually clear the fault.
1. After replacing a faulty FRU, at the ALOM CMT CLI prompt use the showfaults command to identify POST detected faults.
POST detected faults are distinguished from other kinds of faults by the text:
Forced fail, and no UUID number is reported.
sc> showfaults Last POST Run: Wed Jun 27 21:29:02 2007 Post Status: Passed all devices ID FRU Fault 0 /SYS/MB/CMP0/BR2/CH0/D0 SP detected fault: /SYS/MB/CMP0/BR2/CH0/D0 Forced fail (POST) |
If no fault is reported, you do not need to do anything else. Do not perform the subsequent steps.
2. Use the enablecomponent command to clear the fault and remove the component from the ASR blacklist.
Use the FRU name that was reported in the fault in Step 1.
The fault is cleared and should not show up when you run the showfaults command. Additionally, the Service Required LED is no longer on.
You must reboot the server for the enablecomponent command to take effect.
4. At the ALOM CMT CLI prompt, use the showfaults command to verify that no faults are reported.
sc> showfaults Last POST run: THU MAR 09 16:52:44 2006 POST status: Passed all devices No failures found in System |
The Solaris Predictive Self-Healing (PSH) technology enables the server to diagnose problems while the Solaris OS is running, and mitigate many problems before they negatively affect operations.
The Solaris OS uses the fault manager daemon, fmd(1M), which starts at boot time and runs in the background to monitor the system. If a component generates an error, the daemon handles the error by correlating the error with data from previous errors and other related information to diagnose the problem. Once diagnosed, the fault manager daemon assigns the problem a Universal Unique Identifier (UUID) that distinguishes the problem across any set of systems. When possible, the fault manager daemon initiates steps to self-heal the failed component and take the component offline. The daemon also logs the fault to the syslogd daemon and provides a fault notification with a message ID (MSGID). You can use the message ID to get additional information about the problem from Sun’s knowledge article database.
The Predictive Self-Healing technology covers the following server components:
The PSH console message provides the following information:
If the Solaris PSH facility detects a faulty component, use the fmdump command to identify the fault. Faulty FRUs are identified in fault messages using the FRU name. For a list of FRU names, see TABLE 2-1.
When a PSH fault is detected, a Solaris console message similar to EXAMPLE 1-8 is displayed.
Faults detected by the Solaris PSH facility are also reported through service processor alerts. EXAMPLE 1-9 depicts an ALOM CMT CLI alert of the same fault reported by Solaris PSH in EXAMPLE 1-8.
The ALOM CMT CLI showfaults command provides summary information about the fault. See Displaying System Faults for more information about the showfaults command.
| Note - The Service Required LED is also turns on for PSH diagnosed faults. |
The fmdump command displays the list of faults detected by the Solaris PSH facility and identifies the faulty FRU for a particular EVENT_ID (UUID).
Do not use fmdump to verify a FRU replacement has cleared a fault because the output of fmdump is the same after the FRU has been replaced. Use the fmadm faulty command to verify the fault has cleared.
1. Check the event log using the fmdump command with -v for verbose output:
In EXAMPLE 1-10, a fault is displayed, indicating the following details:
| Note - fmdump displays the PSH event log. Entries remain in the log after the fault has been repaired. |
2. Use the Sun message ID to obtain more information about this type of fault.
a. Obtain the message ID from the console output or the ALOM CMT CLI showfaults command.
b. Enter the message ID in the SUNW-MSG-ID field, and click Lookup.
In EXAMPLE 1-11, the message ID SUN4V-8000-JA provides information for corrective action:
3. Follow the suggested actions to repair the fault.
When the Solaris PSH facility detects faults the faults are logged and displayed on the console. In most cases, after the fault is repaired, the corrected state is detected by the system and the fault condition is repaired automatically. However, this must be verified and, in cases where the fault condition is not automatically cleared, the fault must be cleared manually.
1. After replacing a faulty FRU, power on the server.
2. At the ALOM CMT CLI prompt, use the showfaults command to identify PSH detected faults.
PSH detected faults are distinguished from other kinds of faults by the text:
Host detected fault.
3. Run the ALOM CMT CLI clearfault command with the UUID provided in the showfaults output.
sc> clearfault 7ee0e46b-ea64-6565-e684-e996963f7b86 Clearing fault from all indicted FRUs... Fault cleared. |
4. Clear the fault from all persistent fault records.
In some cases, even though the fault is cleared, some persistent fault information remains and results in erroneous fault messages at boot time. To ensure that these messages are not displayed, perform the following Solaris command:
With the Solaris OS running on the server, you have the full complement of Solaris OS files and commands available for collecting information and for troubleshooting.
If POST, service processor, or the Solaris PSH features do not indicate the source of a fault, check the message buffer and log files for notifications for faults. Hard drive faults are usually captured by the Solaris message files.
Use the dmesg command to view the most recent system message. To view the system messages log file, view the contents of the /var/adm/messages file.
The dmesg command displays the most recent messages generated by the system.
The error logging daemon, syslogd, automatically records various system warnings, errors, and faults in message files. These messages can alert you to system problems such as a device that is about to fail.
The /var/adm directory contains several message files. The most recent messages are in the /var/adm/messages file. After a period of time (usually every ten days), a new messages file is automatically created. The original contents of the messages file are rotated to a file named messages.1. Over a period of time, the messages are further rotated to messages.2 and messages.3, and then deleted.
2. Type the following command:
3. If you want to view all logged messages, type the following command:
The Automatic System Recovery (ASR) feature enables the server to automatically configure failed components out of operation until they can be replaced. In the server, theASR feature manages the following components:
The database that contains the list of disabled components is called the ASR blacklist (asr-db).
In most cases, POST automatically disables a faulty component. After the cause of the fault is repaired (FRU replacement, loose connector reseated, and so on), you must remove the component from the ASR blacklist.
The ASR commands (TABLE 1-10) enable you to view, and manually add or remove components from the ASR blacklist. You run these commands from the ALOM CMT CLI sc> prompt.
|
Removes a component from the asr-db blacklist, where asrkey is the component to enable. |
|
|
Adds a component to the asr-db blacklist, where asrkey is the component to disable. |
|
| Note - The components (asrkeys) vary from system to system, depending on how many cores and memory are present. Use the showcomponent command to see the asrkeys on a given system. |
| Note - A reset or power cycle is required after disabling or enabling a component. If the status of a component is changed, there is no effect to the system until the next reset or power cycle. |
The showcomponent command displays the system components (asrkeys) and reports their status.
At the sc> prompt, enter the showcomponent command
EXAMPLE 1-12 shows partial output with no disabled components.
EXAMPLE 1-13 shows showcomponent command output with a component disabled:
The disablecomponent command disables a component by adding it to the ASR blacklist.
1. At the sc> prompt, enter the disablecomponent command.
sc> disablecomponent /SYS/MB/CMP0/BR1/CH0/D0 Chassis | major: /SYS/MB/CMP0/BR1/CH0/D0 has been disabled. Disabled by user |
2. After receiving confirmation that the disablecomponent command is complete, reset the server so that the ASR command takes effect.
The enablecomponent command enables a disabled component by removing it from the ASR blacklist.
1. At the sc> prompt, enter the enablecomponent command.
sc> enablecomponent /SYS/MB/CMP0/BR1/CH0/D0 Chassis | major: /SYS/MB/CMP0/BR1/CH0/D0 has been enabled. |
2. After receiving confirmation that the enablecomponent command is complete, reset the server for so that the ASR command takes effect.
Sometimes a server exhibits a problem that cannot be isolated definitively to a particular hardware or software component. In such cases, it might be useful to run a diagnostic tool that stresses the system by continuously running a comprehensive battery of tests. Sun provides the SunVTS software for this purpose.
This section describes the tasks necessary to use SunVTS software to exercise your server:
This procedure assumes that the Solaris OS is running on the server, and that you have access to the Solaris command line.
1. Check for the presence of SunVTS packages using the pkginfo command.
TABLE 1-11 lists SunVTS packages:
The SunVTS 6.0 PS3 software, and future compatible versions, are supported on the server.
SunVTS installation instructions are described in the SunVTS User’s Guide.
Before you begin, the Solaris OS must be running. You also must ensure that SunVTS validation test software is installed on your system. See Checking Whether SunVTS Software Is Installed.
The SunVTS installation process requires that you specify one of two security schemes to use when running SunVTS. The security scheme you choose must be properly configured in the Solaris OS for you to run SunVTS. For details, refer to the SunVTS User’s Guide.
SunVTS software features both character-based and graphics-based interfaces. This procedure assumes that you are using the graphical user interface (GUI) on a system running the Common Desktop Environment (CDE). For more information about the character-based SunVTS TTY interface, and specifically for instructions on accessing it by tip or telnet commands, refer to the SunVTS User’s Guide.
SunVTS software can be run in several modes. This procedure assumes that you are using the default mode.
This procedure also assumes that the server is headless. That is, it is not equipped with a monitor capable of displaying bitmap graphics. In this case, you access the SunVTS GUI by logging in remotely from a machine that has a graphics display.
Finally, this procedure describes how to run SunVTS tests in general. Individual tests might presume the presence of specific hardware, or might require specific drivers, cables, or loopback connectors. For information about test options and prerequisites, refer to the following documentation:
1. Log in as superuser to a system with a graphics display.
The display system should be one with a frame buffer and monitor capable of displaying bitmap graphics such as those produced by the SunVTS GUI.
where test-system is the name of the server you plan to test.
3. Remotely log in to the server as superuser.
Use a command such as rlogin or telnet.
If you have installed SunVTS software in a location other than the default /opt directory, alter the path, as in EXAMPLE 1-15.
where display-system is the name of the machine through which you are remotely logged in to the server.
The SunVTS GUI is displayed (FIGURE 1-9).

5. Expand the test lists to see the individual tests.
The test selection area lists tests in categories, such as Network, as shown in FIGURE 1-10. To expand a category, left-click the

FIGURE 1-10 SunVTS Test Selection Panel

6. (Optional) Select the tests you want to run.
Certain tests are enabled by default, and you can choose to accept these.
Alternatively, you can enable and disable individual tests or blocks of tests by clicking the checkbox next to the test name or test category name. Tests are enabled when checked, and disabled when not checked.
TABLE 1-12 lists tests that are especially useful to run on this server.
|
cmttest, cputest, fputest, iutest, l1dcachetest, dtlbtest, and l2sramtest - indirectly: mptest, and systest |
|
7. (Optional) Customize individual tests.
You can customize individual tests by right-clicking on the name of the test. For example, in FIGURE 1-10, right-clicking on the text string ce0(nettest) brings up a menu that enables you to configure this Ethernet test.
Click the Start button that is located at the top left of the SunVTS window. Status and error messages appear in the test messages area located across the bottom of the window. You can stop testing at any time by clicking the Stop button.
During testing, SunVTS software logs all status and error messages. To view these messages, click the Log button or select Log Files from the Reports menu. This action opens a log window from which you can choose to view the following logs:
To obtain support for your system, you need your chassis serial number. The chassis serial number is located on a sticker that is on the front of the server and another sticker on the side of the server. You can also run the ALOM CMT CLI showplatform command to obtain the chassis serial number.
sc> showplatform SUNW,Sun-Netra-T5220 Chassis Serial Number: xxxxxxxxxxxx Domain Status ------ ------ S0 OS Standby sc> |
In addition to this service manual, the following resources are available to help you keep your server running optimally. These documents are available at:
http://www.oracle.com/technetwork/indexes/documentation/index.html