Statistics Graphs Window (Grapher Window)
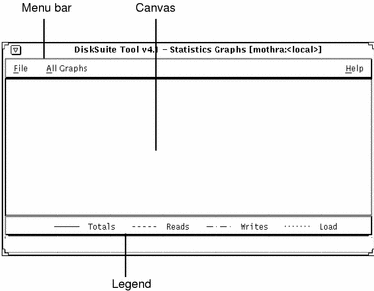
Figure 4-7 shows the Statistics Graph window (Grapher window). The Grapher window functions as a visual log of reported statistics utilizing a graph for each device. The Grapher window displays a subset of the information derived by the iostat(1M) interface. You can drag and drop metadevices and disks from any of DiskSuite Tool's windows to the Statistics Graphs window. This includes the Metadevice Editor canvas, the Metadevice Editor Objects list, the Slice window, and the Disk View window. An explanation of the Grapher window follows.
Figure 4-7 Statistics Graphs Window (Grapher Window)

-
Menu Bar - Contains two menus titled File and All Graphs. For more information on these menus, see the online help (the section "Accessing and Using Help" describes how to access help).
-
Canvas - Shows instantaneous statistics, and has toggle buttons for controlling the information displayed.
-
Legend - Contains a legend for all the graphs.
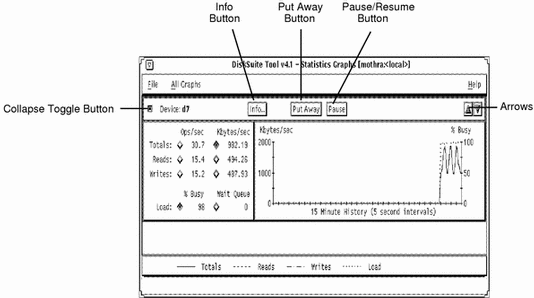
When you add a device to the Grapher window, a button bar appears. If you continue to add devices on the canvas, they appear in individual rows with a control area and graph. Figure 4-8 shows the Grapher window with a metadevice. An explanation of the buttons follows.
Figure 4-8 Grapher Window with Metadevice

-
Collapse Toggle Button - Collapses a canvas row.
-
Info Button - Displays the device's Information window.
-
Put Away Button - Removes the device from the Grapher window.
-
Pause/Resume Button - Suspends updates to the Grapher window (Pause), or alternately, resumes updates (Continue).
- © 2010, Oracle Corporation and/or its affiliates
