| C H A P T E R 5 |
|
ILOM 3.0 Diagnostic Tools |
The ILOM 3.0 software running on your service processor (SP) has a complete suite of diagnostic capabilities. You can view event logs, the state of the sensors on the server node, and a list of critical faults, if any.
This chapter includes the following topics:
At minimum, you need to know the IP address of the Chassis Monitoring Module (CMM). Refer to the Sun Integrated Lights Out Manager User’s Guide for a procedure to obtain the CMM IP address.
After you have obtained the IP address of the CMM, you can obtain the IP address of the SP. The next topic describes a procedure for obtaining the SP IP address through the CMM ILOM web interface. Refer to Sun Blade X6275 Server Module Installation Guide for a procedure using the ILOM CLI.
Choose one of the following methods to log in to the SP:
|
1. Open a browser and type http://<CMM IP address>
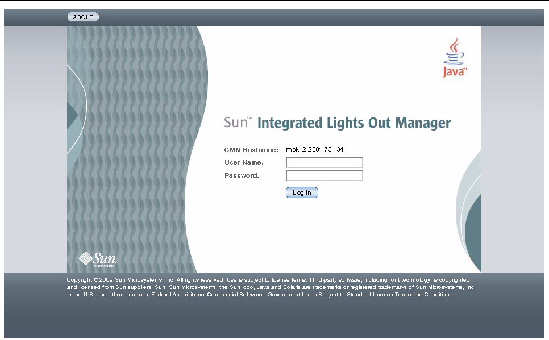
The CMM ILOM Welcome screen appears:
FIGURE 5-1 ILOM 3.0 GUI Welcome Screen
2. Enter root as your username and changeme as your password (unless you have previously changed your password).
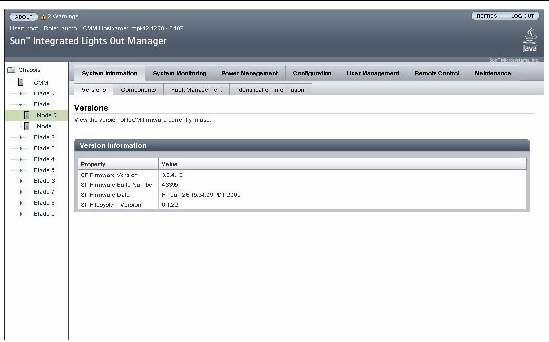
The CMM ILOM System Information > Versions tab opens:
FIGURE 5-2 ILOM 3.0 GUI: System Information > Versions View
3. To log in to the SP for a node, click on the node’s name in the left navigation pane or in the image in the right pane.
The home page (System Information tab) for the node appears in the ILOM web interface:
| Note - Under each X6275 blade are 2 nodes: node 0 and node 1. In the GUI, all the top nodes are numbered Node 0, and all the bottom nodes are numbered Node 1. |
| Note - When you are logged in to the SP through the CMM ILOM web interface, you can obtain the IP address of the SP by selecting the Configuration tab and then the Network tab. |
|
1. Open a browser and type http://<SP IP address>
The SP ILOM welcome screen opens.
2. Enter root as your username and changeme as your password (unless you have previously changed your password).
The ILOM web interface presents the home page (System Information tab) for the node.
|
1. Open a terminal and type ssh root@<CMM IP address>
2. Enter changeme as your password (unless you have previously changed your password).
You are logged in to the CMM CLI. The CLI prompt appears:
->
3. To log in to the CLI for node 1 of blade 6, for example, enter this command:
-> start /CH/BL6/NODE1/SP/cli
Are you sure you want to start /CH/BL6/NODE1/SP/cli (y/n)? y
You are logged in to the CLI for the SP of that node. The CLI prompt appears:
->
4. Change directories to the host or to the SP:
To change directories to the host, type:
cd /SYS
To change directories to the SP, type:
cd /SP
|
ssh root@SP_IP_address
2. Enter changeme as your password (unless you have previously changed your password).
You are logged in to the CLI for the SP of that node. The CLI prompt appears:
->
3. Change directories to the host or to the SP:
To change directories to the host, type:
cd /SYS
To change directories to the SP, type:
cd /SP
|
1. Connect via a terminal window.
2. Type root at the login prompt
The default command prompt appears:
 ->
4. Enter changeme as your password (unless you have previously changed your password).
Once you have successfully logged in, the service processor displays the SP default command prompt:
SP->
You can now run CLI commands. Change the IP address if you need a different static IP address.
| Note - If you connect a terminal or emulator to the serial port before it has been powered up or during its power up sequence, you will see bootup messages. |
By default, each new system comes with the IP address and DHCP enabled.
Choose one of the following methods for monitoring your node with ILOM:
You can use the System Information and System Monitoring views of the ILOM web interface to monitor the status of the server module and its components.
2. Log in to the web interface. See one of the following:
To Log In to the SP Through the CMM ILOM Web Interface
To Log In to the SP ILOM Web Interface Directly
The System Information view opens.
3. Select the submenu screens to view system and component information.
TABLE 5-1 lists the System Information submenu tab functions.
|
See Fault Management. |
|
|
Change the SP identification information, such as host name and address. |
Refer to the Integrated Lights Out Manager Administration Guide for more information about the System Information tab.
4. Click the System Monitoring tab.
The System Monitoring submenu screens appear.
TABLE 5-2 lists the submenu tabs and tasks.
Refer to the Integrated Lights Out Manager Administration Guide, for more information about the System Monitoring tab.
You can use the ILOM CLI to monitor the server module status and the status of its components
2. Log in to the CLI. See either of the following:
To Log In to the SP CLI Through the CMM ILOM CLI
To Log In to the SP ILOM CLI Directly
->
3. Navigate to the /SYS namespace.
4. Use the CLI cd (change directory) command to navigate to individual components listed below:
For example, from the /SYS namespace, enter cd MB/P0/D1 to look at DIMM 1 of processor 0:
-> cd MB/P0/D1
/MB/P0/D1

-> show

 /SYS/MB/P0/D1
    Targets:
        PRSNT
        SERVICE

    Properties:
        type = DIMM
        ipmi_name = P0/D1
        fru_name = 2GB DDR3 SDRAM 533
        fru_manufacturer = Hynix Semiconductor Inc.
        fru_version = 5442
        fru_part_number = HMT125R7AFP4C-G7
        fru_serial_number = 200E0000
        fault_state = OK
        clear_fault_action = (none)

    Commands:
        cd
        set
        show
For example, from /SYS/MB/, to look at processor 0:
-> cd /SYS/MB/PO
/SYS/MB/P0
-> show

 /SYS/MB/P0
    Targets:
        D1
        D3
        D5
        PRSNT
        SERVICE

    Properties:
        type = Host Processor
        ipmi_name = P0
        fault_state = OK
        clear_fault_action = (none)

    Commands:
        cd
        set
        show
For example, from /SYS/MB/, to look at the motherboard:
-> cd /SYS/MB/
/SYS/MB

-> show

 /SYS/MB
    Targets:
        BIOS
        CPLD
        NET0
        P0
        P1
        T_AMB_FRONT
        T_AMB_REAR

    Properties:
        type = Motherboard
        ipmi_name = MB
        product_name = SUN BLADE X6275 SERVER MODULE
        product_part_number = 000-0000-00
        product_serial_number = 0000000000
        product_manufacturer = SUN MICROSYSTEMS
        fru_name = VAYU-HPC,W/IB
        fru_part_number = 375-3603-01
        fru_serial_number = 0328MSL-09046R00KP
        fault_state = OK
        clear_fault_action = (none)

    Commands:
        cd
        set
        show
For more information about using the CLI to monitor and manage the server, refer to the Sun Integrated Lights Out Manager (ILOM) 3.0 CLI Procedures Guide (820-6412).
Your ILOM software includes the ability to diagnose faults as they occur, where faults are defined as system component failures or chassis problems, such as environmental parameters outside acceptable ranges.
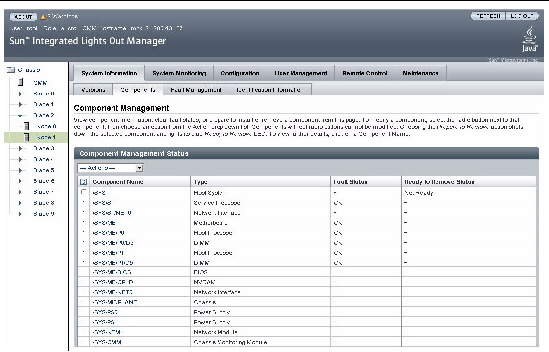
ILOM reports faults for server node components that have a fault_state property. You can see which components have this property by selecting the Components tab in the System Information view (tab). Components with the fault_state property show OK or Fault in the Fault Status column of the Component Management Status table. Components that lack the fault_state property show a hyphen (-).
Chassis environmental values are not shown in the Component Management Status table; although, they can have a faulted status and can be listed in the Faulted Components table of the Fault Management view (tab).
Chassis faults include the following:
The following figure shows a typical list of system components. Only those that have entries other than a hyphen (-) in the Fault Status column can be reported as faults.
FIGURE 5-3 ILOM 3.0 GUI: System Information > Component Management View
There are three types of faults:
When correctable and uncorrectable faults occur, they do the following:
| Note - The Fault Management list is much more specific than the System Event Log (SEL). The SEL contains entries for every event that occurs, such as starting and stopping the system, while the Fault Management list only includes events that require service action. See To View the Fault Management List With the ILOM Web Interface. |
When you correct a component fault, you can clear it from the SP ILOM web interface System Information --> Components tab, using the Clear Faults action from the Actions drop-down list box. This also clears the fault from the Fault Management list and turns off the Service Action Required LED. Refer to the Sun Blade X6275 ILOM Supplement for a list of faults that you can clear.
Chassis faults must be cleared from the CMM, at which time they are also cleared from the SP.
Choose one of the following methods for viewing faults with ILOM:
|
1. Log in to the ILOM web interface for the server node’s SP. See one of the following:
To Log In to the SP Through the CMM ILOM Web Interface
To Log In to the SP ILOM Web Interface Directly
The interface opens to the System Information tab.
2. Select the System Information --> Fault Management tab.
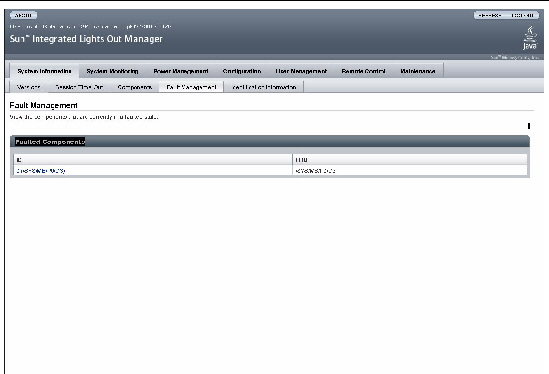
The Faulted Components list appears. If there are no faults, the list contains only the entry “No Items To Display.” If there is a fault, the faulted component is listed by component name, as shown in the following figure (example shown is through web interface directly):
FIGURE 5-4 ILOM 3.0 GUI: System Information > Fault Management View
3. Click the component name to obtain more information.
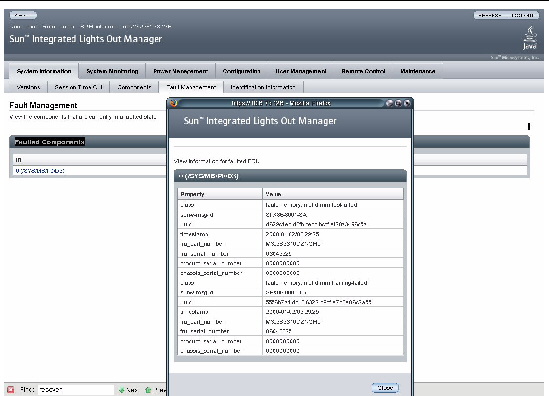
A dialog box opens with more detail. FIGURE 5-5 shows a faults on a hardware component. Below shows a fault on DIMM 3.
FIGURE 5-5 ILOM 3.0 GUI: System Information > Fault Management > Fault Dialog Box
|
1. Log in to the ILOM CLI for the server node’s SP. See one of the following:
To Log In to the SP CLI Through the CMM ILOM CLI
To Log In to the SP ILOM CLI Directly
->
2. Type the following command:
-> show /SP/faultmgmt -level all
The output will show all fault details.
Faults are written to the ILOM system event log. For example, an entry for a power supply fault might look like this:
Fault detected at time = Wed Jan 21 21:40:20 2009. The suspect component: /SYS/PS0 has fault.chassis.env.power.loss with probability=100. Refer to http://www.sun.com/msg/SPX86-8000-55 for details.
SPX86-8000-55 is a Knowledge Article that you can look up on www.sun.com/msg.
http://www.sun.com/msg/SPX86-8000-55 is a web page with a description of the fault, how to repair or clear it, and so forth.
Choose one of the following methods for viewing the ILOM system event log:
|
When a fault occurs, an entry is written to the system event log.
1. Log in to the ILOM web interface for the server node’s SP. See one of the following:
To Log In to the SP Through the CMM ILOM Web Interface
To Log In to the SP ILOM Web Interface Directly.
The interface opens to the System Information tab.
2. Select the System Monitoring tab.
3. Select the System Monitoring --> Event Logs tab.
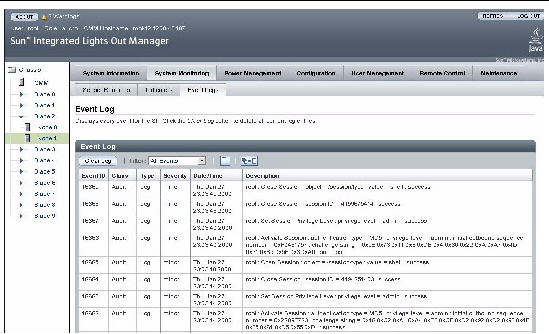
The Event Log opens, as shown in the following figure:
FIGURE 5-6 ILOM 3.0 GUI: System Monitoring > Event Logs (SEL) View
|
1. Log in to the ILOM CLI for the server node’s SP. See one of the following:
To Log In to the SP CLI Through the CMM ILOM CLI
To Log In to the SP ILOM CLI Directly.
-> show /SP/logs/event/list
ILOM’s Service Snapshot utility is used to create a “snapshot” of the server node that you can send to Sun Services for diagnosis. The utility collects log files, runs various commands and collects their output, and sends the data collection as a file to a user-defined location.
| Note - The purpose of the ILOM Snapshot utility is to collect data for use by Sun Services to diagnose problems. You should not run this utility unless requested to do so by Sun Services. |
Choose one of the following methods for creating a snapshot:
|
1. Log in to the ILOM web interface for the server node’s SP. See either of the following:
To Log In to the SP Through the CMM ILOM Web Interface
To Log In to the SP ILOM Web Interface Directly.
The interface opens to the System Information tab.
2. Select the Maintenance tab.
The Service Snapshot panel opens, as shown in the following figure:
FIGURE 5-7 ILOM 3.0 GUI: Maintenance > Service Snapshot View
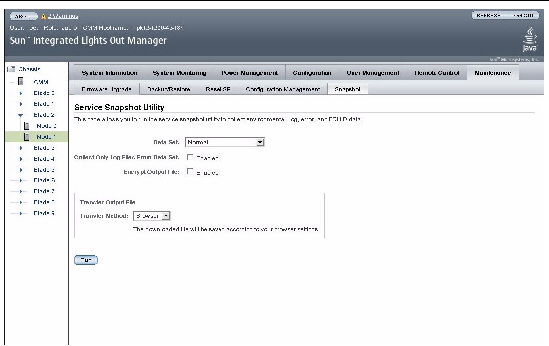
a. Choose a basic or extended dataset from the pull-down menu (Normal, FRUID, Full, Custom).
Normal--(default) Specifies that ILOM, operating system, and hardware information is to be collected.
Full--The maximum information. Specifies that all data is to be collected. (Note--Using this option may reset the running host.)
Custom--Select from options to include ILOM data, HW data, Diag data, basic OS data, FRUID data.
The default is normal, so in most cases you do not need to set the dataset property.
b. Choose to enable collecting only log files from the data set.
c. Choose to enable the encryption of the output file.
d. Chose the transfer output file method (Browser, SFTP, FTP).
4. After making selections, click Run.
5. Specify the path and filename of the file where you want the results written.
|
1. Log in to the ILOM CLI for the server node’s SP. See either of the following:
To Log In to the SP CLI Through the CMM ILOM CLI
To Log In to the SP ILOM CLI Directly.
The CLI prompt appears:
->
-> set /SP/diag/snapshot dataset=MODE
-> set dataset=full
normal--(default) Specifies that ILOM, operating system, and hardware information are to be collected.
normal-logonly--(default) Specifies that ILOM, operating system, and hardware information is to be collected.
full--Specifies that the maximum information is to be collected.
full-logonly--To collect only the log files from the dataset, select the log only options.
| Note - Because normal is the default, in most cases you do not need to set the dataset property. |
| Note - Using the full option may reset the running host. |
3. To initiate the snapshot data collection, enter:
-> set /SP/diag/snapshot dump_uri=URI
where URI specifies the target directory in the format:
protocol://username:password@host/directory
ftp://username:password@host_ip_address/data
where password is the actual administrator password for the domain.
And where the directory, data is relative to the user’s login.
|
1. Use the cd command to get to the /SP/diag/snapshot directory:
-> cd SP/diag/snapshot
/SP/diag/snapshot
2. Use the show command to view the dataset property:
-> show

 /SP/diag/snapshot
    Targets:

    Properties:
        dataset = normal
        dump_uri = (Cannot show property)
        encrypt_output = false
        result = (none)

    Commands:
        cd
        set
        show
Copyright © 2009 Sun Microsystems, Inc. All rights reserved.