| Sun Blade X6275 Server Module Diagnostics Guide |
| C H A P T E R 6 |
|
Performing Pc-Check Diagnostic Tests |
This chapter describes how to use the Pc-Check diagnostic tests, provided on the Integrated Lights Out Manager (ILOM).
This chapter contains the following sections:
| Note - The screen shots examples in this chapter are from Pc-Check version 6.21. Your version of Pc-Check might vary. |
If you are having a problem with your system, you can use the Pc-Check diagnostic tests to diagnose and possibly solve the problem.
The Pc-Check diagnostics can test and detect problems on all motherboard components, drives, ports, and slots. This program can be accessed and executed from ILOM.
There are three options for running Pc-Check:
1. Ensure that the host power is off.
2. Log in to the ILOM web interface. See one of the following:
To Log In to the SP Through the CMM ILOM Web Interface
To Log In to the SP ILOM Web Interface Directly
3. Select the Remote Control tab and then the Diagnostics tab.
The Diagnostics view opens as shown in FIGURE 6-1:
FIGURE 6-1 ILOM GUI: Diagnostics View

4. From the Boot drop-down list, select the level of Pc-Check diagnostics to be run. For example Manual, as shown in FIGURE 6-2:
FIGURE 6-2 ILOM 2.0 GUI: Diagnostics View > Manual Boot Drop-down List
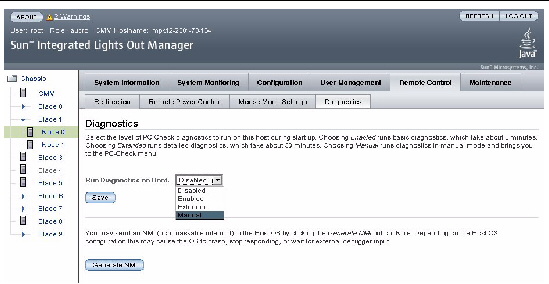
| Note - The default for Run Diagnostics on Boot is Disabled, which means that Pc-Check does not run when you boot the server. The other Pc-Check levels, Enabled, Extended, and Manual, will run Pc-Check automatically when the server boots. Their results are written to a diagnostic partition, if any, on the boot disk. However, because the Sun Blade X6275 server has very limited disk space, Sun recommends that you do not create a diagnostic partition. Without a diagnostic partition, the only way you can see the results of Pc-Check diagnosis is to run Pc-Check in Manual mode. The output is displayed on a monitor or serial console connected to the system. See Viewing the Pc-Check Results.
The results of the automatic tests are also written to nonvolatile memory on the SP, where they can be accessed by Sun Services. |
The host will boot up to Pc-Check.
7. Click the Redirection submenu tab.
The Redirection screen appears:
FIGURE 6-3 ILOM 3.0 GUI: Remote Control > Redirection View
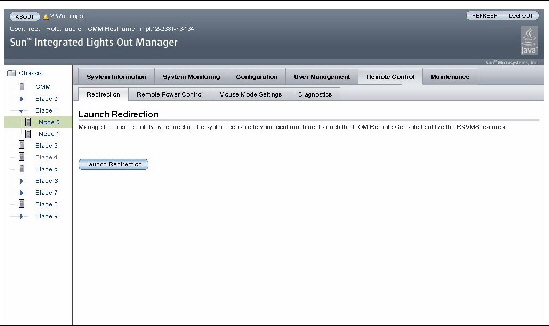
8. Click the Launch Redirection button.
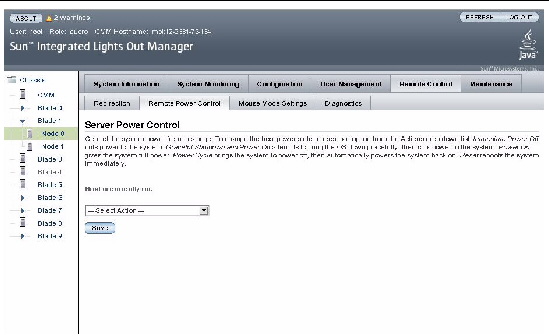
9. When redirection is established, return to the ILOM web interface (Remote Control tab) and select the Remote Power Control submenu.
FIGURE 6-4 ILOM 3.0 GUI: Remote Control > Remote Power Control View
10. Select Power On from the Select Action drop-down list box as shown in FIGURE 6-5.
FIGURE 6-5 ILOM 3.0 GUI: Remote Control > Remote Power Control > Power Cycle
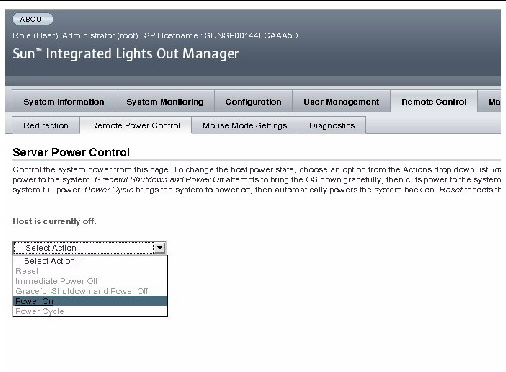
The system reboots to the Pc-Check main menu.
12. Return to the Redirection screen and follow the prompts to open the Pc-Check main menu, as shown in the following figure:

The following sections in this chapter describe the menu items and tests in detail.
The Pc-Check menu provides access to the following:
Use the arrow keys on the keyboard to navigate through the diagnostics software, the Enter key to select a menu item, and the ESC key to exit a menu. Navigation instructions appear at the bottom of each screen.
Click System Information in the Diagnostics main menu to view the System Information menu. Select items in this menu to see detailed information.
TABLE 6-1 describes the System Information menu options.
| Note - The Text File Editor command in the System Information Menu Options is of special importance. You use it to view the results of Pc-Check tests. See Viewing the Pc-Check Results. |
Advanced Diagnostics are used to test an individual device on the system. Most of the selections on this menu display information about the corresponding devices, and then offer a menu of testing options. For example, to test CPU 0, you can select Advanced Diagnostics, and then select Processor, and then select CPU0.
| Note - If you do not know which device to test, see Burn-In Testing. |
TABLE 6-2 gives the name and a brief description of many of the selections in the Advanced Diagnostics Tests menu.
| Note - Some of the tests in TABLE 6-2 might not be applicable for your server. |
Burn-in testing enables you to run test scripts and to create new scripts.
The Diagnostics main menu provides two burn-in selections, Immediate Burn-In Testing and Deferred Burn-In Testing.
Sun provides three ready-made scripts designed to test the general health of the devices on your system. These scripts include:
This script performs a series of tests that require the user to interact with the test software. When they require a user interaction, they stop and do not time out. These tests are faster than the full.tst but they are less thorough. For example, they do not run all the tests associated with a DIMM.
This script performs a non-detailed test of most hardware components, excluding those components that require user input (keyboard, mouse, sound, and video). This test does not require user input. It is normally the first test performed for hardware-related problems.
This script performs a detailed and comprehensive test on all hardware components, including those that require user input. It includes external port tests and requires loopback connectors on COM ports, parallel ports, and USB ports. You must interact with the test utility to progress through these interactive tests.
Use Immediate Burn-In Testing to run test scripts.
|
1. From the Diagnostics main menu, select Immediate Burn-In Testing.
The screen displays a list of settings shown in TABLE 6-3 and a Burn-In menu.
2. From the menu, select Load Burn-In Script.
3. Type the name of the script you want to run, for example quick.tst, noinput.tst, or full.tst.
4. To change any of the options, at the bottom of the screen, select Change Options.
This opens the Burn-In Options menu, which enables you to modify the options listed in TABLE 6-3 for the currently loaded test script.
5. Select Perform Burn-In Tests.
The diagnostics software executes the test script as configured.
Selecting Show Results Summary on the Diagnostics main menu displays the tests that have been run and lists the results, which can be Pass, Fail, or N/A.
This section shows the following tests conducted against the processor: Core Processor Tests, AMD 64-Bit Core Tests, Math Co-Processor Tests - Pentium Class FDIV and Pentium Class FIST, MMX Operation, 3DNow! Operation, SSE Instruction Set, SSE2 Instruction Set, and MP Symmetry.
This section shows the following tests conducted against the motherboard: DMA Controller Tests, System Timer Tests, Interrupt Test, Keyboard Controller Tests, PCI Bus Tests, and CMOS RAM/Clock Tests.
This section shows the following tests conducted against the various types of memory: Inversion Test Tree, Progressive Inversion Test, Chaotic Addressing Test, and Block Rotation Test.
This section shows the following tests conducted against the input device: Verify Device, Keyboard Repeat, and Keyboard LEDs.
This section shows the following tests conducted against the mouse: Buttons, Ballistics, Text Mode Positioning, Text Mode Area Redefine, Graphics Mode Positions, Graphics Area Redefine, and Graphics Cursor Redefine.
This section shows the following tests conducted against the video: Color Purity Test, True Color Test, Alignment Test, LCD Test, and Test Cord Test.
This section shows the following tests conducted against the multimedia components: Internal Speaker Test, FM Synthesizer Test, PCM Sample Test, CD/DVD Drive Read Test, CD/DVD Transfer (KB/Sec), CD/DVD Transfer Rating, CD/DVD Drive Seek Test, CD/DVD Seek Time (ms), CD/DVD Test Disk Read, and CD/DVD Tray Test.
This section shows the following tests conducted against ATAPI devices: Linear Read Test, Non-Destructive Write, and Random Read/Write Test.
This section shows the following tests conducted against the hard disk: Read Test, Read Verify Test, Non-Destructive Write Test, Destructive Write Test, Mechanics Stress Test, and Internal Cache Test.
This section shows the following tests conducted against the USB: Controller Tests and Functional Tests.
The compare test is used to determine the machine ID for the system. This test is not available for the Sun Blade X6275 server module.
The Print Results Report option enables you to print results of the diagnosis of your server if it is connected to a printer through a parallel port.
The Exit option exits the Pc-Check software and reboots the server module.
You can use the text file editor to view the results when you run Pc-Check manually. To do this, you need to know the name of the file or files produced by the tests.
For a summary of results, you can also go the main menu and see, Show Results Summary.
When you run a test, the header of the screen where you invoke the test shows you the name of the output file. For example, when you run the continuous burn-in test, the name of the output file is PCCHECK.BRN, as you can see in the following figure.
FIGURE 6-7 Pc-Check Continuous Burn-in Testing Page

Other files are named PCCHECK.xxx, for example, PCCHECK.JNL or PCCHECK.HII. The .HII file is especially important because it shows the entire host configuration at the time of failure.
When you know the name of the output file, you can use the text file editor to view the file.
1. Select the System Information Menu option on the Pc-Check Main Menu and press Enter.
The System Information Menu appears, as shown here:
FIGURE 6-8 OC-Check System Information Menu

2. Select the Text File Editor and press Enter.
You are prompted for a file name.
3. Type in the file name (for example, PCCHECK.JNL) and press Enter.
The editor opens with the file displayed, as shown here:
FIGURE 6-9 Pc-Check Journal File in Text Editor

| Sun Blade X6275 Server Module Diagnostics Guide | 820-6850-11 |
Copyright © 2009 Sun Microsystems, Inc. All rights reserved.
 To Perform Immediate Burn-In Testing