Displaying Summary Statistics
To display summary statistics:
-
Select the classes for which you want to see statistics using the navigation pane.
-
Specify a polling interval in seconds.
-
Click Resume.

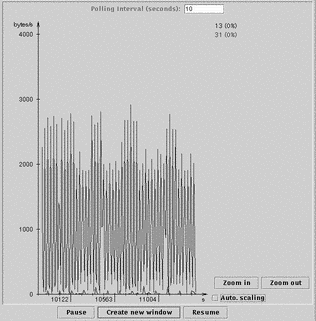
The display uses a different colored line for each class if you specify more than one. The color used is the same as that used to highlight the class name in the statistics navigation window.
The number of bytes sent or received, together with the percentage of bandwidth allocated used, is displayed in the upper right-hand corner of the window. These are shown in the same color as is used in the graph and the statistics navigation window. Move your mouse over the statistics to display the name of the class and interface concerned at the bottom of the window.
To display the statistics in a separate window, so that you can use the main batool window for other tasks, click the Create new window button.
To change the scale used for the statistics display, use the Zoom in and Zoom out buttons.
- © 2010, Oracle Corporation and/or its affiliates
