Displaying Flow Statistics
-
Display the Flow Statistics window by clicking the Flow Statistics tab.
-
Select the classes for which you want to see statistics using the navigation window.
-
Specify the Refresh interval and the number of flows you want to see at one time.
-
Click Resume to begin displaying statistics.
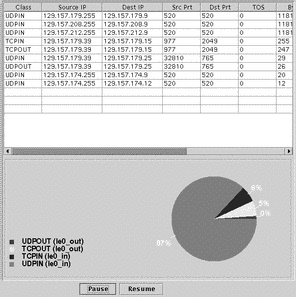
The Flow Statistics window looks like this: The upper pane contains information about traffic exchanges in the different flows. Each line represents a flow and specifies the source and destination IP addresses and port numbers, TOS value, number of bytes and packets exchanged, and a URL, if relevent. The lower pane contains a pie-chart summarizing the percentage of bandwidth used. By default, the pie-chart shows percentage of bandwidth used by each class. However, you can also display percentage of bandwidth used according to any of the values displayed in the top pane. For example, to see bandwidth use classified by source address, click anywhere in the source address column. The display in the lower
pane changes to match.
- © 2010, Oracle Corporation and/or its affiliates
