Chapter 15 Monitoring a Netra Proxy Cache Array and Proxy Cache Service
This chapter explains how to monitor a Netra Proxy Cache Array through the Netra Administration web pages. You can also monitor the array through an SNMP-conformant management platform. This support is described in Chapter 16, Netra Proxy Cache Array MIBs and Traps."
Proxy Cache and Array Monitoring Pages
To Invoke the Array Status Monitor or Proxy Cache Monitoring
You monitor a Netra Proxy Cache Array through links available in the Proxy Cache Administration page. See Chapter 3, Loading the Proxy Cache Administration Page,," for instructions on loading this page.
-
In the Proxy Cache Administration page, click Array Status, to monitor the Netra Proxy Cache Array, or Proxy Cache Monitoring, to view statistics related to the operation of the proxy cache service.
Array Status
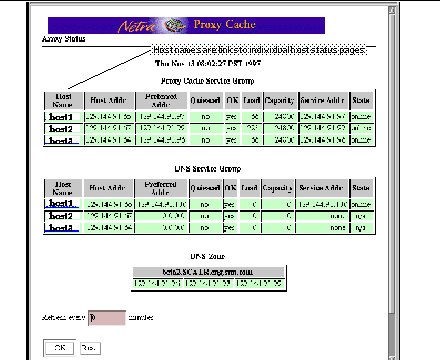
When you click the Array Status link in the Proxy Cache Administration page, a page such as that shown in Figure 15-1 is displayed.
Figure 15-1 Array Status Page

The Proxy Cache Service Group and DNS Service Group tables have a row for each host in the array. If a host is down, the row for that host flashes and displays in red. In the flashing row is displayed the cause of the host being absent from the array or a message "status unknown."
When you load the Array Status page, a snapshot of current array activity is displayed. If you want periodic updates, specify a number of minutes in the "Refresh" field at the bottom of the page. Click Reset to return the refresh value to 0.
Note -
In some browsers, when you use the refresh feature, the display of the Array Status page becomes disrupted, as if pages are overlaying one another, after about 40 updates. This is a characteristic of the browser software. No display disruption occurs with Netscape Navigator 4.04, as well as with other browsers. (Netscape and Netscape Navigator are trademarks of Netscape Communications Corporation.)
The tables in the Array Status page are described as follows:
Proxy Cache Service Group
Displays characteristics of all of the hosts in a Netra Proxy Cache Array that are, collectively, providing a single proxy cache service.
DNS Service Group
Refers to the DNS that is internal to the Netra Proxy Cache Array. One host in the array provides a DNS for the array, with the remaining hosts acting as hot spares. In Figure 15-1 and in your own Array Status page, note that only one host has a service address (the Service Addr column) and, when all hosts are up, only one host has a non-zero preferred address. A preferred address of 0.0.0.0 indicates a host's role as a hot spare.
DNS Zone
The subdomain formed by the array. The array DNS rotates proxy cache service addresses in round-robin fashion. Thus, the name of your array is resolved to a different proxy cache service address upon each resolve operation.
The headings in the Proxy Cache Service Group and DNS Service Group tables are described as follows:
Host Name
The host name associated with the array member and, also, associated with the host address (see next item). The Host Name entry is a link to a Host Status page, described below.
Note -
In the current release, for a host name link to work, the host name must be resolveable by the name service(s) configured on the server.
Host Addr
The IP address of the array member. That is, the address associated with the host name. Unlike the preferred address (see next item) and the service address, the host address remains fixed to a host.
Preferred Addr
The service address assigned to a host when the host first joined the array. This address might move to a different host in the array if the original owner fails. However, the address remains the preferred address of the original owner. When a host fails, you will note that its preferred address moves to a different host. The inheriting host will have two (or more) addresses in the Service Addr column: its own preferred address, plus the service address of the failed host. If a preferred address that has moved does not return to its original owner within a certain, configurable span of time (call the service timeout), that service address is removed from the service group. See "Proxy Cache" for a description of the service timeout property.
A preferred address of 0.0.0.0 (as in the DNS Service Group table) indicates that a host is a hot spare. For the proxy cache service, an array member has its own service address and stands ready to inherit another host's service address, if needed. For the DNS, only the array DNS server has its own service address; the remaining members can inherit the service address, but do not offer one of their own. If the array DNS server fails, you will note that its preferred address moves to another array member, where it shows up in the inheriting member's Service Addr column. At that point, no host displays a preferred address for the DNS.
Quiesced
Indicates whether the array member is quiesced or not. In the quiesced state, a host can service existing clients, but cannot acquire any service addresses. Also, a quiesced host is excluded from the array's DNS zone, so that it cannot acquire any new clients.
OK
Indicates whether any of a host's test objects has returned an OK or a not-OK (that is, failed) status. The test objects running on a host are displayed in the Host Status page, accessible by clicking on the host name (in the Host Name column).
Load and Capacity
Divide the load by the capacity to arrive at a percentage that indicates the resources consumed on a host. This percentage is significant to array software that monitors the load on individual array members. When a host exceeds a high water mark for load, the host is removed from the array DNS zone and is thus not available to new clients. An overloaded host returns to availability when its load falls beneath a low water mark.
Service Addr
The address associated with an instance of the proxy cache service. Upon startup of a host, a service address is associated with a given array member (for which it is the preferred address). Upon host failure, a service address moves to a different host, as distinguished from a host address, which remains fixed to a host. A given host might have two or more service addresses, indicating that other hosts in the array have failed and that those addresses have been inherited by the host with multiple service addresses.
State
The state of a service address. A service address can be in one of four states: unserved, acquiring, online, and releasing. The array software acts on a service address in only the unserved and online states. An online address is one that identifies a service for a requesting client. Only online addresses are included in the array's DNS zone. An unserved address is one that is not being served by any array member; such an address is not displayed in the monitoring page. Acquiring and releasing are intermediate states between unserved and online.
If a host is down (indicated by a flashing, red row), examine the remaining array members to see which member has acquired the down host's service address. Note the preferred address of the acquiring host. Then, note the service address that is not the acquiring host's preferred address. This address is the preferred address of the down host, failed over to the acquiring host.
Host Status
A host status page presents information on a given host within the array.
To Load the Host Status Page
-
In the Array Status page (see Figure 15-1) click on the host name of the host whose status you want to check.
You can click the host name in either the Proxy Cache Service Group or DNS Service Group tables.
Note -In the current release, for a host name link to work, the host name must be resolveable by the name service(s) configured on the server.
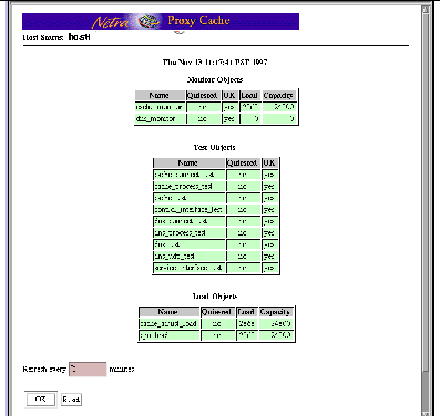
After clicking a host name, a page such as that shown in Figure 15-2 is displayed.
Figure 15-2 Host Status Page

When you load the Host Status page, a snapshot of current host activity is displayed. If you want periodic updates, specify a number of minutes in the "Refresh" field at the bottom of the page. Click Reset to return the refresh value to 0.
The tables in the Host Status page are described as follows:
Monitor Objects
Monitor objects identify the array software that provides a given service. The object cache_monitor controls the array software for the proxy cache service. The object dns_monitor controls the array software for the array's DNS.
A quiesced monitor object does not acquire new service addresses and withdraws its preferred service address from the array's DNS zone. Thus, a host could service an existing client but not acquire a new one. You use the scalrcontrol (1) utility, described in a man page, to quiesce a monitor object.
Test Objects
A test object is a software object that runs on a host to test a specific component of that host, such as the integrity of an interface or the existence of a process. A test object returns OK (yes) or not-OK (no) for the object it tests. There is a man page for each type of test object, in /opt/SUNWscalr/man/man5. A failure return from a test object can result in the failure of the service (as represented by the monitor object) on a host, That service on that host is considered to have failed and the array software moves the service address(es) associated with the failed service to the least-loaded host in the array.
A quiesced test object reports its last value prior to quiescence. You use the scalrcontrol (1) utility, described in a man page, to quiesce a test object.
Note that test objects run periodically, for example, every 10 minutes. This means that a test object will not detect a corrected condition till the next time it runs, so that, in the Host Status page, a test object displays "not OK" till the next time the test object code is run.
Load Objects
A load object returns a load and capacity for the component whose usage it measures. There is a man page for each load object, in /opt/SUNWscalr/man/man5. If load divided by capacity is a percentage that exceeds the high water mark set for the proxy cache service, the array software removes the service address(es) associated with the overloaded host from the array's DNS zone, thus making the overloaded host inaccessible to new clients.
A quiesced load object reports its last value prior to quiescence. You use the scalrcontrol (1) utility, described in a man page, to quiesce a load object.
See "Test and Load Objects" for further discussion of test and load objects and the relationship of those objects to monitor objects. See "Netra Proxy Cache Man Pages" for instructions on accessing Netra Proxy Cache man pages. If you have a serial connection to your server, you can view the properties related to the test and load objects in /etc/opt/SUNWscalr/scalrd.conf.
Proxy Cache Array Monitoring
The Proxy Cache Array Monitoring page presents status of and statistics for the proxy cache service provided by the array.
To Load the Proxy Cache Array Monitoring Page
-
In the Proxy Cache Administration page, click Proxy Cache Monitoring.
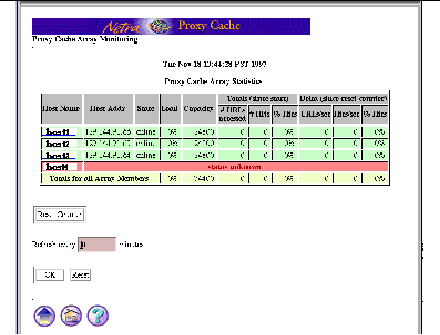
A page such as that shown in Figure 15-3 is displayed.
Figure 15-3 Proxy Cache Array Monitoring Page

When you load the Proxy Cache Array Monitoring page, a snapshot of current array activity is displayed. If you want periodic updates, specify a number of minutes in the "Refresh" field at the bottom of the page. Click Reset (next to OK) to return the refresh value to 0.
Click Reset Counter to return the URLs/sec and Hits/sec numbers in the Delta column, to zero.
The Proxy Cache Array Statistics table has a row for each host in the array. If a host is down, the row for that host flashes and displays in red. In the flashing row is displayed the cause of the host being absent from the array or a message "status unknown."
The Proxy Cache Array Monitoring page has a single table, Proxy Cache Array Statistics. The fields in this table are as follows:
Host Name
The host name associated with the array member and, also, associated with the host address (see next item). The Host Name entry is a link to a Proxy Cache Monitoring for Host page, described below.
Note -
In the current release, for a host name link to work, the host name must be resolveable by the name service(s) configured on the server.
Host Addr
The IP address of the array member. That is, the address associated with the host name.
State
The state of the service address associated with the proxy cache service on a host.
Load and Capacity
Divide the load by the capacity to arrive at a percentage that indicates the resources consumed on a host.
Under the Totals (since start) heading:
# URLs accessed
The number of requests for URLs fielded by the Netra Proxy Cache server.
# Hits
The number of URL requests for which the Netra Proxy Cache server was able to return an object from its own cache or the cache of another array member.
% Hits
The number of hits divided by the number of URLs accessed. This number tells you the extent to which the Netra Proxy Cache server is able to respond to URL requests from local caches.
Under the Delta (since reset counter) heading:
URLs/sec
The rate at which URL requests are being fielded by the Netra Proxy Cache Server, since the reset counter was last set to zero.
Hits/sec
The rate at which the Netra Proxy Cache Server was able to find requested objects in a local cache, since the reset counter was last set to zero.
% Hits
The number of hits divided by the number of URLs accessed, since the reset counter was last set to zero.
The row Totals for all Array Members gives the same types of statistics as described above, for all array members. This row gives you a picture of the proxy cache performance of the entire array.
Proxy Cache Monitoring for Host
A Proxy Cache Monitoring for host page presents proxy cache statistics for a given host within the array.
To Load the Proxy Cache Monitoring for Host Page
-
In the Proxy Cache Array Monitoring page (see Figure 15-3) click on the host name of the host whose statistics you want to check.
Note -In the current release, for a host name link to work, the host name must be resolveable by the name service(s) configured on the server.
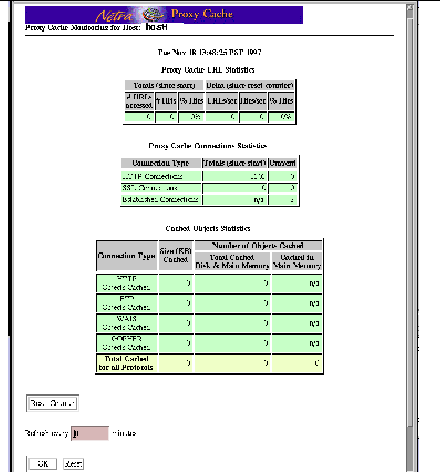
After clicking a host name, a page such as that shown in Figure 15-4 is displayed.
Figure 15-4 Proxy Cache Monitoring for Host Page

When you load the Proxy Cache Monitoring for Host page, a snapshot of current proxy cache statistics is displayed. If you want periodic updates, specify a number of minutes in the "Refresh" field at the bottom of the page. Click Reset to return the refresh value to 0.
The tables in the Proxy Cache Monitoring for Host page are described as follows:
Proxy Cache URL Statistics
Provides statistics on the rate of URL requests and the extent to which requests are serviced from the local cache.
Proxy Cache Connection Statistics
Provides statistics on HTTP and SSL connections.
Cached Object Statistics
Provides statistics on the number of objects cached, for each type of object.
The headings in the just-mentioned tables are described as follows:
In the Proxy Cache URL Statistics table:
Under Totals (since start):
# URLs accessed
The number of requests for a URL fielded by the Netra Proxy Cache server.
# Hits
The number of URL requests for which the Netra Proxy Cache server was able to return an object from its own cache.
% Hits
The number of hits divided by the number of URLs accessed. This is number tells you the extent to which the Netra Proxy Cache server is able to respond to URL requests from the local cache.
Under Delta (since reset counter):
URLs/sec
The rate at which URL requests are being fielded by the Netra Proxy Cache server, since the reset counter was last set to zero.
Hits/sec
The rate at which the Netra Proxy Cache server was able to find requested objects in a local cache, since the reset counter was last set to zero.
% Hits
URLs accessed divided by the number of hits, since the reset counter was last set to zero.
In the Proxy Cache Connections Statistics table:
Connection Type
Has rows for HTTP and SSL connections and for established connections.
Totals (since start)
The total number of connections for each connection type, HTTP and SSL, since the last reboot of the host.
Current
The number of current connections for each connection type, HTTP and SSL, and the number of current established connections.
In the Cached Object Statistics table:
Connection Type
HTTP, FTP, WAIS, or Gopher.
Size (KB) Cached
The size of all objects cached for a given object type.
Under Number of Objects Cached:
Total Cached Disk & Main Memory
In effect, total number of objects cached on host, for a given object type.
Cached in Main Memory
Number of objects cached in main memory. Only small objects are cached in main memory, as distinguished from disk.
- © 2010, Oracle Corporation and/or its affiliates
