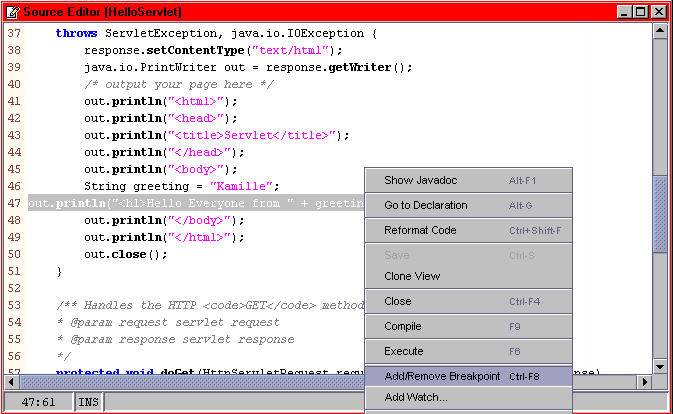
The line appears highlighted in red indicating the location is set with a breakpoint.
The KJS process launched in Part 4 is killed. After a moment, a debugger message appears indicating that the iPlanet Server engine is restarting. Then, after another moment, a new KJS process is started in the Execution window. Also, the Output window deployment messages appear indicating the WebModule WAR file is created and deployment is finished.
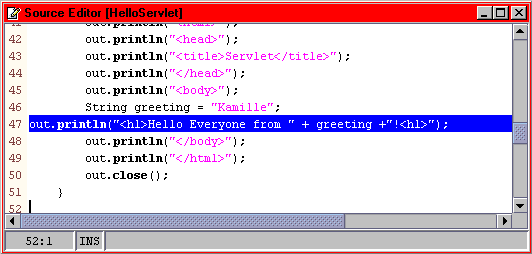
Additionally, the HelloServlet file displays in the Source Editor with the current breakpoint line displayed in blue.
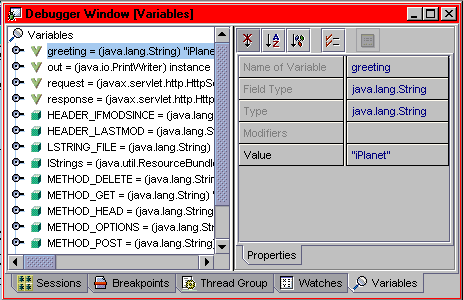
 Continue to finish executing your servlet.
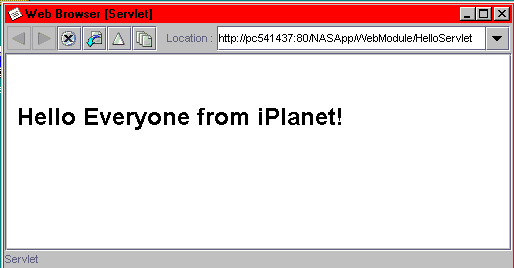
The resulting servlet is displayed in the Forte web browser. Notice that the greeting variable now appears as "iPlanet".
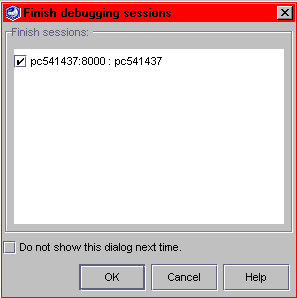
The Finish Debugging window appears.
Congratulations, you have successfully debugged your servlet on a local server.
You can also debug a deployed EJB in this same manner. Simply set breakpoints in the EJB classes and execute the servlet in debug mode. The application server will then stop on the breakpoints you set in the EJB classes.