 |
Execution Time
There are three central actions related to development of particular objects within the Forte IDE; deploy, execute, and debug.
The deploy action can be used upon EJBModules, WebModules, or J2EE Applications. Deployment is done first to establish to the IDE the context by which an associated executable component, such as a servlet, JSP, or web module can then be exercised. Without such context, the IDE will not know which J2EE application contained within a web module should be used or if the execution should occur with only the standalone deployed WebModule.
Therefore, during execution, no deployment activity takes place. Deployment must have been done prior to execution. As a reminder of this, the
following message is displayed in the iPlanet Deployment tab of the Output Window whenever an execute action is requested:

Upon execution, the following events occur:
The first attempt at this may take up to 60 seconds.
| NOTE:The KJS is restarted only if you starts the IDE or if a J2EE module has been deployed after the last KJS restart. |
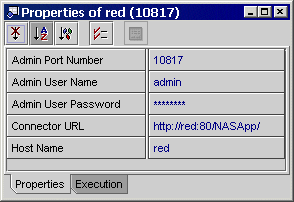
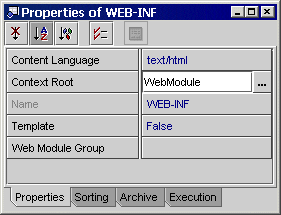
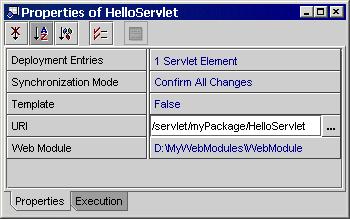
In this example, we would have: http://red:80/NASApp/WebModule/servlet/myPackage/HelloServlet
Debugging
You can use the Forte debugger tool to locate and correct bugs in your program. This tool can be used on servlets; JSP debugging is not supported with iPlanet Application Server 6.5.
When you execute a program with the debugger tool, you can start execution at any servlet. The program stops executing at set breakpoints in the servlet and you can interactively inspect and debug sections of code. To run the debugger tool, designate the entry point into your program by selecting a servlet from the Explorer Filesystems tab, then from the Debug menu select Start.
This action will:
You can add watches, analyse the threads, etc in the Debugger Window (Menu View--->Debugger Window)
For this example, we will set a debug breakpoint. This debug example uses the HelloServlet servlet that we created in Creating Servlets in this tutorial.
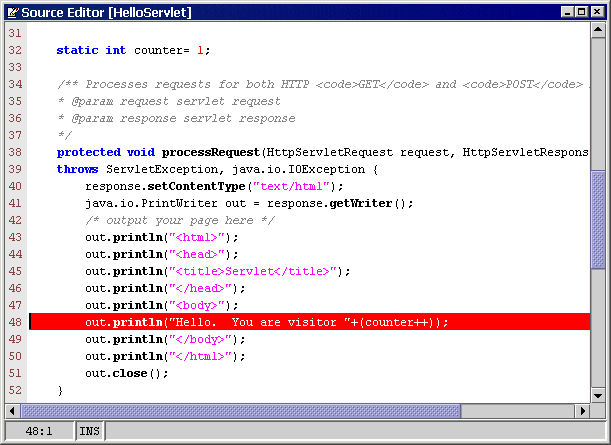
The line appears highlighted in red indicating the location is set with a breakpoint.
The KJS process launched in Creating Servlets is killed. After a moment, a debugger message appears indicating that the iPlanet Server engine is restarting. Then, after another moment, a new KJS process is started in the Execution window. Also, the Output window deployment messages appear indicating the WebModule WAR file is created and deployment is finished.
Additionally, the HelloServlet file displays in the Source Editor with the current breakpoint line displayed in blue.
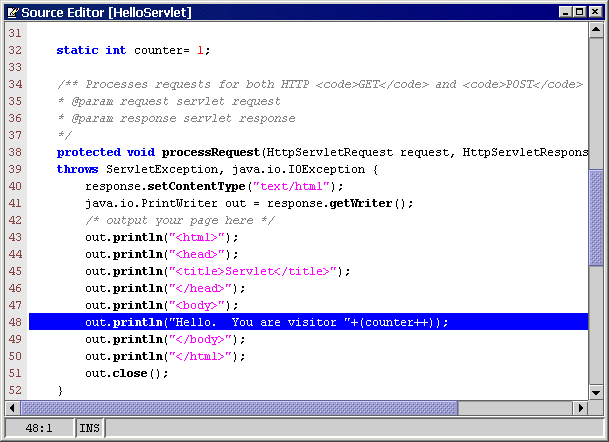
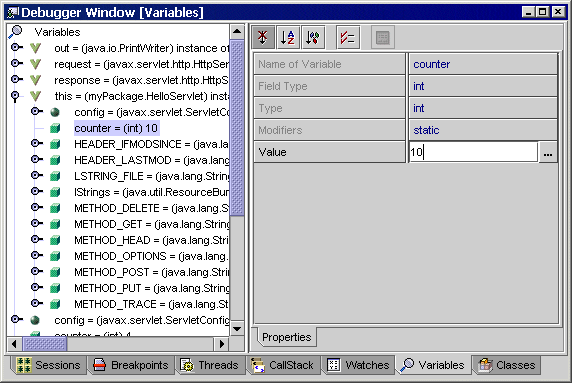
 Continue to finish executing your servlet.
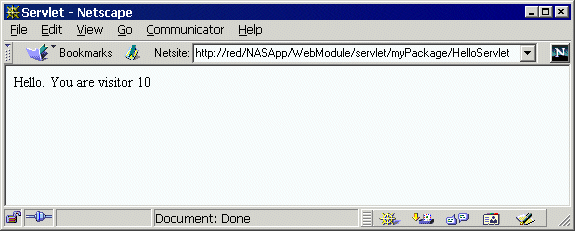
The resulting servlet is displayed in the web browser. Notice that the counter variable now appears as 10.
The Finish Debugging window appears.
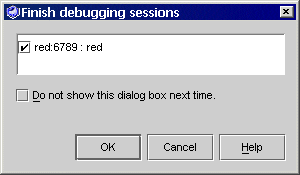
Congratulations, you have successfully debugged your servlet on a local server.
You can also debug a deployed EJB in this same manner. Simply set breakpoints in the EJB classes and execute the servlet in debug mode. The application server will then stop on the breakpoints you set in the EJB classes.
The next step in the iPlanet Application Server Integration Module Tutorial is localization of web modules.
| See also | |
|---|---|
| Creating a Session Entity Java Bean | |
| © 2002 Sun Microsystems, Inc. | terms of use privacy policy feedback |