Previous Next Contents Index


Chapter 3

Monitoring Server Activity

This chapter describes the monitoring service provided by Netscape Application Server Administrator. This service allows you to chart various attributes of the Executive, Java, and C++ server processes.

The following topics are included in this chapter:


Monitoring Netscape Application Server
Netscape Application Server (NAS) Administrator provides a monitoring service that lets you chart the activity of the Executive, Java, and C++ Servers that make up NAS. You can also log the information to a file. By graphically representing this server activity or recording the data in a file, you can track and review the performance of an application server or group of servers and make adjustments to improve performance. For example, if you add more memory to the application server or deploy a new application, you may want to monitor the performance of the application server to see what impact these changes have on it.

Netscape Application Server's monitoring service polls the application server at designated intervals. This saves server resources because the server updates the information being monitored at the interval instead of updating it continuously. You can specify this time interval in the Monitoring window. For information about setting the interval time, see Changing a Process Data Plot.

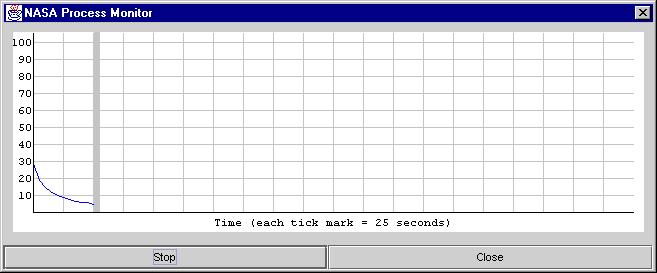
The monitoring window "pops out" from the administrator tool when you click a process to monitor. This enables you to monitor server activity in a separate window while continuing to perform other administrative tasks using the administrator tool.

Monitoring Process Attributes The server activity, or attributes, you can chart varies according to which server, or process, you are monitoring.

The Executive Server (KXS) process is responsible for managing and hosting the system-level services, such as the load-balancing service, and for delegating requests to one of the application processes, either the Java Server or the C++ Server, depending on the language in which the application is written.

You can chart the following attributes of the Executive Server process:

Executive Server Process Attribute
Description
CPU load
The amount of load on the CPU on which this Executive Server process is running, as calculated by the load balancing service.
Disk input and output
The rate of Read and Write operations issued by the system on which this Executive Server is running, as calculated by the load balancing service.
Memory thrash
The number of pages read from or written to the hard disk drive to resolve memory references to pages that were not in memory at the time of the reference.
Current requests
Number of requests currently waiting in the queue for processing.
Result cache entries
Number of entries stored in the result cache.
Average request time
Average amount of time for the Executive Server process to reply to a request.
Requests/interval
Number of new requests received since the last polling.
Total requests
Total number of requests the process has received.
Threads
Number of threads being used by the process.
Bytes sent/interval
Number of new bytes sent since the last polling.
Bytes received/interval
Number of new bytes received since the last polling.

Note. If you monitor CPU load, disk input and output, or memory thrash, you must specify the intervals at which the statistics for these process attributes are updated. To set the intervals, select the Load Balancing tab, then click Advanced Settings.

The Java Server (KJS) and C++ Server (KCS) processes are responsible for hosting application elements, depending on the language in which the element is written. The Java Server hosts application components written in Java, and the C++ Server hosts components written in C++.

You can chart the following attributes of the Java and C++ Server processes:

C++/Java Server Process Attribute
Description
Average request time
Average amount of time for the Executive Server process to reply to a request.
Requests/interval
Number of new requests received since within the interval.
Total requests
Total number of requests the process has received.
Active data connections
Number of currently active data connections.
Cached data connections
Number of currently cached data connections.
Queries/interval
Number of queries executed within the interval.
Trans committed/interval
Number of transactions committed within the interval.
Trans rolledback/interval
Number of transactions rolled back within the interval.
Threads
Number of threads being used by the process.
Bytes sent/interval
Number of new bytes sent since the last polling.
Bytes received/interval
Number of new bytes received since the last polling.
Session count
Number of existing sessions for a given application.

For each process, you can chart one or more attributes. You can also simultaneously chart the attributes of several application servers, if you have a multiple-server enterprise.

To monitor process attributes, perform the following steps:

  1. On the NAS Administrator toolbar, click the Monitor tab to open the Monitor window.
  2. In the left pane of the Monitor window, double-click the process whose attribute you want to chart.
  3. In the right pane of the monitoring window in NAS Administrator, click the Add Plot button located at the bottom of the window.
  4. In the Attribute column, select the attribute to chart from the Attribute drop-down list.
  5. From the Scale drop-down box, choose the scale at which to plot the attribute from the Scale drop-down list.
  6. From the Color drop-down box, choose a color to represent the process attribute on the chart from the Color drop-down list.
  7. Repeat steps 2 through 6 for each process or attribute you want to chart.
Logging Process Data to a File Once you begin monitoring a process attribute, you can send data collected by the monitoring service to a file.

To log process data to a file, perform the following steps:

  1. On the NAS Administrator toolbar, click the Monitor tab to open the Monitor window.
  2. Click the process whose data you want to log as shown in the following figure:
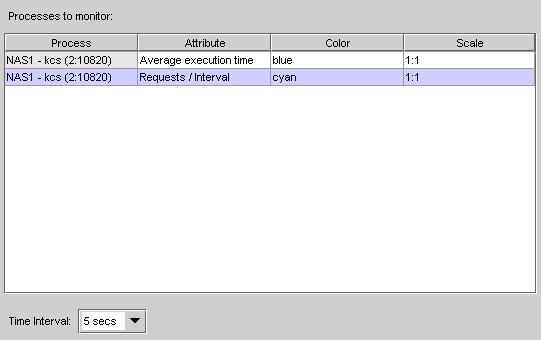
  3. Click the Options button at the bottom of the window.
  4. Click the Log to File checkbox to enable the logging service.
  5. In the File Name text field, enter the name of the file where data is sent.
  6. Click OK.
Changing a Process Data Plot Once a process data plot is added to the Monitor window chart, you can adjust the plot using the Attribute, Color, and Scale drop-down boxes corresponding to each plot to adjust the plot.

To change the attribute of a plot, perform the following steps:

  1. On the NAS Administrator toolbar, click the Monitor button to open the Monitor window.
  2. Select the process you want to change.

  3. In the right pane of the Monitoring window, from the Attribute column, select the new attribute to chart.
  4. To change the color or scale of the plot, repeat steps 2 and 3 using the Color and Scale drop-down boxes.
  5. To change the interval at which the plot is updated, select a new time from the Interval drop-down box.
Removing a Process Data Plot Remove a process plot if you no longer want to chart the process attribute.

To remove a process plot, perform the following steps:

  1. Click the Monitor button on the NAS Administrator toolbar to open the Monitor window.
  2. Select the process you want to remove.
  3. Click Remove Plot.

Receiving Event Notification
Event notification is useful when you cannot actively monitor a Netscape Application Server (NAS) machine. This passive monitoring system is activated only in critical circumstances, such as when a process has failed.

You can set the system to alert one or more concerned parties via email when a critical situation arises by supplying the email address(es) of those you want to alert. In addition, you can specify a script that will run automatically when certain events occur.

About Events You can specify an individual to notify or a script to run for the following critical events:

What Do I Do When a Server Goes Down?
If one or more of the Executive Server, Java Server, or C++ Server processes go down, the Administrative Server attempts to restart each process. If the process cannot be restarted by the Administrative Server process, the application stops running and can result in lost transactions.

Recurring failures are usually attributed to problems within the application code, but other failures can also happen. Regardless of what causes a process to fail, it is useful to be notified immediately.

If the process restarts, investigate the cause of the failure to determine whether adjustments can be made to prevent future failures. If the process does not restart, look at the log to find the cause of the failure.

What Do I Do When Restarts Are Exceeded?
In addition to process failure events, you can also be notified when the Administrative Server has exceeded the number of times it has attempted to restart a process.

Increase the Administrative Server restart option, if it is low, and determine the source of the process failure.

Configuring Email Notification for an Event To send an email notification for an event, perform the following steps:

  1. On the NAS Administrator toolbar, click the Events button to open the Events window.
  2. From the left pane of the Events window, select the server for which you want to configure events.
  3. From the right pane of the Events window, select the event or events for which you want to be notified by clicking the corresponding checkbox as shown in the following figure:
  4. In the Email Addresses field, specify the email address or addresses of the persons you want to receive notification. Use the following format:
  5. In the Mail Server field, specify the mail server through which the notification is sent. Use the following format:
  6. To see the most recent events that might have been sent out for this server, click Poll for Events.
  7. Click Apply Changes to save your changes to your application server.
Specifying an Event-Invoked Script You can configure the event notification service to run a script. The script might page the system administrator, bringing the problem to the administrator's attention, or perform any other automated task that will help keep the system running smoothly when faced with a critical event.

When a script runs, it passes an argument to indicate what type of event has occurred. For instance, the following command indicates that a Java Server (KJS) process has crashed:

/script location/ crash kjs 
To configure the event notification service to run a script in response to an event, perform the following steps:

  1. On the NAS Administrator toolbar, click the Events button to open the Events window.
  2. From the left pane of the Events window, select the server for which you want to configure events.
  3. In the right pane of the Events window, select the event or events for which you want to enable a script by clicking the corresponding checkbox.
  4. In the Script field, specify the path of the script to run. For example:
  5. Click Apply Changes to save your changes to your application server.
 

© Copyright 1999 Netscape Communications Corp.