Table of Contents
MySQL Enterprise subscription, MySQL Enterprise Monitor, MySQL Replication Monitor, and MySQL Query Analyzer are only available to commercial customers. To learn more, see: http://www.mysql.com/products/enterprise/features.html.
Once an advisor has been scheduled, it will run at set intervals. If it finds nothing of interest no alerts or emails will be created.
Events are defined using a number of different levels according to the severity of the alert. The seven levels are
Failure: Indicates a failure for the given rule or event. Usually this indicates that the rule on which the event is based has failed, probably due to a typo or other error. Occasionally it can indicate a failure to retrieve the required information for a given rule.
Critical: The event is critical and requires immediate attention. Critical events normally indicate that a serious problem has, or is about, to occur. You should examine the event and determine the cause and fix it as soon as possible.
Warning: The event is a warning of something that you should be aware of, but which is not affecting the operation of your server.
Info: The event is for informational purposes. Info events are used to indicate issues that do not affect the operation of your server, but which may highlight a minor configuration or other issue.
Success: The rule has executed successfully with no issues. This is used to indicate that the result of the rule is OK and is used to indicate when an event that was previously in a Critical or Failure state has returned to normal.
Unknown: Indicates when the current state of the event/rule is currently unknown. This state can be issued when the current status of the event cannot be determined.
Closed: The issue has been corrected and marked closed.
For convenience, the event states are also represented by icons, as defined in the table below. The table also shows the relative level of the alert from the highest (Critical) to the lowest (unknown). The order represented here is used when identifying when an event has transitioned between levels (for example, from Success to Critical), hence triggering a notification, and when sorting events based on their current state.
| Icon | Description |
|---|---|
| An octagonal red icon indicates a critical alert. | |
| A triangular yellow icon a warning. | |
| A conversation bubble an informational alert. | |
| A green tick beside an event indicates that the rule has run successfully and no alert created. | |
| A question mark icon indicates that the status of the rule is unknown. |
When alerts are triggered, they appear on the
Events screen. Alerts also appear on the
Monitor screen in order of severity. The
notification group or groups associated with a specific rule receive
email notification when an alert is triggered. For more information
about creating notification groups see
Section 5.5, “Manage Notification Groups”.
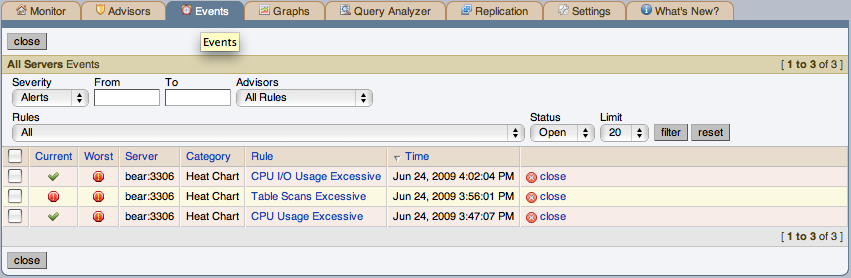
To view open events, click the Events tab. The tree-view on the left determines which server or server group these events belong to. Open events are shown in tabular format.
The event table has the following columns:
Current: An icon indicating the current severity of the alert
Worst: An icon indicating the worst severity recorded for this alert
Server: The name of the server the alert applies to
Advisor: The category of the advisor
Rule: A short description of the rule that has been violated
Time: The approximate time the event occurred
Status: The status of the event
Unnamed Column: Provides a link to the
Closedialog box
By default, all events are shown but the list of events can be filtered using the form displayed above the event list. The options include filtering by:
Severity
Date (using a range with From/To)
Advisor group
Specific rule
Status
Choose the options you are interested in and click the button to refresh the display. You may limit the number of items that appear on a page by choosing a different value from the Limit drop down listbox.
The drop down list box showing severity has the options:
All, Alerts,
Critical, Warning,
Info, Success, and
Unknown. Selecting the option
All shows all alerts and also those rules that
have run successfully.
A successful rule is one that has not been violated and is indicated by a green tick icon.
The Alerts shows only those rules that have been
violated.
Columns can be sorted by clicking the individual column headings. The alerts shown in Figure 7.1, “MySQL Enterprise Dashboard: Events Screen”.
The server shown in Figure 7.1, “MySQL Enterprise Dashboard: Events Screen”, is filtered
for All. Typically, when filtering by severity
you would choose Alerts and, if you see a
Critical, Warning, or
Info alert, use the All filter
to see when the rule last ran successfully. This may assist in
determining the cause of the alert.
Besides filtering for severity, you can also choose to filter for a
specific time period using the From and
To text boxes. You also have the choice of
filtering by specific rules or categories of rules. The
Status drop-down list box let's you choose
All, Open, or
Closed events. To avoid excessive scrolling, you
can also limit the number of events that show on a specific page.
For more information about an alert, click the rule name. A pop-up window will appear showing a description of the alert and the exact time of occurrence. This pop-up windows provides links to useful resources and advice for resolution. You can also view the exact expression that generated the event.
After determining what action to take, events should be closed.
To resolve an individual alert click the close
link in the Operations/Notes column. Document
the resolution using the Notes text area and
choose the button.
To close a number of alerts simultaneously, select the checkbox beside the alerts you wish to close and then click the button to the lower or upper left side of the screen.
Once an event has been closed it appears on the
Events screen showing a resolution
notes link. Click this link to review the notes. Events
that have been closed are saved in the Repository. If you wish to
view closed events filter the display by choosing
Closed from the Status
drop-down box.
If you have created notification groups and then configured individual rules to send their notification to one or more groups then the notification works as follows:
Notification of an event takes place when a rule is executed and the severity level for a given rule changes. For example, if during execution of a rule, the result of the rule goes from severity level
SuccesstoCritical, the configured notification groups will get one email with the detail of the event and current status.If the status of the event has not changed when the rule is next executed, no new email is sent.
This is true whether the rule is executed as part of it's normal schedule or execution of the rule has been explicitly requested.
SNMP notifications are sent each time a given rule is executed, irrespective of the current or returned state.