Table of Contents
MySQL Enterprise subscription, MySQL Enterprise Monitor, MySQL Replication Monitor, and MySQL Query Analyzer are only available to commercial customers. To learn more, see: http://www.mysql.com/products/enterprise/features.html.
Upon initial installation you may have configured your MySQL Enterprise credentials and also outgoing email settings. This section explores the configuration settings in more detail, and also shows how to manage servers, users, notification groups, Simple Network Management Protocol (SNMP) traps, log files, and the product information screen.
Knowledge of server management is a prerequisite for properly configuring advisors—the subject of Chapter 6, The Advisors Page.
To get to the Settings page open the Dashboard
and choose the Settings tab.
The Global Settings control the main confirguration parameters for the entire MySQL Enterprise Monitor system, including your email notifications, data purge, and Enterprise website credentials.
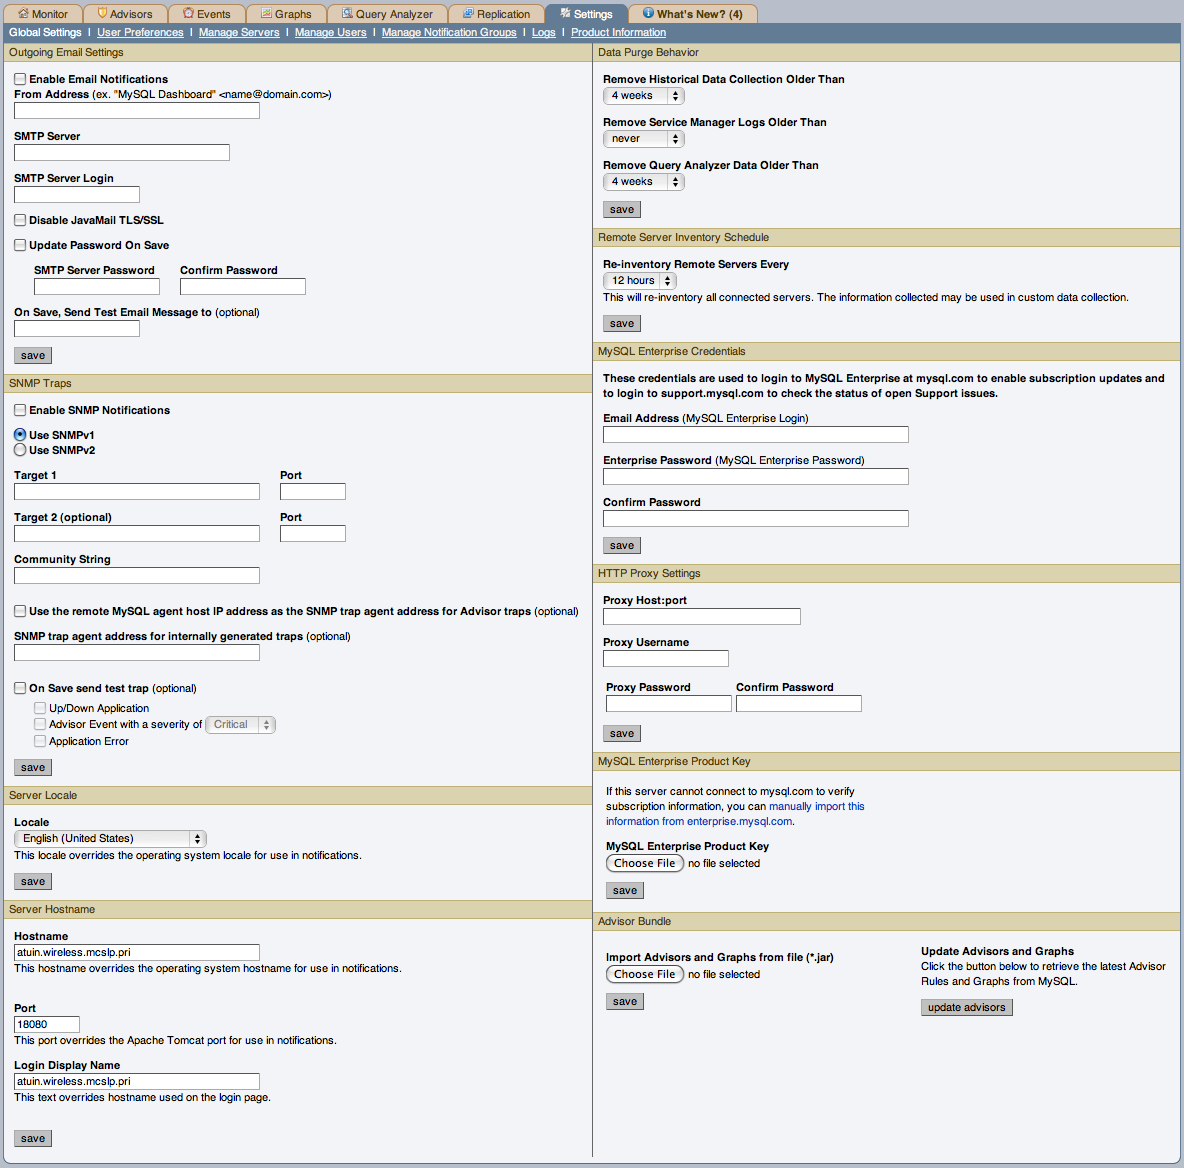
The Global Settings page is divided into a number of different sections:
Outgoing Email
          Settings
Configures the settings for email notifications by MySQL Enterprise Service Manager. You must configure the From Address SMTP Server settings. If your server requires authorization, complete the necessary server login details, and whether SSL is required.
You can test your configuration immediately by adding an email address to the On Save, Send Test Email Message to box.
For more information about
Outgoing Email Settingssee, Section 2.2.7.5, “Outgoing Email Settings”.The SNMP Traps section of the Global Settings tab allows you to enable Simple Network Management Protocol so that your Network Management System (NMS) can handle events created by the MySQL Enterprise Monitor. SNMP notifications are off by default. You can enable them by clicking the Enable SNMP Notifications checkbox.
MySQL Enterprise Service Manager includes support for both SNMPv1 and SNMPv2. You can select the SNMP version to use by clicking the corresponding Use SNMPv1 or Use SNMPv2 radio button.
In the Target 1 or Target 2 text box enter the IP address or hostnames of your NMS listeners. The port number defaults to the well-known SNMP port,
162. If you are not using this port, enter the port that your Network Management System is listening on.Enter the appropriate community string in the
Community Stringtext box. The default value for this string ispublic.For the trap address for Advisor traps, you can optionally elect to use the address of the agent that triggered the alert, rather than the address of the MySQL Enterprise Service Manager. To do this, click the Use the remote MySQL agent host IP address as the SNMP trap agent address for Advisor traps. For internally generated SNMP traps (i.e. with MySQL Enterprise Service Manager) you can also specify an alternate address by putting the IP address in the SNMP trap agent address for internally generated traps box.
To ensure that the target you have specified is valid, check the
On Save, Send Test Trapcheck box. The remaining check boxes help you to configure how your NMS responds to MySQL Enterprise Monitor. Check the Up/Down Application check box to configure NMS for starting up or shutting down the MySQL Enterprise Monitor. For configuration of advisor events choose a level of severity and check the Advisor event with the severity ofCriticalcheck box. Finally, choose the Application Error check box to configure NMS to support application error traps. Be sure to save your settings before exiting.If you wish to enable SNMP traps globally, check the
Enable SNMP Notificationscheckbox. To enable SNMP traps only for specific rules run against specific servers or server groups leave this checkbox unchecked—enabling specific SNMP traps is done as rules are scheduled. For instructions on doing this see Section 6.2, “Scheduling Rules”.The Management Information Base (MIB) file associated with SNMP trapping is called
MONITOR.MIB. For the location this file see Section C.4, “The Management Information Base (MIB) File”.NoteThe MIB file supplied with MySQL Enterprise Service Manager is not directly compatible with OpenNMS. For a sample of the modifications that need to be made, please see the comments for Bug#41714.
The
Server Localesetting determines the language of notification for the following items:Email notifications
SNMP traps
The naming conventions for shared resources such as a replication group name prefix
The initial value in this drop down list box is the locale for the OS on which the Dashboard is running.
Server Hostname
You can alter the hostname and port used to identify the MySQL Enterprise Service Manager when reporting notifications. This can be useful if the server hostname, and the hostname you want to use when connecting to your MySQL Enterprise Service Manager
NoteOnly change the Port setting if you have altered or redirected the original port used when installing MySQL Enterprise Service Manager. Entering the incorrect information will not affect the accessibility of your system, except when clicking links within the notification messages.
You can also alter the name for the server displayed in the login page by changing the value in the Login Display Name. You may want to use this to display an organizational or divisional title, rather than the hostname, of the MySQL Enterprise Service Manager.
The
Data Purge Behaviorsection of theGlobal Preferencespage lets you remove old log files and also old data from the repository. The default purge interval is28 days. If you wish to purge data, change this setting by choosing from the drop-down list. Choosing52 weeks, for example, will remove all data that is older than a year.WarningPurging data will permanently remove information from the repository. Since events are derived from data contained in the repository, they will be purged along with the data.
Ensure that there is adequate disk space for the repository. If you are monitoring numerous servers and running many rules the size of the repository can increase rapidly. Choose purge behavior accordingly.
The default value for purging,
never, is the safest option. However, please choose a purge setting that makes sense for your environment.NoteThe purge process is started approximately once every minute. If you change the purge duration from a larger timespan to a smaller one, the data may start to be purged immediately.
You can configure the data purge behavior for a number of different systems individually:
Remove Historical Data Collection Older Than configures the duration that the main data about your servers is retained. This includes all data collections, including CPU, memory and connections and activity statistics.
Remove Service Manager Logs Older Than configures the duration that the main MySQL Enterprise Service Manager logs are retained.
Remove Query Analyzer Data Older Than configures the duration that the query analyzer statistics and information about individual queries is retained.
Notes for setting purge behavior:
Purging can be carried out manually by enabling the
innodb_file_per_tablefor the repository database and then using anOPTIMIZE TABLEoperation to reclaim space from deleted rows in the table.If you set the purge value to a very low timespan value when the previous setting was quite high then the space used for the data that was purged will not be reclaimed from the InnoDB tablespaces. You can do this by running
OPTIMIZE TABLEon the MySQL tables for MySQL Enterprise Service Manager to reclaim the space from the purged rows.You cannot set the Query Analyzer purge period to a value greater than historical data collection purge period. If you attempt to do so you will get a warning:
An
              invalid Query Analyzer data life span was given. Value may
              not be larger than data life span.
.
Remote Server Inventory Schedule
MySQL Enterprise Monitor keeps track of all the databases and tables in a server, as well as the amount of RAM, disk space, and other items. A re-inventory updates this information in case you have added or dropped databases and tables. Depending upon the configuration of your system, this operation can tax resources. If you are monitoring many remote servers this is an operation you may want to perform in off-peak hours only.
MySQL Enterprise
            Credentials
You can specify the credentials for logging into the MySQL Enterprise Website. These should match the user name and password that you have registered with MySQL for your enterprise subscription.
NoteOnly administrators can change the
MySQL Enterprise Credentialssection or enter a product key; for other users, this section does not show up in the interface. For more information about different users and their rights see Section 5.4, “Managing Users”. Specifying incorrect credentials results in the error message, “Your credentials do not appear to be valid.”HTTP Proxy Settings
You may want to update your HTTP Proxy Settings if your MySQL Enterprise Service Manager is not directly connected to the internet. The proxy settings will be used when updating the information within the What's New page and when accessing the MySQL Enterprise Website for authentication of your license and product key information. For more information, see Chapter 4, The What's New Page.
MySQL Enterprise Product
          Key
You may update your
MySQL Enterprise Product Key. If you do not have access to the Internet from the Dashboard, this provides an alternate way to update or activate the MySQL Enterprise Monitor.To enter your product key first download it from the MySQL Enterprise website. Copy the key to a location accessible from the Dashboard. Use the button to locate the key and then press the button.
If you wish to switch from using your MySQL Enterprise credentials to using a product key to update MySQL Enterprise Monitor, you must first clear your credentials. Do this by removing the email address from the MySQL Enterprise Credentials section and then clicking the button. You may then enter and save your MySQL Enterprise product key.
NoteOnly administrators can change the
MySQL Enterprise
            Credentials
section or enter a product key; for other users, this section does not show up in the interface. For more information about different users and their rights see Section 5.4, “Managing Users”. Specifying incorrect credentials results in the error message, “Your credentials do not appear to be valid.”Advisor Bundle
You can update your Advisor Bundle and the associated rules and graphs by importing a new Advisor Bundle. To update your Advisor Bundle using a bundle file that you have previous downloaded:
Click and locate your Advisor Bundle on your computer.
Click to upload the updated bundle and validate the contents.
To update the Advisor Bundle automatically from the MySQL Enterprise Website using your existing MySQL Enterprise Credentials, click the button.
On this page users can change their passwords, user names, and locale information.
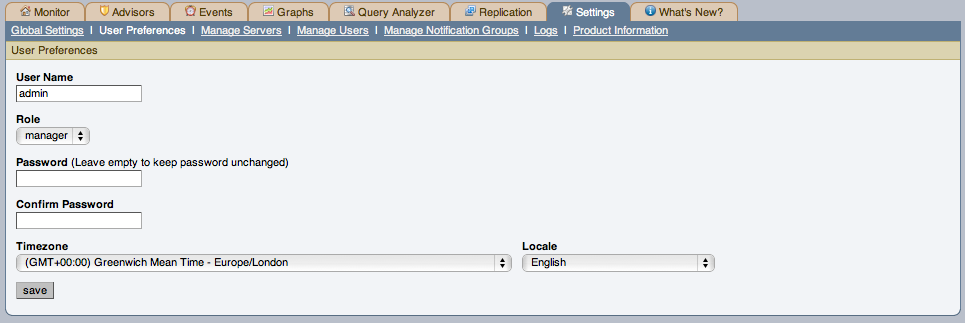
Change your password by entering a new value into the Password text box. To change your user name enter a new value into the Username text box. Click the button to commit this change.
You may also adjust your time zone and locale information from this page. The settings on this page apply only to the user who is currently logged in.
The MySQL Enterprise Service Manager determines the default value for the locale by looking at your browser settings. Changing this value, determines the language setting for any future logins to the Dashboard, overriding your browser settings.
Be sure to set the correct time zone so that alerts are time stamped correctly.
This setting applies only to the specific user.
To help with server management, the Service Manager supports the logical grouping of MySQL servers. This allows you to group servers in any fashion you choose. For example, you can manage servers according to purpose. You can group servers by whether the servers handle Internet or intranet data, by whether they power finance or HR applications, or, if you prefer, you may organize them by physical location rather than by functionality.
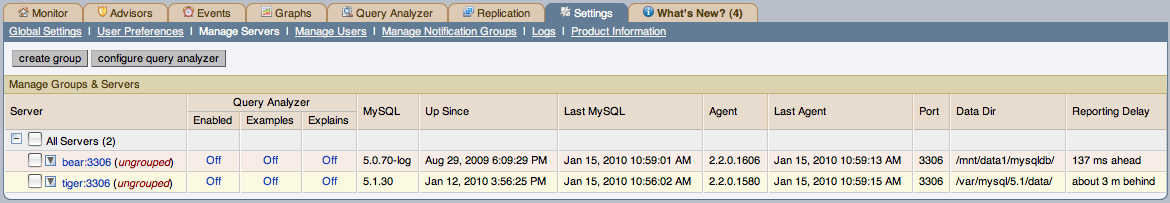
For a server to appear in the Dashboard there must be an agent monitoring it. If you wish to add a server to the Dashboard follow the procedure for installing an agent found at Section 2.3, “Monitor Agent Installation”. Instructions for adding a remote server are found at Section 2.3.6.4, “Configuring an Agent to Monitor a Remote MySQL Server”.
The Manage Servers panel also allows you control the Query Analyzer and Data Migration. For more information, see Section 9.7, “Query Analyzer Settings” and Section F.9, “Migrating 1.3.x Historical Data to MySQL Enterprise Monitor 2.0”.
The All Servers group is built in and every monitored server is a member of this group.
You can rename an existing server without losing the current historical data or configuration information. Renaming the server also allows you to modify the name of the server to be more descriptive according to the server's role within your organization. For example, you may want to rename a server from the default host name to include the department and application for the MySQL server.
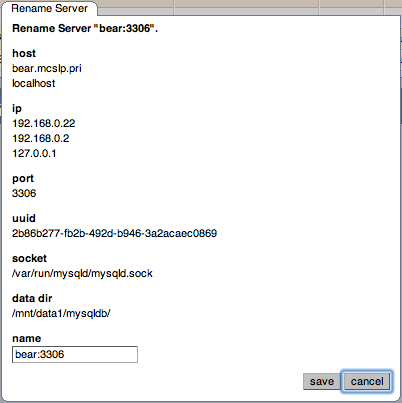
Renaming a server using the Manage Servers tab overrides all other settings, including changes made within the agent configuration.
All monitored servers are automatically included in the top level server grouping, All Servers. Other server groupings are replication groups or user-defined groups.
You can create a user-defined group by clicking the Manage Servers link. Add a group name and then click the button. The new group will be displayed immediately.
Replication groups are automatically discovered by MySQL Enterprise Monitor and in this respect differ from user-defined groups. For more information about replication groups see Chapter 10, The Replication Page. However, like user-defined groups you can edit the name of a replication group and add other servers to it.
To add to a group, select the add to group
link. Choose the server or servers you wish to add and then
complete the operation by choosing the button. You can add a server to a group even
if the agent is down.
To remove a server from a group expand the server group tree and
click the remove from group link. To delete a
server altogether see
Section 5.3.3, “Removing a Server From the Dashboard”.
Slaves removed from a replication group will be rediscovered and re-added to that group.
To delete an group, you can use the Delete Group link. This will delete the group and remove the servers from being part of the deleted group.
You cannot delete automatically created groups, such as those built during replication discovery, unless the group is empty. If the group is not empty, you will get a error.
There are three ways to modify an existing group; by renaming
it, adding to it, or removing it. Select the
rename link to change the name of a group and
add to group to add servers. Deleting a group
simply requires clicking the remove all from
group link. This removes the server group but has no
effect on individual servers.
If you no longer wish to monitor a MySQL server you can remove it from the Dashboard. There is no provision for deleting an active server from the Dashboard—to remove a server you must make it inactive by stopping the agent.
For instructions on stopping an agent see:
Once the agent is stopped you may delete the monitored server. Deleting a server simply means that it will no longer show up in the Dashboard.
Remove a server by choosing the tab and then the Manage Servers link. Find the server you wish to remove and delete it by clicking the link within the pop-up menu. Deleting a server from the All Servers group or from any other group will remove it from the Dashboard entirely.
A link will not be available for an active server. You must stop the agent before this link will appear.
You may remove a server from any group at any time. Removing the last server from a group also removes that group.
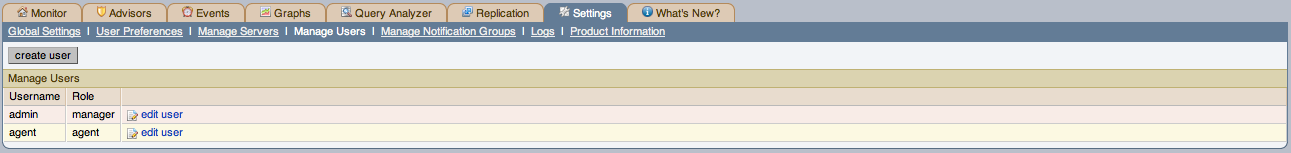
The Manage Servers panel allows to create, delete and manage individual users that have access to MySQL Enterprise Service Manager
To log in to the Dashboard a user account is required. There are
three types of users with varying privileges; Administrators,
Database Administrators, and Agents. The
Administrator can create additional users and
differs from a DBA in this respect. For this
reason the Manage Users does not display if a
DBA user logs in. Additionally, only administrators can change the
MySQL Enterprise Credentials section or enter a product key on the
Global Settings page. These sections do not
appear when DBA users log in. For more information on this subject
see Section 5.1, “Global Settings”. The
Agent account simply allows the MySQL Enterprise Monitor Agent
to communicate with the Dashboard. There is no need for more than
one agent account but defining an account for each server that is
monitored can be an advantage since this minimizes exposure should
any one agent be compromised. You cannot log in to the Dashboard
using the agent's credentials.
When the Dashboard is first launched there are two default users,
Administrator and Agent,
both created during installation. Their default user names are
respectively, admin and
agent. The Administrator defined during
installation as having the root role is unique; this user cannot
be deleted.
If you are logged in as an Administrator, you
can add a new user by choosing the Manage Users
link from the Settings page. To create a user
click the button, select a role
for the user, and enter a user name and password.
When a new user first logs in, a dialog box opens requesting time
zone and locale information. This information may be changed later
from the User Preferences page. For more
information, see Section 5.2, “User Preferences”.
If you installed the Advisors through the Dashboard you should have already configured the settings for the root role user. (See Section 5.1, “Global Settings” and following for more information about this topic.)
To receive MySQL Enterprise and Advisor updates configure the MySQL Enterprise settings for at least one user. The MySQL Enterprise settings were set up on the first login to the Dashboard. For information on changing these settings see, Section 5.1, “Global Settings”.
To edit an existing user's information, select the Manage
Users link, then select the user you wish to edit. Make
your desired changes in the fields provided and then save your
changes.
To delete an existing user, merely select the
delete link.
The Manage Notification Groups panels allows you to create and manage the notification groups used when different notifications and warnings are distributed.
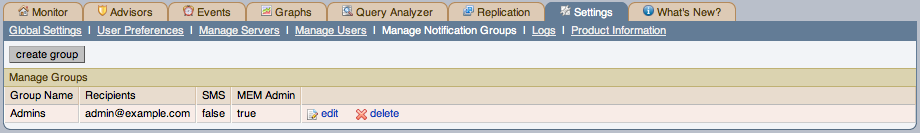
Notification groups are collections of users who should be notified when advisor alerts occur. These users may have login credentials for the Dashboard but this is not a requirement.
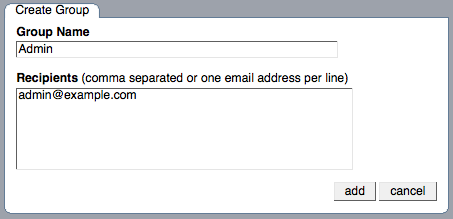
You can create a group by clicking the create
group link. Specify a group name and add recipients.
When adding a user an email address must be specified. If you are
adding multiple users separate them with commas.
To modify an existing notification group, select the
edit link next to the group name. Deleting a
group simply requires clicking the delete link.
If a rule triggers an alarm, an email will be sent to the members of the notification group specified when the rule was scheduled. For more information about scheduling rules see Section 6.2, “Scheduling Rules”.
To use this group for notification using the SMS interface, select the checkbox next to SMS. This will force the messages to be encoded suitable for sending using SMS. Messages will be sent using the configured SMS service.
You can also optionally select a notification group to be used when sending critical error messages (such as MySQL Enterprise Monitor Agent or MySQL Enterprise Service Manager failures) by selecting the checkbox next to MEM Admin.
You should ensure that there is a mail server available for sending out alerts and that there is an account configured for receiving any alerts that are created. For SMS messages, you must ensure that you have configured your SMS service settings.
Use the Logs link to inspect the various log
files associated with the MySQL Enterprise Service Manager. The following image is
an example of this screen.
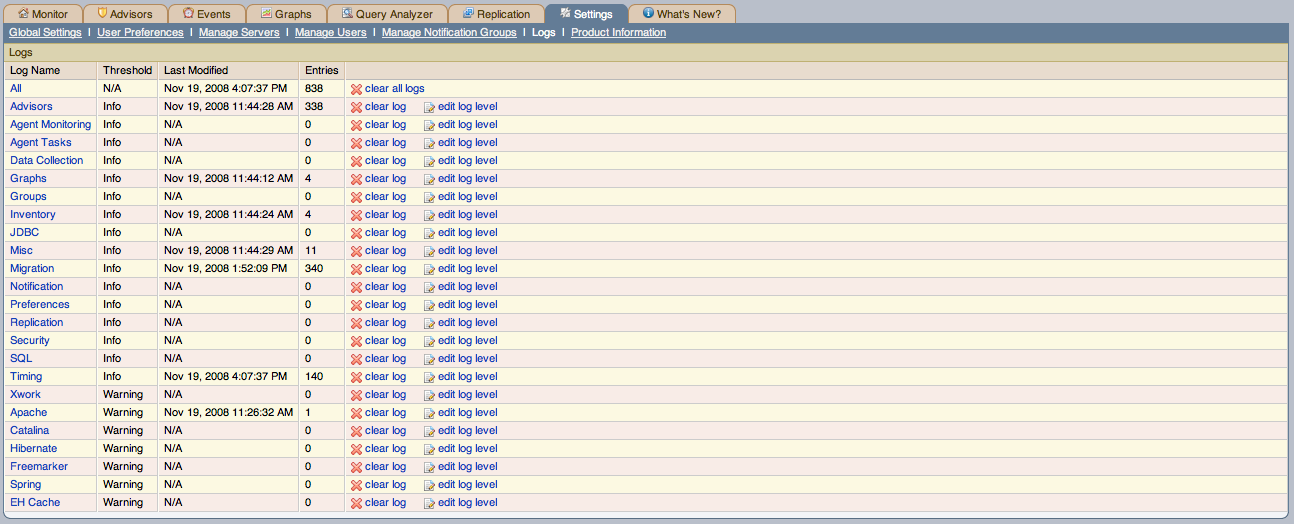
The various categories of logs are shown in alphabetic order. The most recent changes to each log are shown in the Last Modified column. The number of entries in any specific log is shown under the Entries column.
To view detailed information click the Log
Name. This will open a separate browser window showing
the date, time, alert type, and accompanying message.
On this screen you can filter log information in a couple of ways; by the message type and by time period .
To filter by message type select from the options in the level drop-down box. These are, in order of decreasing severity:
All
Error
Warning
Information
Trace
Debug
You can also adjust the number of items that appear on each page.
Press the clear all logs link to remove all log
entries. To remove entries of a specific kind click the
clear logs link associated with the specific
log you would like to remove. A confirmation dialog box allows you
to back out of this operation and avoid accidentally removing log
information.
To clear log files of a specific age see the Data Purge
Behavior section of the Global
Preferences page. For more information on this topic see
Data Purge Behavior.
Use the edit log level link to change the type
of error logged. The value selected from the Edit Log
Level dialog box determines what appears under the
Threshold column (second from the left in
Data Purge Behavior).
Selecting Error from the list box will create
the least number of log entries and Debug the
most. Choosing None turns off logging
altogether.
It is also possible to download a compressed version of all the log files. For more information, see Section 5.7, “The Product Information Screen”.
Use the Product Information link to view
detailed information about your subscription level and contract
status.
Subscription Warnings
The Subscription Warnings section contains information unique to your subscription. Information provided here will relate to your subscription settings and the servers currently being monitored. For more information, see Section 5.7.1, “Subscription Warning”.
Contract Status
The Contract Status section displays the subscription level, expiration date, contract number, the number of servers supported, and your MySQL Enterprise user name. The Subscription Level section gives more detailed information, including features and any restrictions that may apply. You may update your subscription at any time by clicking the button.
Subscription Information
The Subscription Information section contains detailed information about your subscription level and the numbger of hosts currently monitored within your subscription level.
Enterprise Dashboard Server Info
The Enterprise Dashboard Server Info section provides detailed information about the running of your MySQL Enterprise Service Manager, including information about the Java environment, hostname and version information.
The section also includes detailed information about the current status of your MySQL Enterprise Service Manager, showing information on the agents, rules, and outstanding status of the various components. The information provded in this section is listed below:
Pending Heartbeats
Processed Heartbeats
Pending Jobs
Number of Agents
Monitored mysqld Instances
Build Version
Advisor Version
Number of Rules
Number of Graphs
Last Successful Email
Last Email Failure
Last Failure Message
You can monitor the status of the email messages sent by MySQL Enterprise Service Manager by looking at the values of the Last Successful Email and Last Email Failure sections. Any failure by MySQL Enterprise Service Manager to send an email will be reported, with the failure date recorded in Last Email Failure. You can examine the Last Failure Message field to determine the precise reason for the failure.
Readme
The Readme section contains a copy of the text
Readmefile provided with each release, and provides release specific information about your MySQL Enterprise Service Manager installation.Diagnostic Report
The page includes a hyperlink, Download diagnostic report. Click this link to download a compressed version of the MySQL Enterprise Service Manager log files. All the log files found on the
Logspage (for more information about logs see Section 5.6, “Logs”) are contained in this file. It also contains the Java properties file, the monitored MySQL servers property file, information about the status of the JDBC connection and Java threads, and thesubscription.xmlfile. This report is especially useful for debugging the MySQL Enterprise Service Manager and the MySQL Enterprise Monitor Agent.
The Subscriptions Warning section on the
product information page displays any warnings relative to your
subscription. For example, if your subscription has expired you
may receive a message such as the following:
Your Subscription Needs to be Updated

* Your Platinum subscription expired 3 days ago on Feb 14, 2008 11:59:59 PM.

If the subscription information on this page is not current, you can
update it by going to the Enterprise Monitor Global Settings page and
providing MySQL Enterprise credentials or by importing a new product
key that you downloaded from http://www.mysql.com/enterprise/download.php.

To update or renew your subscription, please contact your MySQL
Account Representative at sales@mysql.com or visit
http://www.mysql.com/about/contact/renew.html.  After the update or
renewal is complete you can then follow the above instructions for
updating your subscription.
Follow these instructions to update your subscription. If you see this message and your subscription has already been updated, simply click the button in the Contract Status section of this page. This should update your subscription and remove the warning.
After updating your subscription remember to also update your advisors. For instructions on doing this see Section 6.1, “Installing and Updating Advisors”.