Table of Contents
MySQL Enterprise subscription, MySQL Enterprise Monitor, MySQL Replication Monitor, and MySQL Query Analyzer are only available to commercial customers. To learn more, see: http://www.mysql.com/products/enterprise/features.html.
Navigate to the Replication page by choosing the
Replication tab. This page provides a quick
summary view of the state of your replication servers or, if you
wish, you can drill down and determine specifics about any master or
slave.
Servers, whether masters or slaves, must be monitored for them to appear on this page.
There will be no Replication page if your
subscription level does not support this feature.
The Replication page groups all master servers
with their slaves. Masters and their slaves are autodiscovered and a
grouping is created. This grouping shows up on the replication page
and also in the Heat Chart on the
Monitor page. Scans run on a five minute
interval, so depending upon the order of discovery, it can take as
long as 2 polling intervals to create a complete group.
Discovery events are logged to the Replication
log. To view this log navigate to the Settings
page and choose the Logs link. View all
replication-related events by clicking the
Replication link. This log can be a useful tool
should you need to debug the replication topology discovery process.
The agent must be installed on the same machine as the server you are monitoring for discovery to work properly. Do not use remote monitoring.
Replication groups can be managed from the Manage
Servers page in the same way as other groups. However, any
slaves removed from a server group will automatically be restored to
that group. It is also possible to add nonslaves to a replication
grouping. For more information about server groupings see
Section 5.3.2, “Grouping Servers”.
Choose a value from the refresh drop-down
list box to set the rate at which information is updated. This
refresh rate applies only to the information presented on this
page: It is independent of the rate set for the
Monitor page.
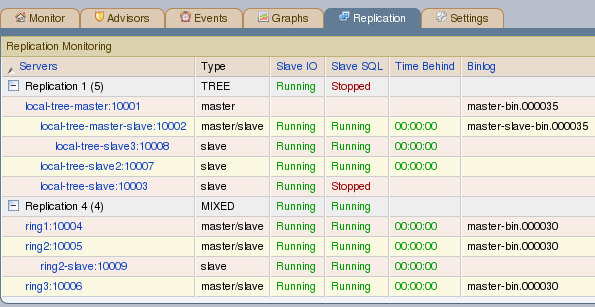
The following columns describe replication servers and their slaves:
Servers: Displays the group name and any master servers and slaves
Type: Indicates the topology of a server group or in the case of individual servers, whether a server is a master, a master/slave, or a slave
Slave IO: Reports the status of the slave I/O thread
Slave SQL: Reports the status of the slave SQL thread
Seconds Behind: The number of seconds the slave is behind the master. This column is blank if a server is a master.
Binlog: The binary log file name
Binlog Pos: The current position in the binary log file
Master Binlog: The master binary log file name
Master Binlog Pos: The current position in the master binary log file
Last Error: The most recent error
Unlabeled Column: Use the rename group link on the server group line to edit the server group name
Levels of indentation in the Servers column
show the relationship between master servers and their slaves.
Most column headings are active links that allow you to change the
order of display by clicking the header. Sorting works differently
for different column groupings. Click the Seconds
Behind header to order servers by the number of seconds
they are behind their master. However, in all cases, the server
topology is respected. For example, in a TREE
topology, ordering occurs within branches only.
If the agent is down, servers show in bold red in the
Servers column. The Slave IO
and the Slave SQL columns display
stopped in red text if these threads are not
running. If an agent is down, italics is used to display the last
know status of the I/O or SQL threads.
Clicking a master server opens a dialog box that displays information about the server. The information shown includes:
The number of slave servers
The binary log file name
The binary log position
Which databases are replicated and which not
The dialog box also includes a link that allows the user to hide or show the slave servers.
Clicking a slave server opens a dialog window showing extensive information about the slave.