Table of Contents
MySQL Enterprise subscription, MySQL Enterprise Monitor, MySQL Replication Monitor, and MySQL Query Analyzer are only available to commercial customers. To learn more, see: http://www.mysql.com/products/enterprise/features.html.
Query Analyzer enables you to monitor the statements being executed on a monitored server and retrieve information about the query, number of executions and the execution times of each query. Queries are normalized, so that the unique data defined within each query has been removed. By removing the data specific elements of the queries, the generic queries can be counted and identified more easily.
MySQL Query Analyzer is designed to gather query performance information from a variety of sources. Query Analyzer uses a new agent plug-in to proxy your queries and collect performance data that is then transmitted to the Enterprise Monitor. This is a new role for the Agent: it is no longer just monitoring, it is now optionally between your MySQL client application and the mysql server.
Depending upon your system load, it is possible to overload the
proxy or have the proxy/agent consume system resources needed by
mysql itself. In particular, the memory needed by the MySQL Agent
for basic monitoring is fairly small and consistent and depends on
the number of rules you have enabled. However, when the Query
Analyzer is enabled, the Agent can use significantly more memory to
monitor and analyze whatever queries you direct through it. In this
case, the amount of memory used depends on the number of unique
normalized queries, example queries and example
EXPLAINs being processed plus the network
bandwidth required to send this query performance data to the
Service Manager. In general, the amount of memory used for the Query
Analyzer is well-bounded, but under heavy load or, in some cases
under older versions of linux, RAM usage by Query Analyzer may be
too high for your environment and load.
Therefore we advise you to use this release of Query Analyzer extensively in development, test and stage environments under load for an extended period of time before considering usage in a production environment. For all deployments:
Carefully monitor the Agent's resource consumption using the new graph Memory Usage - Agent graphs available on the Graph tab. You can also add an SMTP or SNMP notification to the new Heat Chart rule MySQL Agent Memory Usage Excessive.
If the amount of memory consumed is too high, consider sampling queries during nonpeak hours or monitoring only a subset of queries on this system.
If you experience any problems with Query Analyzer, we're interested in working with you closely and quickly to resolve them. Please open a Support issue right away. We're already working hard on optimizing Agent/proxy RAM usage and are planning a series of rapid releases to quickly distribute these and other improvements to you.
Query Analyzer works by intercepting the SQL statements that your MySQL client application sends to the MySQL server. Instead of connecting direct to the MySQL Server, queries are routed through the MySQL Enterprise Monitor Agent, the agent/proxy forwards the queries on to the server and sends the replies back to the client application as normal. In addition to forwarding the queries, the agent/proxy will also normalize the queries and then supply the execution information about each query to the monitor. The forwarding functionality is provided by the same module that supports the MySQL Proxy application. For information on MySQL Proxy, see MySQL Proxy.
The MySQL Proxy component, and Query Analyzer, require that clients connecting through MySQL Enterprise Monitor Agent are using MySQL 5.0 or later. Clients that use the library provided with MySQL 4.1 or earlier will not work with MySQL Enterprise Monitor Agent.
Once your MySQL client application has been configured to communicate using the MySQL Enterprise Monitor Agent, queries will be monitored and the simplified queries, without the query specific data, will be sent to the MySQL Enterprise Monitor Agent.
There are a number of different ways that you can enable Query Analysis. For more information on the different options, see Section 9.1, “Enabling Query Analyzer”.
To analyse the queries captured by the agent/proxy, change to the
Query Analyzer page. You can see an example of
the table on that page in the figure below.
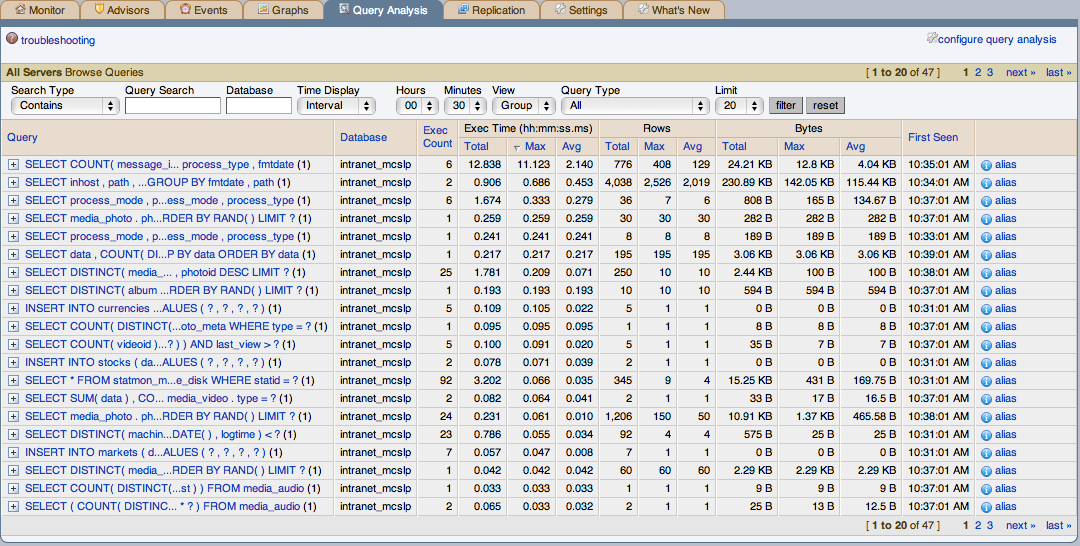
The main Query Analyzer table provides the summary information for all of the queries executed using the agent/proxy. The table will track all the queries submitted to the server using the agent/proxy. The table will show a maximum of 20 rows, and you can page through the list of queries by using the page numbers, or the next, previous, first, and last buttons. To filter the list of queries that are displayed, or to change the number of queries, see Section 9.4, “Filtering Query Analyzer Data”.
Each row within the table provides the statistical information for one normalized query statement. If you have configured multiple agent/proxies to accept and forward queries to different servers, then you can expand the server view. The summary information displayed is different depending on whether you have selected a server group or an individual server.
If you have selected a server group, then the information displayed is aggregated from across the entire group. The same query executed on multiple servers will show average, total and minimum/maximum information for that query across all the servers. If you select an individual server, then only queries executed on that server are included within the table.
For each row, the following columns are populated according to the selected filtering options. For example, if the filter have been configured to show queries within the last 30 minutes (Interval), then only queries executed during that time will be displayed, and the corresponding statistics, such as execution times, rows returned and bytes returned will be according to that 30 minute timespan.
Query: The normalized version of the query. Normalization removes the query-specific data so that different queries with different data parameters are identified as the same basic query.
The information is shown as one query per row. Each query row is expandable, and can be expanded to show the execution times for individual servers for that query.
Database: The default database in use at the time of the query. The database name may not match the database used within the query if you have have explicitly stated the database name in the query.
Exec Count: The number of times that the query has been executed.
Exec Time: The execution time for all the matching queries. This is the time, for every invocation of the corresponding query, as calculated by comparing the time when the query was submitted and when the results were returned by the server. Times are expressed in HH:MM:SS.MS (hours, minutes, seconds, and milliseconds).
The Execution column is further subdivided into the following columns:
Count: The total number of executions.
Total: The cumulative execution time for all the executions of this query.
Max: The maximum execution time for an execution of this query.
Avg: The average execution time for the execution of this query.
When looking at the information provided in this query, you should consider comparing the average and maximum execution times to see if there was a problem on a specific server or during a specific time period when the query took place, as this may indicate an issue that needs to be investigated. For more information, see Section 9.5, “Using Query Analyzer Data”.
NoteDue to limitations in the counters used for monitor queries on Windows, the time reported for short queries may be reported 0.000. This will be fixed in a future release.
Rows: The rows returned by the query. The column is sub-divided into the following columns:
Total: The sum total number of rows returned by all executions of the query.
Max: The maximum number of rows returned by a single execution of the query.
Avg: The average number of rows returned by all executions of the query.
Bytes: The number of bytes returned by each query. The column is sub-divided into the following columns:
Total: The sum total bytes returned by all executions of the query.
Max: The maximum number of bytes returned by a single execution of the query.
Avg: The average number of bytes returned by all executions of the query.
First Seen: The first time the query was seen within the given filter conditions.
You can sort the list of queries by clicking the column name. The direction of the sort (highest to lowest, or lowest to highest) is indicated by a triangle next to the currently selected column. The default is to sort the list of queries by the Total Execution time.
There are three different ways of enabling query analyzer:
Change your MySQL client application to talk to the Proxy port you configured during installation. This requires changing your MySQL client application code, and may require that you stop and restart your MySQL client application , but does not require any changes to your MySQL server. For more information, see Section 9.1.1, “Enabling Query Analyzer by Changing the MySQL Client Application”.
Change your MySQL server to listen on a different port, and configure the Agent/proxy to listen on the original MySQL server port. This does not require any changes to your MySQL client application , but will require shutting down and restarting your MySQL server, which may affect your cache and performance. For more information, see Section 9.1.2, “Enabling Query Analyzer by Changing MySQL Server”.
Use IP tables to redirect the network packets to the agent/proxy.
MySQL Query Analyzer is designed to gather query performance information from a variety of sources. Query Analyzer uses a new agent plug-in to proxy your queries and collect performance data that is then transmitted to the Enterprise Monitor. This is a new role for the Agent: it is no longer just monitoring, it is now optionally between your MySQL client application and the mysql server.
Depending upon your system load, it is possible to overload the
proxy or have the proxy/agent consume system resources needed by
mysql itself. In particular, the memory needed by the MySQL Agent
for basic monitoring is fairly small and consistent and depends on
the number of rules you have enabled. However, when the Query
Analyzer is enabled, the Agent can use significantly more memory to
monitor and analyze whatever queries you direct through it. In this
case, the amount of memory used depends on the number of unique
normalized queries, example queries and example
EXPLAINs being processed plus the network
bandwidth required to send this query performance data to the
Service Manager. In general, the amount of memory used for the Query
Analyzer is well-bounded, but under heavy load or, in some cases
under older versions of linux, RAM usage by Query Analyzer may be
too high for your environment and load.
Therefore we advise you to use this release of Query Analyzer extensively in development, test and stage environments under load for an extended period of time before considering usage in a production environment. For all deployments:
Carefully monitor the Agent's resource consumption using the new graph Memory Usage - Agent graphs available on the Graph tab. You can also add an SMTP or SNMP notification to the new Heat Chart rule MySQL Agent Memory Usage Excessive.
If the amount of memory consumed is too high, consider sampling queries during nonpeak hours or monitoring only a subset of queries on this system.
If you experience any problems with Query Analyzer, we're interested in working with you closely and quickly to resolve them. Please open a Support issue right away. We're already working hard on optimizing Agent/proxy RAM usage and are planning a series of rapid releases to quickly distribute these and other improvements to you.
Note that you must have enabled Query Analyzer within the
agent/proxy during installation. If you did not enable Query
Analyzer during the installation of the agent/proxy, check the
following elements within the main
mysql-monitor-agent.ini configuration file:
Add the
proxyplugin to thepluginsparameter:plugins=proxy,agent
Ensure that the
quan.luaitems file is enabled in theagent-item-filesconfiguration property:agent-item-files = share/mysql-proxy/items/quan.lua,share/mysql-proxy/items/items-mysql-monitor.xml
Check and set the
proxy-address,proxy-backend-addresses, andproxy-lua-scriptsettings are configured:proxy-address=:6446 proxy-backend-addresses = 127.0.0.1:3306 proxy-lua-script = share/mysql-proxy/quan.lua
For more information on these configuration options, see
Section 2.3.6.1, “MySQL Enterprise Monitor Agent (mysql-monitor-agent.ini)
Configuration”.
The Query Analyzer functionality may show as being enabled on a server, even though the modules within MySQL Enterprise Monitor Agent may not have been enabled.
You may also need to make some additional changes to the security configuration on your server to ensure that queries are correctly reported to MySQL Enterprise Service Manager:
You must ensure that each user configured within your MySQL client application that connects through the agent/proxy and is required to report query analyzer information is allowed to connect to the server from the host on which the agent/proxy is running. When the user connects to the agent/proxy, and the agent/proxy connects to the server the host of the agent/proxy will be used as the identifying client host name during the connection.
WarningBecause the proxy is providing the immediate connectivity to the MySQL server, authentication must use the proxy hostname, not the client hostname.
To update your user credentials, you need to use the
GRANTstatement. For example:mysql> GRANT SELECT,UPDATE,INSERT on database.* to 'user'@'localhost' IDENTIFIED BY 'password';
The MySQL client application user must have
SELECTprivileges on themysql.inventorytable. This table contains the server UUID and is required to report the query analyzer data to the MySQL Enterprise Service Manager. To enable this, use theGRANToption:mysql> GRANT SELECT on mysql.inventory to 'user'@'localhost' IDENTIFIED BY 'password';
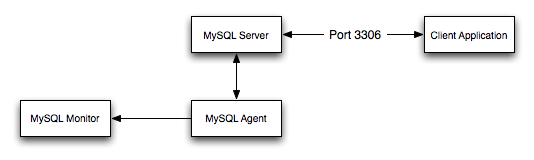
Generally, changing your MySQL client application is the easiest and recommended method. For example, given a typical structure like the one shown in the figure below, the client application would need to be modified so that it no longer communicated directly with the MySQL server, but to the agent/proxy.
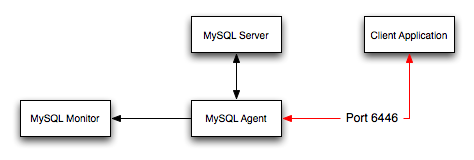
You can see an example of the structure when communicating using the agent/proxy below.
To enable query analyzer within your MySQL client application:
Make sure that the MySQL Enterprise Service Manager and your MySQL Enterprise Monitor Agent are configured and running.
Confirm the configuration of your agent by examining the contents of the
etc/mysql-monitor-agent.inifile within your installed Agent directory.Queries will be sent to the host specified in the
proxy-backend-addressesparameter, and the agent will listen for connections to be redirected to the server on the host name and port configured in theproxy-addressparameter.Now modify your MySQL client application to communicate with the address specified in the
proxy-addressparameter.Alternatively, if you do not want to modify your application directly, you can use iptables or firewall rules to redirect queries from the original host/port combination to the agent's port.
Because connections to the MySQL server will be coming from the agent/proxy, not the original host, the user credentials used must be have a suitable
GRANTstatement for connections fromlocalhost, or the host on which the agent/proxy is executing. The user name and password information will be passed on directly through the agent/proxy from the client to the server.Confirm that your MySQL client application still operates normally. There should be no difference between communicating directly with the MySQL server and communicating using the agent/proxy.
If you are using the mysql client to
connect to the agent/proxy and your backend servers, make sure
that you are communicating with the proxy over the right port.
By default, if you specify localhost as the
host name, then mysql will connect using
the local Unix domain socket, rather than the TCP/IP socket.
You can enforce mysql to use the right port
either by explicitly requesting the protocol type, or by using
the IP address rather than localhost. For
example, both of these command lines will start the client
using the right protocol:
shell> mysql --port=6446 --protocol=tcp
shell> mysql --port=6446 --host=127.0.0.1
It is recommended that you use one agent/proxy per MySQL server instance. The agent/proxy is not able to forward queries to multiple MySQL server backends.
When enabling Query Analyzer by changing the MySQL Server, you need to shutdown your server, edit the MySQL configuration file, and then restart MySQL. You will also need to change your Agent/proxy configuration so that the Agent/proxy is listening on the original MySQL TCP/IP port. To use this method:
Edit the
/etc/my.cnfor other MySQL configuration file and change or add theportsetting from it's current value (default 3306), to another value. For example:port = 3307
Shutdown your MySQL Server.
Startup your MySQL Server and confirm that is running.
Edit your MySQL Enterprise Monitor Agent configuration so that the agent/proxy is listening for connections on the original MySQL port:
proxy-address=:3306
proxy-backend-addresses = 127.0.0.1:3307
Stop and restart MySQL Enterprise Monitor Agent.
You should now be able to connect to your MySQL server through the MySQL Enterprise Monitor Agent by connecting on the original port:
shell> mysql --host=127.0.0.1
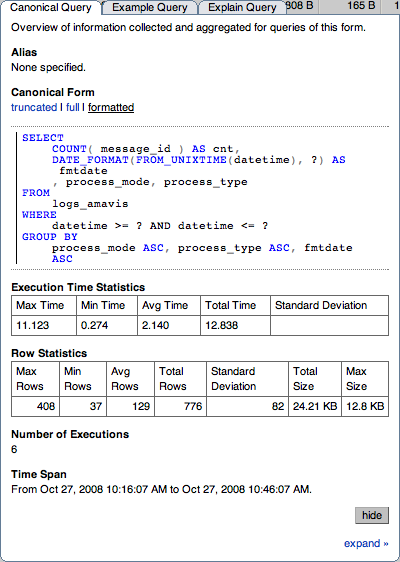
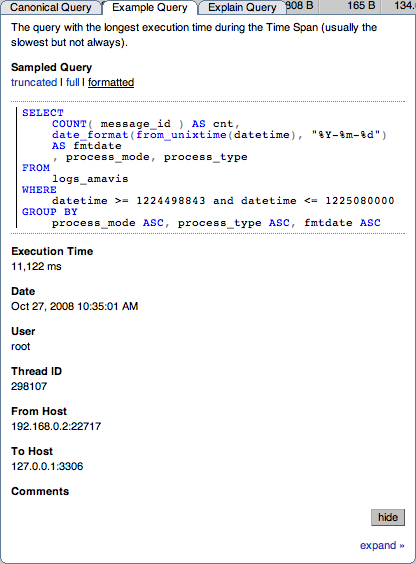
If you click an individual query, a pop-up window will provide
more detailed information about the individual query. You can see
an example of this in the figure below. The available tabs within
this window will depend on whether you have configured the more
detailed query information. By default, you will always be
provided the Summary Details page. If enabled, you may also view
Example Details, which provide more detailed data about a specific
query, including the data and parameters submitted. In addition,
you may also enable Example Explain, which provides you with the
ability to remotely execute an EXPLAIN
statement with the specified query and view the resulting
information.
The Canonical Query tab:
In addition to the summary information given in the table, you will get detailed execution statistics, including the minimum time, maximum time, average time, total time and the standard deviation. The standard deviation will enable you to determine whether a particular invocation of a query is outside the normal distribution of times for the given query.
Row statistics provide more detailed contents on the maximum, minimum, average, total, and standard deviation for the number of rows returned by the query, and the total size and maximum size of the data returned. The time period for the total and average figures is shown under the Summary Time Span.
The detailed view for a query also provides three different views of the query. The
truncatedversion is a shortened version of the query. Thefullversion of the query is the entire query statement. Normalization removes the constants from the individual queries so that queries following the same logical structure are identified as the same basic query.To close the query detail window, click the button.
To simplify the identification of a given query, you can create a query alias. The alias will be used in place of the normalized query text within the Query Analyzer table. To create an alias for a query, click the link against the query. The maximum length for a query alias is 255 characters.
The Example Query tab:
The Example Details tab provides detailed information about the most expensive query executed, as determined by the execution time.
In addition to the full query, with data, that was executed, the tab shows the execution time, data, user, thread ID, client host and execution host for the given query.
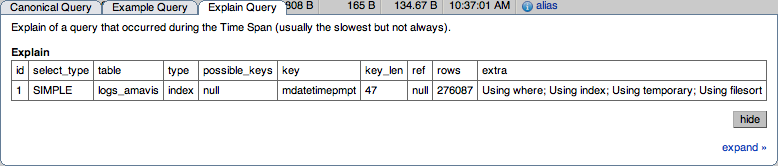
The Explain Query tab:
The Example Explain tab enables you to view the output from running the query with the
EXPLAINprefix. For more information, seeEXPLAINSyntax.
The MySQL Enterprise Dashboard supports correlated graphs so that you can compare the graphed execution parameters, such as the server load, thread statistics, or RAM usage, against the queries that were being executed by the server or servers being monitored at that time.
You can use the correlated graphs in two different ways:
By dragging and selecting an area on a graph as displayed within the Monitor over view tab, or the Graphs tab of the MySQL Enterprise Dashboard. When using either of these two tabs, you can drag and select any region on a displayed graph, and the display will change to the Query Analyzer tab, displaying the corresponding zoomed graph, and the associated queries being executed during the selected period.
You can select a graph to be displayed within the Query Analyzer tab. Open the Graph section, and use the pop-up list to select the graph to be displayed. You can see an example of this in Figure 9.7, “MySQL Enterprise Dashboard: Correlated Graphs”.
When using the correlated graphs, selecting an area within the graph will set the start and end time within the query filtering selection. You can combine with other filtering options, such as the Query Type, to zero-in on the queries that you want to examine.
To use the graphs in this manner, select a starting point and click, while holding down the button, drag a selection area to set the time-range for the query display. The time range that you have selected will be displayed above the graph as you select the area.
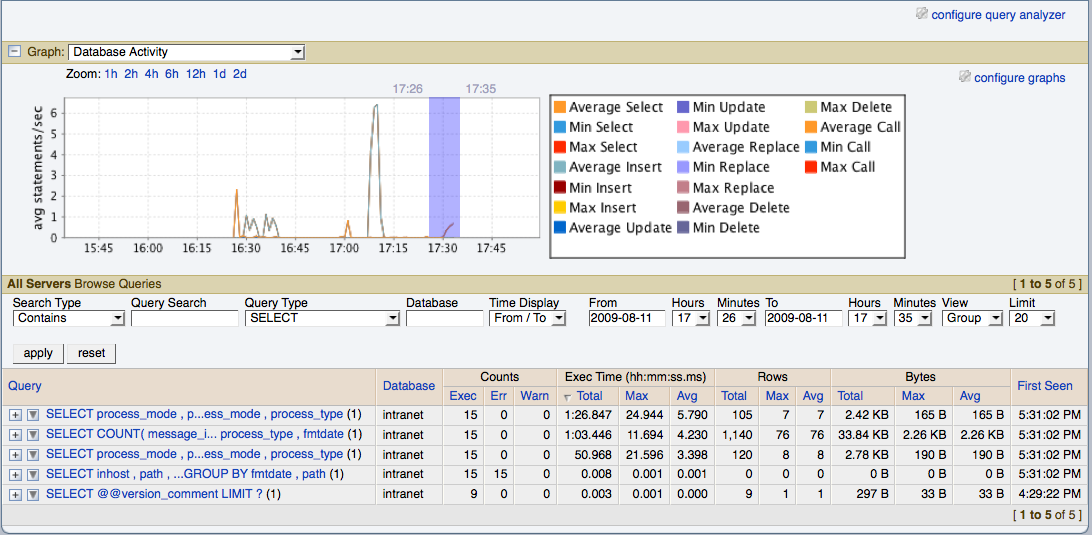
You can also explicitly zoom in an out of the displayed graph by using the links next to the Zoom label. You can select to show just an hour of the graph material, or larger ranges up to two days. At all times, the area on the graph highlighted in blue is the actual date/time range selected within the list of analyzed queries.
For more information on filtering your queries, see Section 9.4, “Filtering Query Analyzer Data”.
You can filter the queries shown within the Query Analyzer table by using the form at the top of the table. The different fields of the form are used to specify the parameters for the filter process. Once you have specified a filter, all the queries and related statistics shown within the Query Analyzer table are displayed in relation to the filter settings. For example, by default, the filter settings show the queries for the last 30 minutes. All the statistics shown are relative to the last 30 minutes, including average, maximum and execution counts.
The filter fields are:
Search Type and Query Search support text searching of the normalized query. For the search type you can specify either a basic text match, or a regular expression match. In addition to the basic text match, you can also search for a query that does not contain a particular string. For regular expression searches, you can specify whether the regular expression should match, or not match (negative regexp) the queries. Regular expressions are parsed using the standard MySQL
REGEXP()function. For more information, see Regular Expressions.NoteThe search is performed against the canonical version of the query. You cannot search against specific text or values within the parameters of the query itself.
Database: Limit the queries to those executed within a specific database. The database match is performed using the
LIKEmatch from the MySQL database, hence you can use the%and_characters to multiple and single character matches. For more information, see Pattern Matching.The Time Display menu selects whether the time selection for filtering should be based on the time interval (only queries recorded within the displayed time period are shown, using the Hours and Minutes pop-up), or whether the selection should be based on a time period (From/To), where you can select the time range to be displayed.
Using the Interval mode shows queries within the given time period from the point the graph was updated. For example, if you select 30 minutes, then the queries shown were captured within the last 30 minutes. If you updated the display at 14:00, then the queries displayed would have been captured between 13:30 and 14:00. Using interval mode limits the timespan for the filter selection to a maximum of 23 hours and 59 minutes.
Using the From/To mode enables you to show queries between specific dates and times. Using this mode you can show only the queries received during a specific time span, and you can display the query history for a much longer time period, for as long as you have been recording query analysis information.
The View selection determines whether the information should be returned on a group basis, where an aggregate of the same query executed on all monitored servers is shown, or on a Server basis, where queries are summarized by individual server. If the latter option has been selected, the table includes an additional column showing the server.
Query Type lets you select the type of query on which to filter queries. Selecting All will show all queries. Additional query types you can select include
SELECT,INSERT,UPDATEand other main SQL query types.Limit specifies the number of queries to be displayed within each page.
When you have set your filter parameters, you can update the Query Analysis display by clicking the button. To reset the fields to the default settings click the button.
The information provided by Query Analyzer can be complex to understand and resolve into simple targets and resolutions for your MySQL client application. The information can be used in different ways to find problems in your queries or your servers, or both. Provided below are some tips on how to get the best out of the Query Analyzer interface, and how to identify different queries and problems based on the information shown by the Query Analyzer system.
First, consider the information provided by individual columns by your queries. In particular, the following columns can highlight specific problems with your queries or database server:
Execution Count: High execution counts, especially for a query that you expect to be executed very rarely, may indicate that your MySQL client application is either running a simple query to frequently, or may be running a query multiple times that could otherwise be cached. You should pay particular attention to queries where the execution count increases significantly in a short period of time compared to the normal execution rate.
How to find: Use the sort feature to sort the queries by execution count.
New queries: New queries appearing in the Query Analyzer tab, especially if they appear after other queries have been in the display for a number of hours or days may indicate a number of issues:
Execution times: Long execution times, and a long max execution time compared to the average execution time may indicate a problem with a specific query and specific parameters.
How to find: Use the sort feature to sort the queries by execution count.
You can also use the filtering and sort options to get specific information about potential problem queries.
If you are having trouble with Query Analyzer, either because the information is not being shown or the full range of queries that you expect are not appearing in the Query Analyzer page then there are a number of systems you can check.
To confirm that your system is correctly configured for Query Analysis, check the following:
Confirm that the agent is running by checking the Agent log and the status of the server within MySQL Enterprise Service Manager
Check the configuration of the agent. You must confirm the following:
The
pluginsparameter within the main configuration file,mysql-monitor-agent.ini, must contain theproxyplugin:plugins=proxy,agent
The
agent-item-filesparameter within the main configurationfile,mysql-monitor-agent.ini, must specify theshare/mysql-proxy/items/quan.luascript:agent-item-files = share/mysql-proxy/items/quan.lua, » share/mysql-proxy/items/items-mysql-monitor.xmlThe proxy configuration parameters must point to the MySQL server where you want your queries to be sent. For example, if you are running your agent on the same host as your MySQL server then you might have the following lines in your
mysql-monitor-agent.inifile:proxy-address=:6446 proxy-backend-addresses = 127.0.0.1:3306 proxy-lua-script = share/mysql-proxy/quan.lua
The above configuration can means:
The agent/proxy will listen on the current machine, using port 6446 (
proxy-address).The agent/proxy will send all queries received on to the host
127.0.0.1on port3306(the standard MySQL port), as per theproxy-backend-addressesparameter.
You can see a sample complete configuration file (
mysql-monitor-agent.ini), using the127.0.0.1as the MySQL backend server, and reporting to a MySQL Enterprise Service Manager calledmonitor:[mysql-proxy] plugins=proxy,agent agent-mgmt-hostname = http://agent:password@monitor:18080/heartbeat mysqld-instance-dir= etc/instances agent-item-files = share/mysql-proxy/items/quan.lua,share/mysql-proxy/items/items-mysql-monitor.xml proxy-address=:6446 proxy-backend-addresses = 127.0.0.1:3306 proxy-lua-script = share/mysql-proxy/quan.lua agent-uuid = a3113263-4993-4890-8235-cadef9617c4b log-file = mysql-monitor-agent.log pid-file=/opt/mysql/enterprise/agent/mysql-monitor-agent.pid
Confirm that you can connect through the agent proxy to your backend MySQL server. You can do this by checking with the MySQL client. You must specify the same options as you would if you were connecting to the original server, including specifying the same user and password information:
Check that your MySQL client application is configured to use the configured proxy port, instead of the real MySQL port when sending queries.
Confirm that Query Analyzer enabled for your host. For more information, see Section 9.7, “Query Analyzer Settings”.
There are a number of settings related to the Query Analyzer data. You can configure the query analyzer operation by using the configure query analyzer link within the Query Analyzer tab, or through the button within the Manage Servers tab within the Settings tab. Both methods provide you with the same dialog:
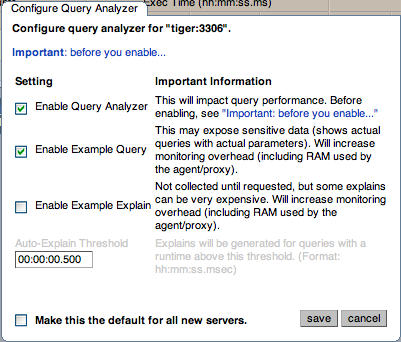
Through either solution, the configuration options that you select are applied to the individual server or server group selected within the Serversnavigation panel.
There are three configuration options available through either method:
Enable Query Analyzer configures whether query analyzer should be enabled for this server or server group. If selected, query analyzer will be enabled. To disable, delect the check box.
If Query Analyzer has been enabled, then you can additional configure the Example Query function by selecting the Enable Example Query checkbox. Enabling this option provides an additional tab when you open the Canonical Query window when clicking a query.
Enable Example Query allows the Query Analyzer to display more information about individual queries. When enabled, queries and their data items (rather than the canonical form shown by default) will be provided. Enabling this option may expose the full query statements and therefore may present a security issue.
With the Example Query option enabled, an additional tab within the query summary details is made available. For more information, see Section 9.2, “Getting Detailed Query Information”.
If you have enabled Example Query, then you can additional enable Example Explain, To enable this tab, select the Enable Example Explain checkbox.
Enable Example Explain provides another tab when viewing a query where you can view the output from
EXPLAINoutput from MySQL for the selected query. This will show the full query and how the query was executed within the servers.When the
EXPLAINfunctionality has been enabled, the Auto-Explain Threshold controls when theEXPLAINoutput for a query is triggered. Queries that take longer than the Auto-Explain Threshold will have theEXPLAINoutput generated and stored in the database to be display in the Example Explain tab.Enabling this option may add overhead to the execution of your server, as the server will run an
EXPLAINstatement each time it identifies a long running query. For more information, Appendix B, MySQL Enterprise Monitor Frequently Asked Questions.
To enable or disable query analyzer for an individual server, go to the Settings page and click the link. To configure all the properties, click the configure query analyzer link next to server you want modify.
Alternatively, for each server, the Query Analyzer column shows the current setting, On or Off, and whether the Example and Explain functionality is enabled. To change any setting, click the current status to toggle between the On/Off position.
To disable or enable Query Analyzer for the selected servers, use
the or
enable query analyzer buttons within the
Settings page. You must have selected one or
more servers from the list of available servers before selecting
these buttons.
You can use the options that you have just selected as the default for all new servers that register with MySQL Enterprise Service Manager by using select the Make this the default for all new servers checkbox. By default, when a new server registers with MySQL Monitor, the server is automatically configured to supply Query Analyzer data. This can have impact on the performance of your monitor and agent as it increases the amount of information supplied to the MySQL Monitor.
Configuration of Query Analyzer occurs through the button from within the Query Analyzer page.