Table of Contents
MySQL Enterprise Monitor is an enterprise monitoring system for MySQL that keeps an eye on your MySQL servers, notifies you of potential issues and problems, and advises you how to fix the issues. MySQL Enterprise Monitor can monitor all kinds of configurations, from a single MySQL server that is important to your business, all the way up to a huge farm of MySQL servers powering a busy web site.
This section describes the basic components that make up the MySQL Enterprise Monitor product. These components can be installed in various configurations depending on your own database and network topology, to give you the best combination of reliable and responsive monitoring data, with minimal overhead on the database server machines. A typical MySQL Enterprise Monitor installation consists of:
One or more MySQL servers that you want to monitor. MySQL Enterprise Monitor can monitor both Community and Enterprise MySQL server releases.
A MySQL Enterprise Agent for each monitored MySQL server.
A single MySQL Enterprise Service Manager, which collates information from the agents, and provides the user interface to the collected data.
The structure of a typical MySQL Enterprise Monitor installation is shown in the figure below.
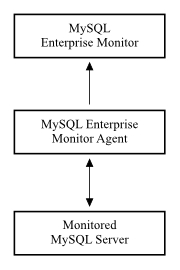
MySQL Enterprise Monitor is designed to monitor one or more MySQL servers. The monitoring information is collected by using an agent, MySQL Enterprise Agent. The agent communicates with the MySQL server that it monitors, collecting variables, status and health information, and sending this information to the MySQL Enterprise Service Manager. If you have multiple MySQL servers, then you have multiple MySQL Enterprise Agent processes monitoring each MySQL server. The MySQL Enterprise Agent has other responsibilities and capabilities, which we describe in more detail later in this chapter.
The information collected by the agent about each MySQL server you are monitoring is sent to the MySQL Enterprise Service Manager. This server collates all of the information from the agents. As it collates the information sent by the agents, the MySQL Enterprise Service Manager continually tests the collected data, comparing the status of the server to reasonable values. When thresholds are reached, the server can trigger an event (including an alarm and notification) to highlight a potential issue, such as low memory, high CPU usage, or more complex conditions such insufficient buffer sizes and status information. We call each test, with its associated threshold value, a rule.
These rules, and the alarms and notifications, are each known as a MySQL Enterprise Advisor. Advisors form a critical part of the MySQL Enterprise Service Manager, as they provide warning information and troubleshooting advice about potential problems.
The MySQL Enterprise Service Manager includes a web server, and you interact with it through any web browser. This interface, the MySQL Enterprise Dashboard, displays all of the information collected by the agents, and lets you view all of your servers and their current status as a group or individually. You control and configure all aspects of the service using the MySQL Enterprise Dashboard.
The information supplied by the MySQL Enterprise Agent processes also includes statistical and query information, which you can view in the form of graphs. For example, you can view aspects such as server load, query numbers, or index usage information as a graph over time. The graph lets you pinpoint problems or potential issues on your server, and can help diagnose the impact from database or external problems (such as external system or network failure) by examining the data from a specific time interval.
You can configure the MySQL Enterprise Agent to collect detailed information about the queries executed on your server, including the row counts and performance times for executing each query. You can correlate the detailed query data with the graphical information to identify which queries were executing when you experienced a particularly high load, index or other issue. The query data is supported by a system called Query Analyzer, and the data can be presented in different ways depending on your needs.
The MySQL Enterprise Service Manager is the hub of MySQL Enterprise Monitor: it collects information, stores the information for display, generating warnings and alerts, sends emails and other notifications, and supports the MySQL Enterprise Dashboard as the interface to the system.
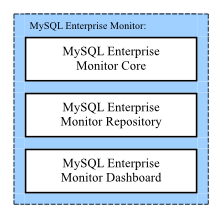
You can consider the MySQL Enterprise Service Manager as being composed of three parts:
The MySQL Enterprise Service Manager core, built on top of the Tomcat web server, is the server that handles tasks such as collecting information from each MySQL Enterprise Agent, formatting and inserting information into the repository, and executing the rules from the MySQL Enterprise Advisor collections.
Because the system is built on top of Tomcat and Java, the performance of the system depends on the configuration and optimization of the Java environment. The standard configuration is designed to support most typical installations, but for installations that involve a larger number of monitored servers, or that support a large numbers of clients using the MySQL Enterprise Dashboard, you can change the configuration to optimize performance. For example, you might increase the Java memory sizes for better caching.
The data collected by the MySQL Enterprise Service Manager is stored within the MySQL Enterprise Monitor repository. The repository uses a MySQL database, which enables MySQL Enterprise Monitor to take advantage of MySQL features such as the InnoDB storage engine and partitioning systems.
You can optimize the configuration of the MySQL server depending on the hardware capacity, for example extending the cache memory for the InnoDB storage engine or the thread processes. The default configuration places both the MySQL server and the Tomcat service on the same machine. To dedicate more resources to the MySQL and Tomcat components, you can separate the two across two different machines.
The MySQL Enterprise Dashboard is a series of JSP pages displayed through the Tomcat service. These web pages display and control all the components of the system, including the different views of data, notification system, graphing engine and the configuration of the MySQL Enterprise Service Manager.
The MySQL Enterprise Dashboard is a web-based interface to the MySQL Enterprise Service Manager. MySQL Enterprise Dashboard provides a quick overview of the current status of your server, and lets you drill down into the current status, events, and historical information submitted by each MySQL Enterprise Agent.
The main features of the MySQL Enterprise Dashboard include:
A single page, Monitor, that gives an overview of the current health and status of all your servers, an overview of any events that are triggered, a heat chart for critical status information, and a customizable set of graphs.
The Heat Chart table shows the current status of all your servers, using icons to highlight important issues. A heat chart is included on the main Monitor tab, and you can also keep a standalone Heat Chart open on your desktop to monitor your server states.
The Advisors tab lets you create, edit, control, install, and schedule advisors within the system.
The Query Analyzer helps you identify problem queries.
The Replication view monitors the structure and health of your replication environment.
The Settings tab lets you set the parameters for the server, including setting notification lists, configuring SNMP, and setting the intervals for removing old data.
The What's New? tab gives a live connection to the MySQL Enterprise website, with news about the latest releases, critical fixes and patches, and any current support issues.
For a more detailed overview of MySQL Enterprise Dashboard, see Section 2.1, “MySQL Enterprise Dashboard”.
The MySQL Enterprise Advisors are organized into collections, according to the subscription level of your MySQL Enterprise subscription. These collections include advisors and definitions for graphs that you can view within the MySQL Enterprise Dashboard.
Each MySQL Enterprise Advisor uses the information collected by the MySQL Enterprise Agent on each machine to test data values or configuration settings and send an event notification when a threshold is reached. Advisors can be a simple piece of advice, a warning, or a critical event. Within the MySQL Enterprise Service Manager these events are displayed through either the events tab, or for critical items, a heat chart summarizing the current status of your MySQL servers.
The events can be displayed within the MySQL Enterprise Dashboard, or can trigger additional notifications, such as an email or an SMS text message. The information provided by the advisors, and the collected data, are also exported through SNMP (Simple Network Management Protocol), so you can use SNMP traps within your existing network monitoring infrastructure.
All advisors are executed according to a schedule that determines how frequently each advisor is executed.
MySQL Enterprise Monitor can monitor any MySQL server from MySQL 4.1 to 6.0. The advisors and rules provide specific support for different versions. For example, there are unique rules and graphs for different MySQL versions, and some rules provide advice about MySQL upgrades.
In addition to monitoring the internal operation of the MySQL server, the MySQL Enterprise Agent and MySQL Enterprise Service Manager can determine the replication topology of your MySQL servers and monitor the replication status.
MySQL Enterprise Monitor uses a number of unique values to identify the different components, including the MySQL instance being monitored:
Each MySQL Server has a UUID, stored in the
mysql.inventorytable, that uniquely identifies the MySQL server to the rest of MEM. The server UUID is used to collate information about a single MySQL instance.Each host (the machine on which the agent is running) has a UUID to uniquely identify the host to the rest of MySQL Enterprise Monitor. This is used to collate the OS information (such as CPU, RAM and disk data). The hostid also determines whether the MySQL server is on the same host as it was before, to identify when data has been moved between machines, or when a machine has been upgraded. The host UUID is stored within the
hostidrow within themysql.inventorytable.Each agent has a UUID to identify the agent to MEM. The agent UUID is defined within the
agent-uuidparameter within the agent configuration file.
These UUIDs are used in combination to register and collate information, and to determine the location and source of an issue.
You can monitor any MySQL server, because the agent communicates with the MySQL server using the same protocol as any other client. For best results when using MySQL Enterprise Agent with your MySQL Server, follow these guidelines:
Each instance must have a unique ID, as stored within the
mysql.inventorytable.Configure the MySQL server with a user that has the correct permissions and rights to be able to monitor the different parameters of the server. The installation guide provides instructions to create a suitable user.
The MySQL Enterprise Agent performs the following tasks:
Connects to, and collects, the core information about a MySQL server. The core data is called the inventory. The inventory includes critical information (known items) about the server which is used to help determine the other information that can be collected. For example, the inventory includes details such as the MySQL server version number, supported storage engines and replication configuration.
Collects a set of standard data items that constitute the bulk of the data sent to the MySQL Enterprise Service Manager. This includes all of the information about the configuration, database objects and other content.
Collects various pieces of information about the host operating system on which the agent is running. This includes CPU, RAM and filesystem information and statistics.
Collects query analyzer data by acting as a MySQL Proxy, collecting, and forwarding MySQL queries from clients and sending the collected query execution information to the MySQL Enterprise Service Manager. This is known as the MySQL Enterprise Agent Proxy Service.
Collects any custom data items that you can optionally configure to provide unique monitoring and statistical information for your MySQL server.
Although the MySQL Enterprise Agent consists of a number of different elements, the components are used collectively as a single application, the MySQL Enterprise Agent. However, in order to distinguish these different elements and their function, they are individually reference and recognized throughout the documentation so that their functionality, configuration, and deployment can be more easily described.
The agent is a general purpose service that provides the basis for all this functionality and is the key component of MySQL Enterprise Monitor as it provides the MySQL Enterprise Service Manager with the information about each individual MySQL server.
Each MySQL Enterprise Agent requires a UUID to uniquely identify the MySQL Enterprise Agent to the MySQL Enterprise Service Manager. This UUID is independent of the UUID assigned to each monitored server. Take care that you do not copy the UUID from one instance of the agent to another, as it will cause incorrect recording of the information by the agent.
When the agent first starts, it performs the following operations:
Loads the configuration information.
Checks that the Agent UUID exists.
Generates what it thinks the current Host ID should be.
Starts the network thread and collector threads.
Compares whether the instance we are connected to has the same Host ID, to make sure we are not starting on a copied instance wrongly.
Registers with the MySQL Enterprise Service Manager and then sends a heartbeat signal.
Receives a "list known data items" call from the Service Manager.
Loads the list of data items, including any custom data items, to be read from the server.
Responds to the Service Manager with the known items.
Receives a "list instances" call from the Service Manager for certain data items.
Runs the inventory process to determine the core information about the MySQL server.
Responds to the Service Manager with the inventory.
Receives schedule information for each data item from the MySQL Enterprise Service Manager in "collect data" tasks.
Starts collecting data and sending it to the MySQL Enterprise Service Manager according to the schedule set during configuration.
Once running, each MySQL Enterprise Agent periodically collects information from the monitored MySQL server and sends it to MySQL Enterprise Agent.
The MySQL Enterprise Agent core architecture provides the basic chassis on which the other components operate. The main purpose of the core architecture is to support the connectivity to the MySQL server being monitored, and the communication ability with the MySQL Enterprise Service Manager to collect and send collected information, and receive configuration and other information from MySQL Enterprise Service Manager
In addition to providing the main chassis for the MySQL Enterprise Agent Proxy Service component, the agent also performs a number of key operations in collecting information from the MySQL server that is being monitored. In particular, the core agent:
Provides the direct monitoring of the MySQL server, including checking the server accessibility, configuration, obtaining the server ID, and setting up the environment to start collecting more detailed information. In addition to the information accessible by accessing variable and configuration information within the server, other configuration parameters, such as the replication configuration, is also recovered from the server.
Collects the operating system specific information, including RAM, disk storage and other data.
Collects the data from the server, including obtaining the values and configuration of the MySQL server, status variables and other information.
Communicates with the MySQL Enterprise Service Manager. Data is collected at scheduled intervals according to the schedule set by the server. This information is then sent to the MySQL Enterprise Service Manager at a regular schedule that is designed reduce the effect of multiple agents on multiple machines simultaneously sending large blocks of data up to the MySQL Enterprise Service Manager at the same time.
These responsibilities are handled in addition to the MySQL Enterprise Agent Proxy Service service that provide information about queries for the query analyzer.
Because the MySQL Enterprise Agent and the MySQL Enterprise Service Manager may lose communication with each other (for example, due to transient network errors), the MySQL Enterprise Agent can store the data that would normally be sent up to the MySQL Enterprise Service Manager. Once communication is re-established, the saved data is sent up to the server.
When using MySQL Enterprise Agent as a proxy service, the queries from user applications are sent through the MySQL Enterprise Agent, which forwards them onto a MySQL server, returning the query results while recording query statistical information. When operating in this mode, the agent acts as both the agent and proxy for the same monitored MySQL server (see Figure 1.3, “The MySQL Enterprise Monitor Architecture when using proxy and agent services for the same MySQL Server”).
Figure 1.3. The MySQL Enterprise Monitor Architecture when using proxy and agent services for the same MySQL Server
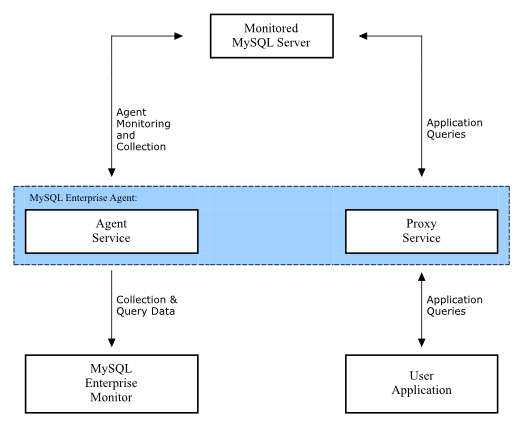
The figures shows a single MySQL Enterprise Agent and two of the components, the core agent service and the MySQL Enterprise Agent Proxy Service. The MySQL Enterprise Agent is connected to the single monitored MySQL server. In turn, the MySQL Enterprise Agent is connected to the MySQL Enterprise Service Manager to provide monitoring and query analyzer data, and to the user application, which uses the proxy service to supply query analyzer data.