Table of Contents
This chapter contains information about the main sections of MySQL Enterprise Dashboard, how to use the interface, and how to set the different configuration and other settings.
You can open the Dashboard and connect to the MySQL Enterprise Dashboard either
using the standard HTTP protocol, or using an SSL connection
(HTTPS). By default, you can connect to MySQL Enterprise Dashboard using
http://,
where host:18080host is the hostname or IP address of the
MySQL Enterprise Service Manager. The default SSL URL is
https://.
You can override these values during installation. To check the
configured values, look at the
host:18443configuration_report.txt file within your
installation directory.
You can configure additional users to have access to your MySQL Enterprise Dashboard. Each user can have a specific privilege level: read-only, restricted from using the Query Analyzer data, or prevented from using any administrator features. For more information, see Section 2.8.4, “Managing Users”.
If you are connecting using SSL, the built-in certificate is self-signed and may be highlighted as 'unsafe' within the browser on initial connection. To prevent problems accessing the site, add an exception for the certificate to your browser for this server.
The MySQL Enterprise Dashboard provides you with information about your MySQL servers: a list of the latest MySQL Enterprise Advisor reports, server status information, MySQL Enterprise alerts, and updated views of monitored MySQL servers. The Monitor screen gives a quick overview of the status of your MySQL servers.
You access the MySQL Enterprise Dashboard through a standard web browser. For more details on the supported browsers, see Section B.2, “Supported Browsers”.
The MySQL Enterprise Dashboard page is divided into four sections: the header, the footer, the main bar, and an context-sensitive Servers list. These areas perform the following functions:
The Header
The top of the screen shows the refresh cycle and
HelpandLog Outlinks. Click theHelplink to open the documentation in a separate browser window. ChooseLog Outif you wish to leave the Dashboard or to log in as a different user.The Refresh selection configures the MySQL Enterprise Dashboard page to automatically refresh and reload at a specific interval, for pages that you leave open for a long time and consult at a glance. Do not make the interval too short, or the load on the MySQL Enterprise Service Manager might affect overall performance.
The Footer
The footer has external links to MySQL Enterprise and information about the current user. You can remain connected to the Dashboard and update your subscription, use the Enterprise Knowledge Base, and contact technical support. Your subscription information is also displayed here, showing the number of days remaining and the number of licenses. The number of licenses indicates to the number of machines that may be monitored; any number of MySQL servers may be running on a specific machine.
The footer also contains a link to the
Settingspage. If your subscription is current it reads Subscription is up-to-date. More info..... For more information about theSettingspage, see Section 2.8.7, “Product Information”.The tab on the left displays the Server tree, where you navigate to different groups or to specific servers. By default, the first group of servers is selected. This selection determines the information shown on the Monitor page.
If a server group is selected, the information presented on the Monitor page is aggregate information for this group; if only one server is selected, the information applies to that server only.
When you change your server selection, the information shown in the graphs and in the Heat Chart changes.
NoteFor more information about server groups, see Section 2.8.3.2, “Grouping Servers”.
The individual server, or server group, selected in the Server Tree also determines what information appears when the Advisors tab or the Events tab is selected.
The Main Section
The main section of the page shows the relevant information for the selected task or option. For example, when the Query Analyzer tab is selected, the main section of the page shows the Query Analyzer data and a list of the current queries.
You can navigate to a number of pages that provide more detailed information. These pages include:
Monitor: The overview page that shows a quick summary of the servers, their status, events, availability and load. The remainder of this chapter details the contents of this page.
Advisors: Shows the various advisors configured in your installation and lets you schedule their execution on different servers, apply and manage rules and manage the advisor installation itself. For more information, see Section 2.3, “The Advisors Tab”.
Events: Provides an interface into the event system that highlights specific issues and problems on your monitored servers. For more information on using Events, see Section 2.4, “The Events Tab”.
Graphs: Lets you view and configure graphs covering various statistics. For details on how to view and use these graphs, see Section 2.5, “The Graphs Tab”.
Query Analyzer: Interfaces to the query monitoring system that monitors and tracks the individual queries that are being executed on a system. You can find problem queries that may need optimization or that may affect server load. For more information, see Section 2.6, “The Query Analyzer Tab”.
Replication: Provides information on the status and structure of your servers that use replication. This page is only available if you have a suitable subscription level. For more information, see Section 2.7, “The Replication Tab”.
Settings: Controls the settings for the server, including email configuration, passwords, and server and user management. For more information, see Section 2.8, “The Settings Tab”.
What's New?: Provides the latest news and information about your installation directly from the Enterprise website. For more information on the data provided, Section 2.9, “The What's New Tab”.
The default tab, Monitoring, which is shown when initially logging in to MySQL Enterprise Dashboard, provides a quick overview of your current monitoring information, and provides an instant health check for all of the MySQL servers across the enterprise.
From this page, you can:
View monitoring data and all critical MySQL Advisor Rule violations for all or selected servers.
Close and annotate MySQL Advisor Rule violations.
Determine if there is a Monitor Agent that is not communicating with the Service Manager.
Determine if there is a server that is in trouble or completely down.
View indicator value graphs for key MySQL and operating system (OS) level metrics. Graph presentation defaults to a thumbnail view, but opens into a larger image upon being clicked.
Graphs are shown in the center of the page beneath the tabs. If applicable, you also see a list of critical events.
On the right is the color-coded Heat Chart,
showing the advisors that are installed by default. The
Heat Chart shows the most important advisors,
allowing a quick overview of the state of your servers. You can
open the Heat Chart in its own window by
clicking the Standalone Heat Chart link. If
applicable, you also see a list of critical events.
The Show/Hide Legend link toggles display of
the explanations of the icons used in the Heat
Chart.
Find colorblind-accessible icons in the
alternate directory. On Linux, this
directory is immediately below the
/monitor/apache-tomcat/webapps/ROOT/web/resources/images/
directory. These images are stored in the same directory on
Windows. To use them, back up the originals and then copy and
paste the alternate set into the images
directory.
When a specific server is selected in the Server
Tree, the Meta Info area beneath the
legend shows details about this server. The information shown in
this area is the host name, the MySQL version number, the number
of scheduled rules, the operating system, and the CPU.
The Meta Info section also shows how long the
agent has been running, when it last contacted the MySQL server it
is monitoring, and the last time the agent contacted the
dashboard. When you mouse over the date shown beside Up
Since, a pop-up box displays the elapsed time since the
server instance was last started. You can also mouse over the
Last MySQL Contact and the Last
Agent Contact dates.
In the case of remote monitoring, the agent runs on a different
machine than the MySQL server that it is monitoring. The
Hostname, MySQL, and
Rules information applies to the system being
monitored. The OS and CPU
information applies to the machine on which the agent is
running. For more information about remote monitoring, see
Section 5.3.7, “Configuring an Agent to Monitor a Remote MySQL Server”.
The center of the Monitor page gives a visual representation of the state of your servers.
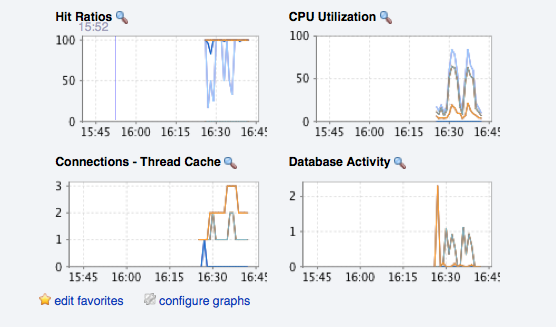
The graphs present information about the currently selected server or server group. The default graphs show the hit ratios, CPU utilization, connections, and database activity for a specific interval.
Graphs also let you drill down from overall usage information to the queries that were being executed on the server at the time. Click and drag on a graph to zoom in on the graph content and view the queries that were being executed during the specified period, to understand server performance and responsiveness. This information is only available when you configure query analysis, and enable query analysis for the servers you are monitoring. For more information, see Section 2.6, “The Query Analyzer Tab”.
To set the interval, click the configure
graphs link immediately below the graphs. In the
resulting dialog box, choose the default interval for the x-axis
of the graphs. Defining a shorter or longer interval gives you a
shorter or longer term view of server activity. You can also
adjust the thumbnail and full-size graph dimensions from this
dialog box. Save any changes, and the chosen values become the
defaults whenever you log in.
You can also choose the default graphs shown on the
Monitor page. Click the edit
favorites link and choose the graphs you want from the
drop-down list box. To choose contiguous graphs, hold down the
Shift key and click the desired graphs. To
select graphs that are not in a sequence, click the desired
graphs while holding down the Ctrl key. The
Monitor page can display a maximum of six
graphs. Save your changes, and these become be the default
graphs whenever you log in.
Color coding helps distinguish different aspects of each graph.
With Database Activity for example, you can
readily distinguish SELECT statements from
INSERT statements.
Clicking a graph opens a detailed view with Graph Display and Configure tabs. Choose the Configure tab to temporarily change the way that a graph displays. Changes made from this tab only apply to the standalone graph while it is open. Persistent changes are made as described above.
Dismiss the enlarged graph by clicking the button.
Alerts from the event system are displayed immediately below the charts. For more information on the events display, see Section 2.4, “The Events Tab”.
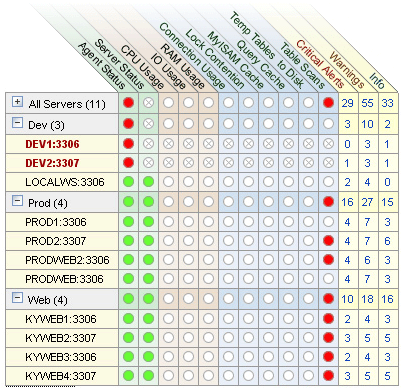
The Heat Chart is on the right side of the Monitor page and shows the status of critical rules. Monitored servers are organized by groups. To view the status of a specific server, click the button next to the appropriate server group.
Whenever a new agent contacts the Service Manager for the first time, all the rules in the Heat Chart Advisor are automatically activated. These Advisors monitor the status of the server and agent, critical operating system indicators, and important events related to your MySQL servers. An example follows.
To interpret the Heat Chart, see the following legend.
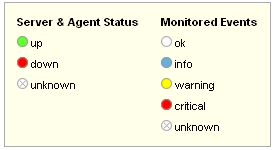
The status unknown typically applies when an
agent is down and can no longer report the status of the server
that it is monitoring. The status unknown can
also apply if the data that should be collected is not available
on the server being monitored.
You can open the Heat Chart in its own browser window by clicking the Standalone Heat Chart link immediately below the Heat Chart on the left. You can set the refresh rate to a different rate than the setting on the Monitor page.
In addition to showing the most important advisors, the Heat Chart also has columns that display the number of critical, warning, and informational alarms. Clicking the hyperlink in any one of these columns takes you to the Events tab, which gives more detailed information. For more information about events, see Section 2.4, “The Events Tab”. Hovering over the heat chart also provides server counts within the tooltips pop-up.
When the Dashboard is first installed, no notification groups are associated with the Advisors shown in the Heat Chart. For more information on this topic, see Section 5.2.7.3, “Installing, Updating or Upgrading Advisors After Initial Login” and Section 2.8.5, “Manage Notification Groups”.
MySQL Enterprise subscription, MySQL Enterprise Monitor, MySQL Replication Monitor, and MySQL Query Analyzer are only available to commercial customers. To learn more, see: http://www.mysql.com/products/enterprise/features.html.
MySQL Enterprise Advisors are a series of scripts that gather information from your MySQL servers via the Service Manager and the Monitor Agents, analyze that information based on custom rules included as part of MySQL Enterprise Monitor, and then offer alerts and advice when necessary. As new rules are introduced, the MySQL Enterprise Advisors can be updated through the MySQL Enterprise website.
The MySQL Enterprise Advisors fall into the following categories:
Administration:
Better manage databases.
Suggest improvements for smoother operation.
Heat Chart:
Drive the status indicators in the Heat Chart.
Identify up/down status and performance issues.
Performance:
Identify potential performance bottlenecks.
Make suggestions for improved database speed.
Replication:
Identify replication bottlenecks.
Improve replication design.
Schema:
Identify schema changes.
Find security loopholes.
Security:
Protect MySQL servers.
Find security loopholes.
An advisor category provides a set of rules designed to enforce MySQL best practices for that specific category. Rules can be targeted to run at the individual server or group level and, upon rule violation, provide alerts and expert advice on how to address and correct a problem before it becomes a costly outage.
The file items-mysql-monitor.xml contains
supplementary information used to construct rules. On Windows, this
file is in the C:\Program
Files\mySQL\Enterprise\Agent\share\mysql-monitor-agent
directory and on Unix, in the
/opt/mysql/enterprise/agent/share/mysql-monitor-agent
directory. Find below the rule for discovering a
root account with no password.
<ITEM>
  <NAME>no_root_password</NAME>
  <FIELD>no_password</FIELD>
  <SCOPE>table</SCOPE>
  <CODE>
    <![CDATA[SELECT COUNT(*) AS no_password FROM mysql.user WHERE user='root' AND password='']]>
  </CODE>
  <NAMESPACE>mysql</NAMESPACE>
  <RETURNS>INTEGER</RETURNS>
  <SOURCE>table</SOURCE>
  <INSTANCE>mysql.user</INSTANCE>
</ITEM>
Your MySQL Enterprise subscription level determines which rules are available to you. Subscription levels are cumulative, meaning that higher MySQL Enterprise levels have access to all the rules of the lower levels.
When the Dashboard is first installed, the only rules that are scheduled are those that belong to the Heat Chart group.
Go to the Advisors screen by logging in to the Dashboard and choosing the Advisors tab.
Instructions for installing Advisors are given in Section 5.2.7.3, “Installing, Updating or Upgrading Advisors After Initial Login”, and following. Principally, you need to configure your MySQL Enterprise login or enter your product key before you can update your Advisors.
If your MySQL Enterprise login is configured, you can download
the latest Advisors by navigating to the
Advisors tab and finding the Check
for Updates link. You can periodically update advisors
in this way.
If you do not have Internet access and cannot use the online update option you can manually import advisors. This process is described in Section 5.2.7.3, “Installing, Updating or Upgrading Advisors After Initial Login”.
Once the MySQL Enterprise Advisors have been installed, you can configure which advisors you would like to run on a scheduled basis.
You can schedule rules by individual server or by group. This is done by first selecting the desired server or server group from the Server tree found on the left side of the screen. Next select the Advisors tab.
Opening the Advisors tab takes you to the
Current Schedule page. If you have only just
installed the MySQL Enterprise Monitor then you will only see the Heat
Chart group of advisors. Clicking the
button will show all the rules in the
Heat Chart group.
Clicking the button beside any specific
rule will show the servers that this rule is running on, its
frequency, and its status. Initially, all the Heat
Chart rules are enabled.
For a more complete description of a rule, click the rule's name. This opens a dialog box that gives detailed information about the rule.
To view the advisors other than the Heat Chart group, select the
Add to Schedule link. This will show all the
advisors available for your subscription level.
Rules are grouped by functionality and displayed in alphabetic order. To expand a group click the button to the left of the advisor name.
You may activate all the rules in a group by selecting the
checkbox beside the group name. Once selected you may apply rules
against a specific server or a group of servers. A message showing
the group of servers or the specific server you have selected will
display immediately below the
button. For example, if the All Servers group
is selected in the server tree, then the message will read,
“Schedule Advisors Against All
Servers”.
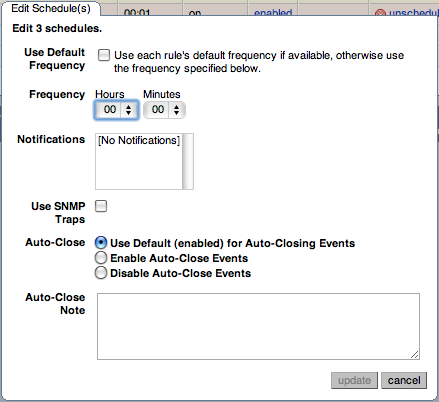
To select a specific rule, expand the group tree by clicking the button. Select the checkbox to the left of the rule you wish to schedule. Click to display the following dialog box:
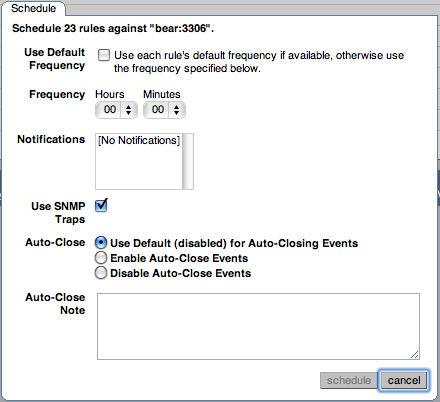
The Schedule dialog box lets you configure the following fields:
Frequency: Dictates how often the rule will run. The default value for different rules varies but a rule can be set to run at any interval desired.
WarningSetting the frequency of a rule involves tradeoffs. Rule evaluation consumes system resources: CPU, memory, and disk space. While the amount consumed is small, if you run all the rules against dozens of servers on a very frequent basis, you may put a significant load on the Service Manager. So select an appropriate frequency. For example, unless you are stopping and restarting your servers frequently, rules that check server configuration variables probably don't need to run very often.
Another consideration is that certain status variables increase monotonically until a server is restarted. Examples of these are
Key_reads,Qcache_hits,Questions,Table_locks_waited, and similar variables. The value returned bySHOW STATUSfor these variables is the value since the server was started (or since the lastFLUSH STATUScommand), which is not very useful for performance tuning, especially if the server has been running for an extended period of time. For performance tuning it is much better to know the change in state (for example, delta) of these values over the last 10 minutes, 1 hour, or whatever time frame is appropriate for your application. The frequency at which you schedule a rule is the time frame used to calculate the delta values of these variables, and it is the delta that is used in expression evaluation, not the absolute value. Consequently, select a frequency that is appropriate for the metrics being used in the expression.Notifications: A listbox of users, notification groups, or both who will be emailed when an advisor reaches an alert level. Single or multiple selections are allowed. For instructions on setting up notification groups see, Section 2.8.5, “Manage Notification Groups”.
Use SNMP Traps: Indicates that an SNMP trap should be raised for this rule. For details on the SNMP configuration within MySQL Enterprise Monitor, see SNMP Trap configuration.
Auto-Close: Specifies whether the rule should use the auto-close system. Events triggered by rules can be automatically closed when the situation that triggered the rule is no longer in effect. Some rules are configured with auto-close enabled by default. To determine which advisors this applies to, see Section B.9, “Advisor/Graph Reference”. For more information on closing and auto-closing events, see Section 2.4.1, “Closing an Event”.
You can configure individual rules to either use the default auto-close settings for the advisor, to enable auto-close events, or to disable auto-close events. If auto-close of events has been enabled, you can specify the text that will be added to the event closure by adding it to the Auto-Close Note textbox.
Once you have set the schedule parameters, click the button to schedule the advisor.
You can schedule multiple rules by selecting the checkbox next to each rule and clicking the button is an effective way to schedule multiple rules.
When scheduling more than one rule, you have the option of selecting a checkbox to use the default frequency of each rule or you may choose a frequency that will apply to all selected rules. When customizing the frequency, take care that you choose a value that is appropriate to all the rules selected.
If the agent does not have the SUPER
privilege and InnoDB-related rules are scheduled, a warning will
appear in the DataCollection log. This also
occurs if mysqld is started with the
skip-innodb option. For more information about
agent rights see Section 5.3.1, “Creating a MySQL User Account for the Monitor Agent”.
It is particularly important that
Notifications be set for the Heat
Chart group of rules. This is easily done from the
Current Schedule page by clicking the
button beside a rule and then clicking
a server.
Doing this opens a window with three tabs
—Overview,
Settings, and Advanced.
The Overview tab shows which advisor group a
rule belongs to, a description of its purpose, and a link to the
history of this alert.
In the Settings tab you can adjust the
frequency of this rule and also specify a notification group. To
select more than one contiguous group press the
Shift key and click the desired groups. (Some
web browsers may require that you drag your selection.)
Noncontiguous selections are made by holding down the
Control key and clicking the desired groups.
If you haven't set up global SNMP traps and would like your
Network Management System (NMS) to handle events related to a
specific rule then check the Use SNMP Traps
checkbox. For more information about Simple Network Management
Protocol (SNMP) see Simple
Network Management Protocol (SNMP) Traps.
The Advanced tab gives detailed information
about how this rule is implemented.
The frequency and thresholds defined for a rule are default
recommendations. To edit these properties choose the
Create/Edit Rule link.
The following image shows the screen used to edit rules:
Beside the rule name is the Advisor drop-down
list box, used for setting the advisor group. This list box shows
existing groupings and any you may have added. The
Expression textarea shows the advisor rule,
Variable Assignment the data item associated
with variable(s) used in the rule and
Thresholds determines when to trigger each
alert type.
The three levels of Thresholds are
Info Alert, Warning Alert,
and Critical Alert indicating increasing levels
of severity. Levels can be triggered by the expression result
being equal to a certain value, greater than a certain value, or
less than a certain value.
The data items that variables are associated with are operating
system (OS) properties such as available RAM or MySQL
characteristics such as the InnoDB buffer pool. To see all
available data items drop down the Data Item
list box. For a listing of these data items see
Appendix D, Data Collection Items.
In Figure 2.5, “MySQL Enterprise Dashboard: Editing Rules” the drop-down
Data Item list box within the Variable
Assignment frame shows the various MySQL server status
or operating system specific variables that may be used in
expressions. The text boxes below Thresholds
define the levels at which informational, warning, or critical
alerts are issued.
To lower the threshold for an informational alert, simply increase
the number given in the Info Alert text box.
When a data item can apply to multiple objects, you need to
specify which instance to use for that item, hence the
Instance text box. In almost all cases this
should be set to local. The exceptions are as
follows:
For CPU-related items set Instance to
cpu0. Additional CPUs on a system are referred to ascpu1, cpu2and so on.There can be multiple disks mounted on a system. To refer to a specific drive set Instance to the name of of the mounted drive. On Windows this would be
C:, D:, and so on. On Unix systems, use whatever is valid for the df command.For RAM-related items set Instance to
mem.Where there are table-specific variables, the database name and table name must be specified in the Instance text box. This topic is discussed in detail in what follows.
It is not possible to have a data item that is unrelated to an
instance. This raises the error, You must map
"<variable>" to an instance, and you will be
unable to save the rule.
An agent can only collect data from one MySQL server, so the
instance entry for a variable in a rule does
not need to specify which MySQL server to use; no matter how many
servers are being monitored there is always a one-to-one
relationship between an agent and its monitored server.
However, on one server there may be multiple occurrences of a
variable. For example, there are multiple possible occurrences of
table-specific variables such as Avg_row_length
because there can be multiple databases and tables defined in a
MySQL server. In this case, the “instance” refers to
the database and table that a data item should be associated with,
specified in the form
databasename.tablename.
So, for example, if you want to reference the
Avg_row_length of the mysql
database user table in an expression, select
the mysql:tablestatus:Avg_row_length from the
Data Item list box and specify
mysql.user in the Instance
text box.
On the other hand, in the case of a global server variable, there
is only one possible target. For example, there can only be one
instance of delay_key_write because this
variable is global and applies to the server as a whole. In this
case specify local in the
Instance text box.
To save your changes click the button at the bottom of the page.
You can change only the thresholds and the frequency of built-in rules. So that rules function properly when updated, other changes are prohibited.
Should you wish to make other changes to a built-in rule, copy it and modify it as desired.
You can edit a rule even if it is currently scheduled. Your
changes will not be overwritten when new rules are imported using
the Check for Updates link.
MySQL Enterprise subscription, MySQL Enterprise Monitor, MySQL Replication Monitor, and MySQL Query Analyzer are only available to commercial customers. To learn more, see: http://www.mysql.com/products/enterprise/features.html.
Once an advisor has been scheduled, it will run at set intervals. If it finds nothing of interest no alerts or emails will be created.
Events are defined using a number of different levels according to the severity of the alert. The seven levels are
Failure: Indicates a failure for the given rule or event. Usually this indicates that the rule on which the event is based has failed, probably due to a typo or other error. Occasionally it can indicate a failure to retrieve the required information for a given rule.
Critical: The event is critical and requires immediate attention. Critical events normally indicate that a serious problem has, or is about, to occur. You should examine the event and determine the cause and fix it as soon as possible.
Warning: The event is a warning of something that you should be aware of, but which is not affecting the operation of your server.
Info: The event is for informational purposes. Info events are used to indicate issues that do not affect the operation of your server, but which may highlight a minor configuration or other issue.
Success: The rule has executed successfully with no issues. This is used to indicate that the result of the rule is OK and is used to indicate when an event that was previously in a Critical or Failure state has returned to normal.
Unknown: Indicates when the current state of the event/rule is currently unknown. This state can be issued when the current status of the event cannot be determined.
Closed: The issue has been corrected and marked closed.
For convenience, the event states are also represented by icons, as defined in the table below. The table also shows the relative level of the alert from the highest (Critical) to the lowest (unknown). The order represented here is used when identifying when an event has transitioned between levels (for example, from Success to Critical), hence triggering a notification, and when sorting events based on their current state.
| Icon | Description |
|---|---|
| An octagonal red icon indicates a critical alert. | |
| A triangular yellow icon a warning. | |
| A conversation bubble is an informational alert. | |
| A green tick beside an event indicates that the rule has run successfully and no alert created. | |
| A question mark icon indicates that the status of the rule is unknown. |
When alerts are triggered, they appear on the Events screen. Alerts also appear on the Monitor screen in order of severity. The notification group or groups associated with a specific rule receive email notification when an alert is triggered. For more information about creating notification groups see Section 2.8.5, “Manage Notification Groups”.
To view open events, click the Events tab. The tree-view on the left determines which server or server group these events belong to. Open events are shown in tabular format.
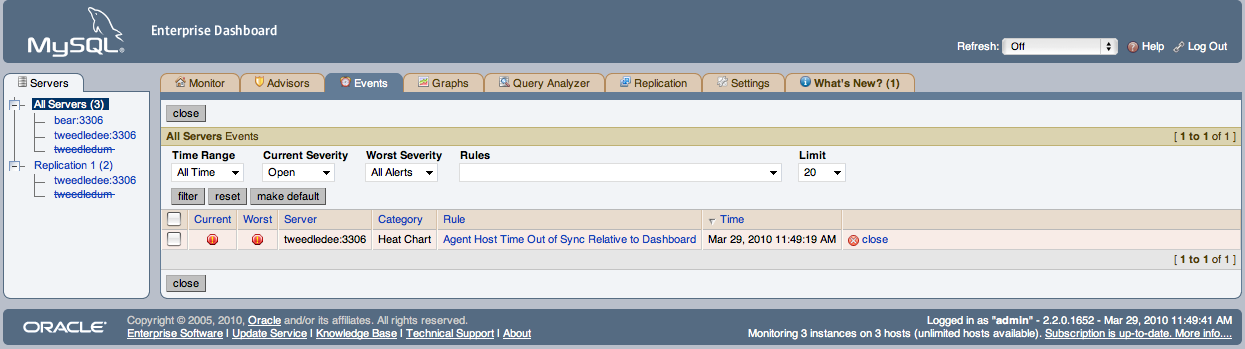
The event table has the following columns:
Current: An icon indicating the current severity of the alert
Worst: An icon indicating the worst severity recorded for this alert
Severity: An icon indicating the severity of the alert
Server: The name of the server the alert applies to
Advisor: The category of the advisor
Rule: A short description of the rule that has been violated
Time: The approximate time the event occurred
Status: The status of the event
Unnamed Column: Provides a link to the
Closedialog box
By default, all events are shown but the list of events can be filtered using the form displayed above the event list. The options include filtering by:
Severity
Date (using a range with From/To)
Advisor group
Specific rule
Status
Choose the options you are interested in and click the button to refresh the display. You may limit the number of items that appear on a page by choosing a different value from the Limit drop down listbox.
The drop down list box showing severity has the options:
All, Alerts,
Critical, Warning,
Info, Success, and
Unknown. Selecting the option
All shows all alerts and also those rules that
have run successfully.
A successful rule is one that has not been violated and is indicated by a green tick icon.
The Alerts shows only those rules that have been
violated.
Columns can be sorted by clicking the individual column headings. The alerts shown in Figure 2.6, “MySQL Enterprise Dashboard: Events Screen”.
The server shown in Figure 2.6, “MySQL Enterprise Dashboard: Events Screen”, is filtered
for All. Typically, when filtering by severity
you would choose Alerts and, if you see a
Critical, Warning, or
Info alert, use the All filter
to see when the rule last ran successfully. This may assist in
determining the cause of the alert.
Besides filtering for severity, you can also choose to filter for a
specific time period using the From and
To text boxes. You also have the choice of
filtering by specific rules or categories of rules. The
Status drop-down list box let's you choose
All, Open, or
Closed events. To avoid excessive scrolling, you
can also limit the number of events that show on a specific page.
For more information about an alert, click the rule name. A pop-up window will appear showing a description of the alert and the exact time of occurrence. This pop-up windows provides links to useful resources and advice for resolution. You can also view the exact expression that generated the event.
The creation of an event by an advisor rule signifies that there an issue has been raised which may require closer attention. Once the event has been identified, you should investigate the issue that triggered the event, rectify the issue or problem (or choose to ignore it), and then close the event when you are satisfied that the event is not having a significant impact on your server or servers.
Some of the advisors are designed to identify issues in your
server or MySQL Enterprise Monitor environment that may either be of a transient
nature, or that may indicate a temporary issue (such as a
replication slave being unavailable). For these advisors, you can
schedule events to automatically be closed when the event moves
from notification status back to the Ok state.
You can configure auto-close functionality on all advisors through the Advisors tab when you schedule the advisor against one or more servers. When auto-close is enabled, the event will remain open while the condition that triggered the event is still in effect. When the condition is no longer broken, the event will automatically be closed with the configured auto-close test. You can still manually close events that have have been configured with auto-close enabled. For more information on scheduling rules, see Section 2.3.2, “Scheduling Rules”.
To close an individual alert click the close link in the Operations/Notes column. Document the resolution using the Resolution Notes text area and choose the button. During the closing operation, you can also reconfigure the rule scheduling that triggered this event, and the auto-close settings. For more information on configuring rule scheduling and auto closing, see Section 2.3.2, “Scheduling Rules”.
To close a number of alerts simultaneously, select the checkbox beside each alert that you wish to close and then click the button.
When closing individual or multiple events, a notification window
will be shown indicating what operations have been completed. The
events will remain in the displayed event list, but the
close link will instead be a link to the
resolution notes. You can update the active
list by clicking to re-filter the
event display.
An historical list of all events, including closed events, is
available by using the Current Severity and
setting it to Closed. The list will show all of
the closed events for a given time range and the servers selected
in the server tree.
Notification of an event takes place when a rule is executed and the severity level for a given rule changes from a lower status to a higher one. This occurs on the first change to each individual severity level until the event has been closed.
For example, the table shows the severity levels raised during the lifecycle of a single event, showing when a notification is actually raised.
| From Level | To Level | Notification Raised? |
|---|---|---|
Ok | Info | Yes |
Info | Warning | Yes |
Warning | Info | No |
Warning | Critical | Yes |
Critical | Warning | No |
If auto-close has been enabled for a given rule, then the above
notification sequence is still valid, but the effect of the
auto-close system is that the event will automatically be closed
when the event reaches the Ok state. This will
re-enable notification when the advisor creates a new event.
SNMP notifications are sent each time a given rule is executed, irrespective of the current or returned state.
MySQL Enterprise subscription, MySQL Enterprise Monitor, MySQL Replication Monitor, and MySQL Query Analyzer are only available to commercial customers. To learn more, see: http://www.mysql.com/products/enterprise/features.html.
Navigate to the Graphs tab by choosing the Graphs tab.
By default four graphs are displayed on the Monitor
page. These graphs present information about the currently
selected server or server group, showing the hit ratios, CPU
utilization, connections, and database activity. Color coding helps
distinguish different aspects of each graph.
From the Monitor tab you can make permanent or temporary changes to the way a graph is displayed. For example, you can choose to display the last hour's activity or you can choose to view a specific period of time.
Persistent changes to the way the graphs display are only made from the Monitor tab. You can set the size of the thumbnails and the full-sized graphs and you can also set their refresh interval. For more information, see Section 2.2.1, “The Server Graphs and Critical Events”. As with the Monitor tab, the data shown in the graphs is determined by the server or group of servers selected in the server tree.
The Graphs tab shows all the available graphs and provides the capability of adjusting the scale of the graphs, allowing a more or less detailed view as the situation requires. To ensure that you have the latest versions of the various graphs click on the Check For Updates link on the top left of this page.
All graphs support the ability to drag and select a specific area of the graph. When you select an area of the graph, the display changes to the Query Analyzer tab and displays the queries that were being executed during the selected time period. You can also zoom into the graph by selecting specific time periods. For more information on using the graphs to monitor the execution of specific queries, see Section 3.2.2, “Using Graphs to Identify Queries”.
The total number of graphs varies depending upon your subscription level. The four graphs that appear by default on the Monitor tab are:
Hit Ratios
Database Activity
Connections
CPU Utilization
When the Graphs tab is first opened, no graphs are visible. To view a graph click the button on the left or, to view all graphs, use the button.
The larger size of graphs is the primary reason for viewing graphs on the Graphs tab rather than on the Monitor tab. Additionally, you can only show a maximum of six graphs on the Monitor tab; the remaining graphs can only be viewed from the Graphs tab.
Change the interval for a graph by choosing values from the Hours and Minutes drop-down list boxes. If necessary adjust the width and height of the graph and then click the button. The changes to the time span apply to all the graphs on the Graphs tab but have no effect on the graphs on the Monitor tab.
To change the graphs both here and on the
Monitor tab use the configure
graphs link on the top right. This opens a dialog box
for setting the default interval for the x-axis. Save any changes
that you have made and the values chosen will be the defaults
whenever you log in. You can also change the defaults from the
Monitor tab as described in
Section 2.2.1, “The Server Graphs and Critical Events”; defaults for other
users will be unchanged.
Use the button to restore the default value for the interval. Doing this will also reset the default size of the graphs.
Setting a graph to display a time span gives you a historical perspective on server activity. You may want to know what was happening at a specific point in time or you may wish to look at an extended period in order to determine patterns or trends. Changing the time span gives you the flexibility to do this.
In the Time Display drop-down list box select
the From/To option. Choosing this option
updates the display to include To and
From text boxes.
Set the date you wish to start viewing from by manually entering the date in year, month, and day format (2007-03-14). However, it is much easier to click the calendar icon and choose a date from the drop-down calendar. Enter a terminating date in the same way. If you wish, you may also choose the specific time of day by selecting the hour and minute.
If necessary adjust the width and height of the graph and then click the button. The changes to the time span apply to all the graphs on the Graphs page but have no effect on the graphs on the Monitor tab. You cannot change the time span of the graphs that appear on the Monitor tab. Changes apply only to the current user; defaults for other users will be unchanged.
Use the button to cancel your changes.
Query Analyzer lets you monitor the statements being executed on a monitored server and retrieve information about the query, number of executions and the execution times of each query. Queries are normalized, so that the unique data defined within each query has been removed. By removing the data specific elements of the queries, the generic queries can be counted and identified more easily.
Query Analyzer works by collecting information about SQL statements that your MySQL client application sends to the MySQL server, either by using the MySQL Enterprise Agent proxy service, or by using the MySQL Enterprise Monitor Plugin for a given connector that sends the information directly to MySQL Enterprise Service Manager.
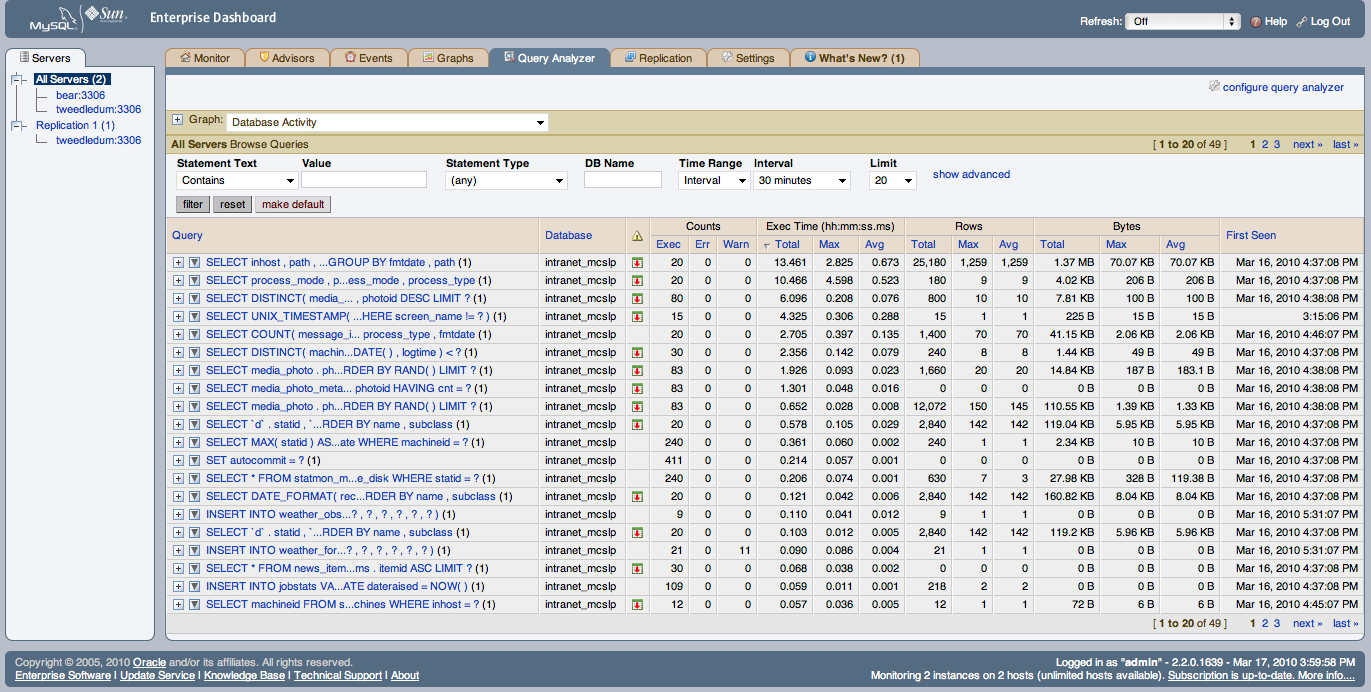
For more information using the Query Analyzer, including how to feed and provide queries to MySQL Enterprise Service Manager, how to use the user interface, and how to drill down to find the queries and information that you need, see Chapter 3, Using the Query Analyzer.
MySQL Enterprise subscription, MySQL Enterprise Monitor, MySQL Replication Monitor, and MySQL Query Analyzer are only available to commercial customers. To learn more, see: http://www.mysql.com/products/enterprise/features.html.
Navigate to the Replication page by choosing the
Replication tab. This page provides a quick
summary view of the state of your replication servers or, if you
wish, you can drill down and determine specifics about any master or
slave.
Servers, whether masters or slaves, must be monitored in order for them to appear on this page.
There will be no Replication page if your
subscription level does not support this feature.
The Replication page groups all master servers
with their slaves. Masters and their slaves are automatically
discovered and a grouping is created. This grouping shows up on the
replication page and also in the Heat Chart on
the Monitor tab. Scans run on a five minute
interval, so depending upon the order of discovery, it can take as
long as 2 polling intervals to create a complete group.
Discovery events are logged to the Replication
log. To view this log navigate to the Settings
page and choose the Logs link. View all
replication-related events by clicking the
Replication link. This log can be a useful tool
should you need to debug the replication topology discovery process.
The agent must be installed on the same machine as the server you are monitoring in order for discovery to work properly. Do not use remote monitoring.
Replication groups can be managed from the Manage
Servers page in the same way as other groups. However, any
slaves removed from a server group will automatically be restored to
that group. It is also possible to add non-slaves to a replication
grouping. For more information about server groupings see
Section 2.8.3.2, “Grouping Servers”.
Choose a value from the refresh drop-down list box to set the rate at which information is updated. This refresh rate applies only to the information presented on this page: It is independent of the rate set for the Monitor tab.
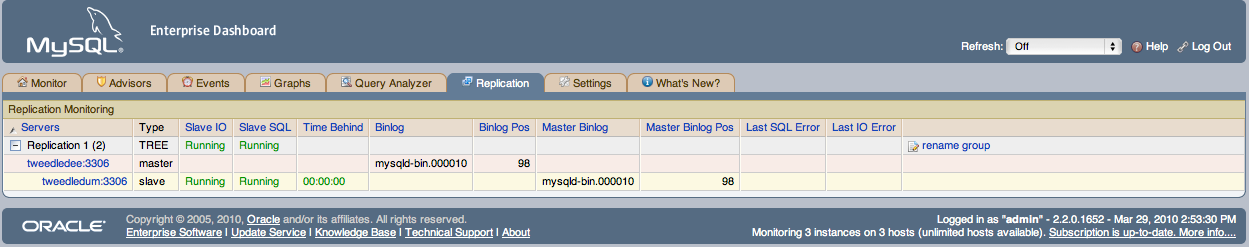
The following columns describe replication servers and their slaves:
Servers: Displays the group name and any master servers and slaves
Type: Indicates the topology of a server group or in the case of individual servers, whether a server is a master, a master/slave, or a slave
Slave IO: Reports the status of the slave IO thread
Slave SQL: Reports the status of the slave SQL thread
Seconds Behind: The number of seconds the slave is behind the master. This column is blank if a server is a master.
Binlog: The binary log file name
Binlog Pos: The current position in the binary log file
Master Binlog: The master binary log file name
Master Binlog Pos: The current position in the master binary log file
Last Error: The most recent error
Unlabeled Column: Use the rename group link on the server group line to edit the server group name
Levels of indentation in the Servers column
show the relationship between master servers and their slaves.
Most column headings are active links that allow you to change the
order of display by clicking the header. Sorting works differently
for different column groupings. Click the Seconds
Behind header to order servers by the number of seconds
they are behind their master. However, in all cases, the server
topology is respected. For example, in a TREE
topology, ordering occurs within branches only.
If the agent is down, servers show in bold red in the
Servers column. The Slave IO
and the Slave SQL columns display
stopped in red text if these threads are not
running. If an agent is down, italics is used to display the last
know status of the IO or SQL threads.
Clicking a master server opens a dialog box that displays information about the server. The information shown includes:
The number of slave servers
The binary log file name
The binary log position
Which databases are replicated and which not
The dialog box also includes a link that allows the user to hide or show the slave servers.
Clicking a slave server opens a dialog window showing extensive information about the slave.
MySQL Enterprise subscription, MySQL Enterprise Monitor, MySQL Replication Monitor, and MySQL Query Analyzer are only available to commercial customers. To learn more, see: http://www.mysql.com/products/enterprise/features.html.
The initial installation lets you configure your MySQL Enterprise credentials and outgoing email settings. This section explores the configuration settings in more detail, and shows how to manage servers, users, notification groups, Simple Network Management Protocol (SNMP) traps, log files, and the product information screen.
Knowledge of server management is a prerequisite for properly configuring advisors, which is explained in Section 2.3, “The Advisors Tab”.
To get to the Settings tab, open the Dashboard and choose the Settings tab.
The Global Settings control the main configuration parameters for the entire MySQL Enterprise Monitor system, including your email notifications, data purge, and Enterprise website credentials.
The Global Settings tab is divided into these sections:
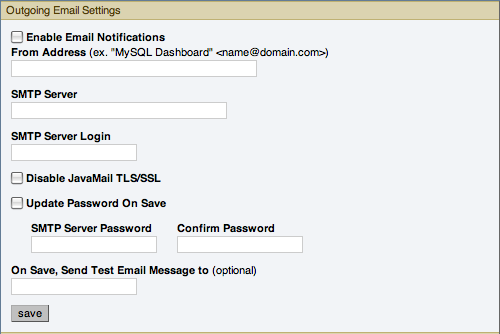
Configures the settings for email notifications by MySQL Enterprise Service Manager. Configure the From Address SMTP Server settings. If your server requires authorization, complete the necessary server login details, and whether SSL is required.
Alert notification via email is a key component of the MySQL Enterprise Monitor Advisor solution. For this reason you may want to immediately configure an SMTP account for at least one recipient.
To do this, choose the Settings tab and go to the
Global Settingsscreen by clicking the appropriate link. Here you configure the email settings that apply to the currently logged-in user.Find the
Outgoing Email Settingson the left of this page.Ensure that the
Enable Email Notificationscheckbox is checked and enter information as appropriate.The default value for the SMTP port is
25. If your mail server runs on a different port, specify the port, separated from the server name by a colon. For example, if your mail server runs on port 587, enteremail.myserver.com:587NoteAn email server must be available for sending email alerts.
The SMTP client uses Transport Layer Security (TLS) if the SMTP server supports it.
If your SMTP server incorrectly indicates that it supports TLS, check the Disable JavaMail TLS/SSL check box.
To test your configuration immediately, add an email address to the On Save, Send Test Email Message to box.
For more information about Outgoing Email Settings.
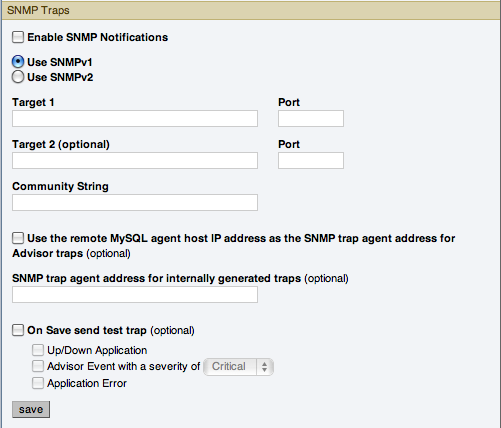
The SNMP Traps section of the Global Settings tab lets you enable Simple Network Management Protocol so that your Network Management System (NMS) can handle events created by the MySQL Enterprise Monitor. SNMP notifications are off by default. To enable them, click the Enable SNMP Notifications checkbox.
MySQL Enterprise Service Manager includes support for both SNMPv1 and SNMPv2. You can select the SNMP version to use by clicking the corresponding Use SNMPv1 or Use SNMPv2 radio button.
In the Target 1 or Target 2 text box enter the IP address or hostnames of your NMS listeners. The port number defaults to the well-known SNMP port,
162. If you are not using this port, enter the port that your Network Management System is listening on.Enter the appropriate community string in the
Community Stringtext box. The default value for this string ispublic.For the trap address for Advisor traps, you can optionally elect to use the address of the agent that triggered the alert, rather than the address of the MySQL Enterprise Service Manager. To do this, click the Use the remote MySQL agent host IP address as the SNMP trap agent address for Advisor traps. For internally generated SNMP traps (i.e. with MySQL Enterprise Service Manager) you can also specify an alternate address by putting the IP address in the SNMP trap agent address for internally generated traps box.
To ensure that the target you have specified is valid, check the
On Save, Send Test Trapcheck box. The remaining check boxes help you to configure how your NMS responds to MySQL Enterprise Monitor. Check the Up/Down Application check box to configure NMS for starting up or shutting down the MySQL Enterprise Monitor. For configuration of advisor events choose a level of severity and check the Advisor event with the severity ofCriticalcheck box. Finally, choose the Application Error check box to configure NMS to support application error traps. Be sure to save your settings before exiting.If you wish to enable SNMP traps globally, check the
Enable SNMP Notificationscheckbox. To enable SNMP traps only for specific rules run against specific servers or server groups leave this checkbox unchecked—enabling specific SNMP traps is done as rules are scheduled. For instructions on doing this see Section 2.3.2, “Scheduling Rules”.The Management Information Base (MIB) file associated with SNMP trapping is called
MONITOR.MIB. For the location this file see Section C.1.4, “The Management Information Base (MIB) File”.NoteThe MIB file supplied with MySQL Enterprise Service Manager is not directly compatible with OpenNMS. For a sample of the modifications that need to be made, please see the comments for Bug#41714.
The
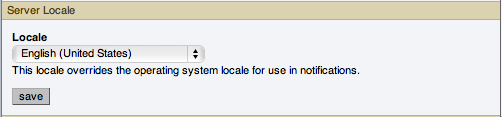
Server Localesetting determines the language of notification for the following items:Email notifications
SNMP traps
The naming conventions for shared resources such as a replication group name prefix
The initial value in this drop down list box is the locale for the OS on which the Dashboard is running.
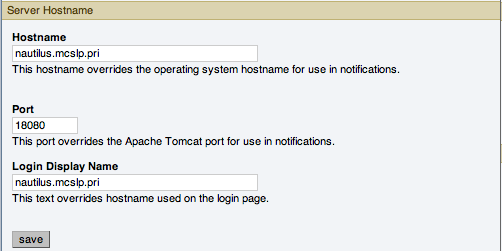
Server Hostname
You can alter the hostname and port used to identify the MySQL Enterprise Service Manager when reporting notifications. This can be useful if the server hostname, and the hostname you want to use when connecting to your MySQL Enterprise Service Manager
NoteOnly change the Port setting if you have altered or redirected the original port used when installing MySQL Enterprise Service Manager. Entering the incorrect information does not affect the accessibility of your system, except when clicking links within the notification messages.
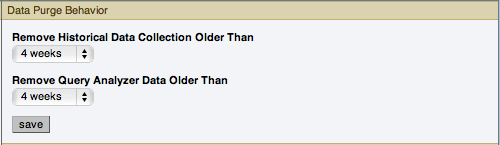
The Data Purge Behavior section of the Global Settings tab lets you remove old log files and also old data from the repository. The default purge interval is
28 days. If you wish to purge data, change this setting by choosing from the drop-down list. Choosing52 weeks, for example, removes all data that is older than a year.WarningPurging data permanently removes information from the repository. Since events are derived from data contained in the repository, they are purged along with the data.
Ensure that there is adequate disk space for the repository. If you are monitoring numerous servers and running many rules the size of the repository can increase rapidly. Choose purge behavior accordingly.
The default value for purging,
never, is the safest option. However, please choose a purge setting that makes sense for your environment.NoteThe purge process is started approximately once every minute. If you change the purge duration from a larger timespan to a smaller one, the data may start to be purged immediately.
You can configure the data purge behavior for a number of different systems individually:
Remove Historical Data Collection Older Than configures the duration that the main data about your servers is retained. This includes all data collections, including CPU, memory and connections and activity statistics.
Remove Query Analyzer Data Older Than configures the duration that the query analyzer statistics and information about individual queries is retained.
Notes for setting purge behavior:
Purging can be carried out manually by enabling the
innodb_file_per_tablefor the repository database and then using anOPTIMIZE TABLEoperation to reclaim space from deleted rows in the table.If you set the purge value to a very low timespan value when the previous setting was quite high, then the space used for the data that was purged is not reclaimed from the InnoDB tablespaces. You can do this by running
OPTIMIZE TABLEon the MySQL tables for MySQL Enterprise Service Manager to reclaim the space from the purged rows.You cannot set the Query Analyzer purge period to a value greater than historical data collection purge period. Attempting to do so produces a warning:
An invalid Query Analyzer data life span was given. Value may not be larger than data life span..
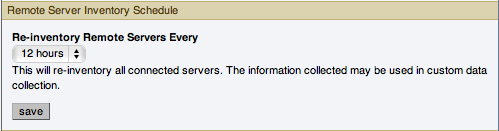
Remote Server Inventory Schedule
MySQL Enterprise Monitor keeps track of all the databases and tables in a server, as well as the amount of RAM, disk space, and other items. A re-inventory updates this information in case you have added or dropped databases and tables. Depending upon the configuration of your system, this operation can tax resources. If you are monitoring many remote servers this is an operation you may want to perform in off-peak hours only.
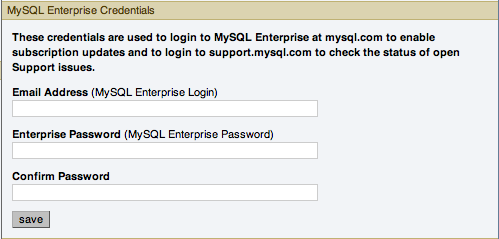
MySQL Enterprise Credentials
You can specify the credentials for logging into the MySQL Enterprise Website. These should match the user name and password that you have registered with MySQL for your enterprise subscription.
NoteOnly administrators can change the
MySQL Enterprise Credentialssection or enter a product key; for other users, this section does not show up in the interface. For more information about different users and their rights see Section 2.8.4, “Managing Users”. Specifying incorrect credentials results in the error message, “Your credentials do not appear to be valid.”HTTP Proxy Settings
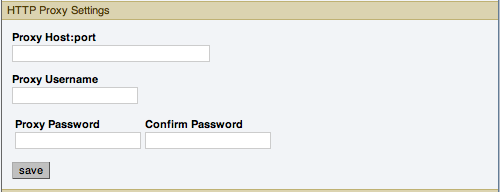
You may want to update your HTTP Proxy Settings if your MySQL Enterprise Service Manager is not directly connected to the internet. The proxy settings are used when updating the information within the What's New tab and when accessing the MySQL Enterprise Website for authentication of your license and product key information. For more information, see Section 2.9, “The What's New Tab”.
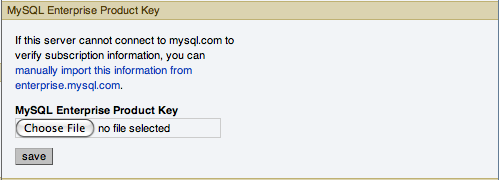
MySQL Enterprise Product Key
You may update your
MySQL Enterprise Product Key. If you do not have access to the Internet from the Dashboard, this provides an alternate way to update or activate the MySQL Enterprise Monitor.To enter your product key first download it from the MySQL Enterprise website. Copy the key to a location accessible from the Dashboard. Use the button to locate the key and then press the button.
If you wish to switch from using your MySQL Enterprise credentials to using a product key to update MySQL Enterprise Monitor, you must first clear your credentials. Do this by removing the email address from the MySQL Enterprise Credentials section and then clicking the button. You may then enter and save your MySQL Enterprise product key.
NoteOnly administrators can change the
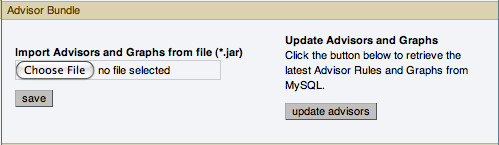
MySQL Enterprise Credentialssection or enter a product key; for other users, this section does not show up in the interface. For more information about different users and their rights see Section 2.8.4, “Managing Users”. Specifying incorrect credentials results in the error message, “Your credentials do not appear to be valid.”Advisor Bundle
You can update your Advisor Bundle and the associated rules and graphs by importing a new Advisor Bundle. To update your Advisor Bundle using a bundle file that you have previous downloaded:
Click and locate your Advisor Bundle on your computer.
Click to upload the updated bundle and validate the contents.
To update the Advisor Bundle automatically from the MySQL Enterprise Website using your existing MySQL Enterprise Credentials, click the button.
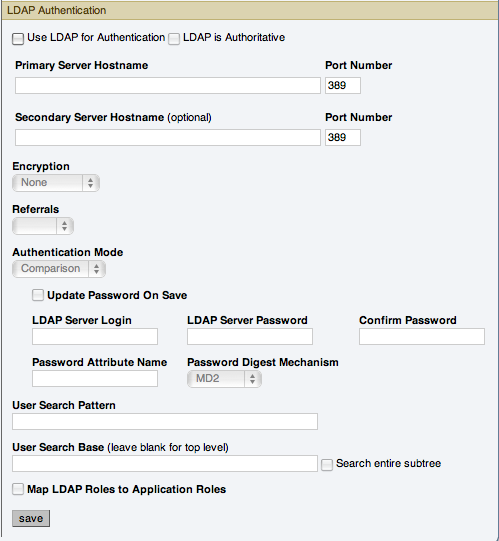
You can configure LDAP Authentication to be used for the users that are provided access to the MySQL Enterprise Dashboard. To use LDAP authentication it must have been enabled and configured within the settings.
The configurable elements for LDAP authentication are:
Use LDAP for Authentication
To enable LDAP authentication, click the Use LDAP for Authentication checkbox.
LDAP is Authoritative
If you want to make LDAP the authoritative (only) authentication mechanism, check the LDAP is Authoritative checkbox. Note that if you select this option and the LDAP service is misconfigured, you can lock yourself out of MySQL Enterprise Dashboard entirely.
Primary Server Hostname
Hostname or IP address of the primary LDAP directory server.
Port Number
Port number of the primary LDAP server. You must change this option to the port used for SSL connections if you have enabled encryption.
Secondary Server Hostname (optional)
Hostname or IP address of the secondary/failover LDAP directory server.
Port Number
Port number of the secondary/failover LDAP server. You must change this option to the port used for SSL connections if you have enabled encryption.
Encryption
Encryption type required for communication with the LDAP server(s). Supported options are
None,StartTLS, andSSL.Referrals
Authentication should follow any referrals provided by the server. The default is to use whatever the LDAP directory server is configured to do. If you are using Microsoft Windows Active Directory, you must set this option to
Follow.Authentication Mode
The authentication mode to use. Choices are
Bind as User, which binds to the LDAP directory using the credentials given to login to MySQL Enterprise Service Manager.Comparisonrequires an LDAP login/password that can see the configured password attribute to make a comparison with the given credentials.User Search Pattern
Pattern specifying the LDAP search filter to use after substitution of the username, where
{0}marks where the username should be substituted for the DN.User Search Base (leave blank for top level)
The entry to use as the base of the subtree containing users. If not specified, the search base is the top-level context.
Search entire subtree
The search scope. Set to
trueif you wish to search the entire subtree rooted at the *User Search Base entry. The default value offalserequests a single-level search including only the top level.Map LDAP Roles to Application Roles
Specifies whether MySQL Enterprise Service Manager should use the roles defined in LDAP to map to MySQL Enterprise Monitor application roles. If enabled, and LDAP is not configured to be authoritative, if a user authenticates successfully via LDAP and has a valid mapped role, they are granted permissions to the application. Roles are mapped according to the entries in the Application Role/LDAP Role(s) fields, which take comma-separated lists of LDAP roles to map to the given MySQL Enterprise Monitor roles.
If you select this option, you are provided with additional fields that let you configure how roles are looked up within the LDAP server.
For more information on LDAP authentication and integration with Tomcat, see Tomcat Documentation.
On this tab users can change their passwords, user name, and locale information.
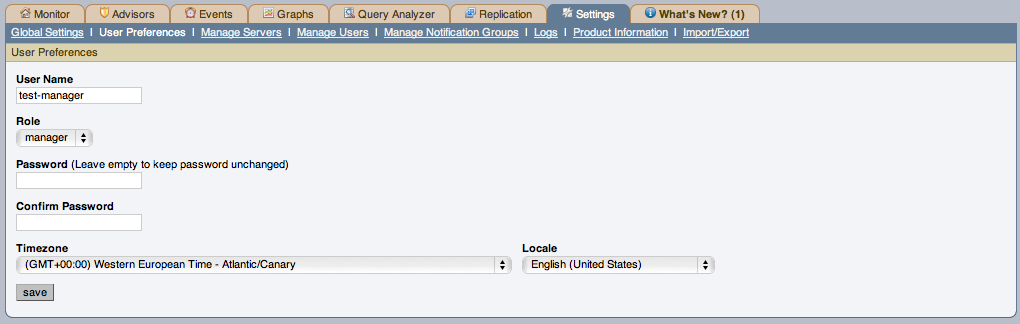
Change your password by entering a new value into the Password text box. To change your user name enter a new value into the Username text box. Click the button to commit this change.
You may also adjust your time zone and locale information from this tab. The settings on this tab apply only to the user who is currently logged in.
The MySQL Enterprise Service Manager determines the default value for the locale by looking at your browser settings. Changing this value, determines the language setting for any future logins to the Dashboard, overriding your browser settings.
Be sure to set the correct time zone so that alerts are time stamped correctly.
This setting applies only to the specific user.
You can obtain a list of the currently monitored servers connected to the MySQL Enterprise Service Manager, and details of the current version and key configuration by using the Manage Servers tab.
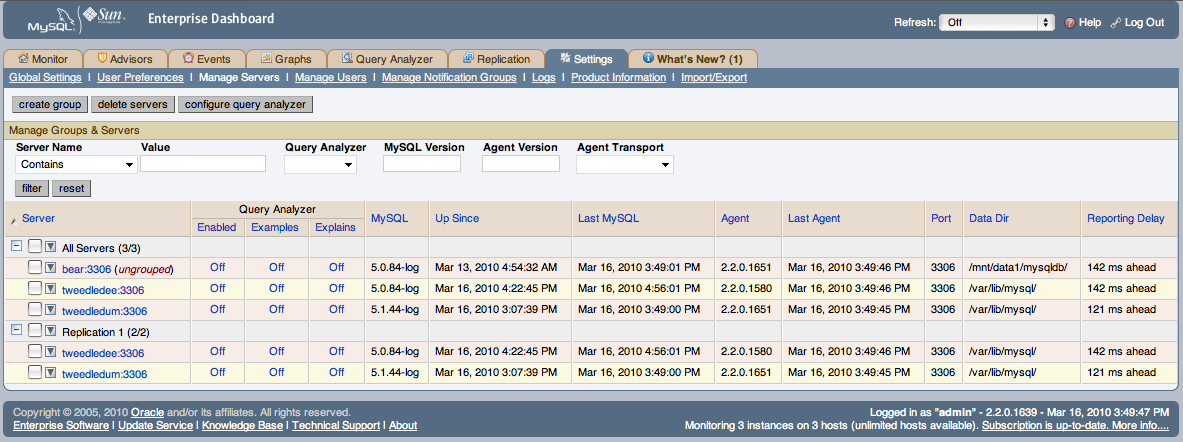
The Manage Servers tab provides a list of servers, organized by groups, in a similar fashion to the main server navigation list. For each server, the following information is displayed:
Query Analyzer
Shows the Query Analyzer configuration for the server, showing whether Query Analyzer is enabled, whether the recovery of example queries is enabled, and whether explain plans for queries have been enabled.
From this display, you can also control the Query Analyzer settings for each server by clicking the link for each server to change the settings. This brings up the Configure Query Analyzer pop-up window. For more information, see Section 3.2.3, “Query Analyzer Settings”.
MySQL
Shows the version number of the MySQL server being monitored.
Up Since
Shows the time when the MySQL server was started (the server up time).
Last MySQL
The last time communication with the MySQL server occurred.
Agent
Shows the version number of the MySQL Enterprise Agent server being monitored.
Last Agent
Shows the last time communication was received from the agent.
Port
The configured MySQL port number.
Data Dir
The data directory path for the MySQL server.
Reporting Delay
The time between when the data was obtained by the agent when it was received by MySQL Enterprise Service Manager.
You can search and filter the server list by using the fields and pop-ups at the top of the list. You can filter using one or more of following techniques:
To filter by server name, select the match type (Contains, Regex, Doesn't Contain, or Negative Regex), and enter a string or regular expression into the Value field.
To filter based on whether the Query Analyzer functionality has been enabled or disabled, use the Query Analyzer pop-up.
To filter by MySQL server version, you can enter either an explicit version number into the MySQL Version field, or you can additional symbols to restrict the versions to different ranges. The field supports the following statements:
Statement Example Description Version Prefix 5.0Shows all MySQL servers matching the specified version. For example, 5.0matches any version of MySQL from 5.0.0 to 5.0.99Explicit Version 5.0.84,=5.0.84Shows all MySQL servers matching the specific version number. > Version > 5.0.84Shows all versions greater than the specified version. >= Version >= 5.0.84Shows all versions greater than or equal to the specified version. < Version < 5.0.84Shows all versions less than the specified version. <= Version < 5.0.84Shows all versions less than or equal to the specified version. String enterprise,logShows all servers with the specified string in their version ! String or Version !enterprise,!5.0.84Shows all servers not having the specified string, or not matching the specified version. You can combine multiple arguments to produce more complex formats. For example, to list all of the servers of 5.1 or higher that do not have enterprise in the version string, you could use
>=5.1 !enterprise.Agent Version
Filters the list based on the MySQL Enterprise Agent version number. This can be useful if you want to know which means require an upgrade to a later version. The Agent Version field supports the same selection criteria as the MySQL Version field, allowing to select based on specific version numbers and strings.
Agent Transport
Filters the list based on the protocol the Agent uses to communicate with the MySQL Enterprise Service Manager. You can select either standard HTTP or HTTPS/SSL-based connections.
After you make you selection, use the button to filter the server list. To reset your selections to show everything, click .
Using the list of servers, you can create groups to more easily manage and monitor your servers according to the departments, applications or other groupings that you may want to use. For information on how to create and modify groups, see Section 2.8.3.2, “Grouping Servers”.
You can also perform simple administration on the server within the MySQL Enterprise Monitor framework, including configuring the Query Analyzer, renaming the server (as it appears within MySQL Enterprise Service Manager) or the group name, and updating the information about the server (re-inventory). All of these operations are handled by using hovering over the triangle next to the server name or group.
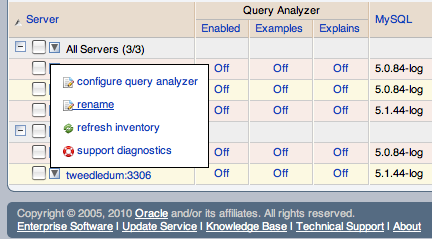
The pop-up provides a list of options, which are different depending on whether you have selected an individual server or a group. For the group, you can only rename the group, delete the group, or obtain a bundled version of the support diagnostics information. For individual servers, you can modify the Query Analyzer configuration, rename the server, refresh the server inventory, or obtain the support diagnostics information.
To change the configuration of the Query Analyzer for the server, see Section 3.2.3, “Query Analyzer Settings”. This option is not available for a group.
To rename a server choose , or to rename a group, choose . For information on renaming a server, see Section 2.8.3.1, “Renaming a Server”. To rename a group, you can change change within the pop-up prompt provided.
To re-inventory your MySQL server and update version and configuration information, click the triangle and choose . This triggers an update of the server information without affecting the schedule inventory process. You can use this when you have upgraded or made significant configuration changes to your server to update the inventory and ensure that the correct rules and advisors are being executed on your server.
You can obtain the support diagnostics file for either individual servers, or entire server groups. To get a diagnostic report file, select from the pop-up menu. The information is provided as a Zip file that is downloaded to the machine. The information contained in the report includes detailed information about your server (or multiple servers if you selected a server group), including configuration, hardware, MySQL options/variables and historical graphs. To view the information extracted, unzip the downloaded file and double-click the
index.html.For generic information about your MySQL Enterprise Monitor installation, see Diagnostic Report.
NoteRenaming a server using the Manage Servers tab overrides all other settings, including changes made within the agent configuration.
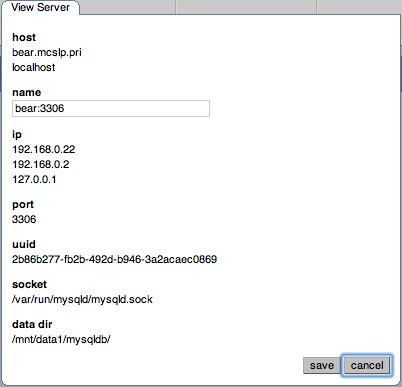
You can rename an existing server without losing the current historical data or configuration information. Renaming the server also lets you make its name more descriptive according to the server's role within your organization. For example, you might rename a server from the default host name to include the department and application for the MySQL server.
To rename a server, click the link next to the server. Enter information about the server, including the host name and registered IP addresses for the agent. Fill in the alternative name that you want to be displayed in the text box at the bottom of the window.
To help with server management, the Service Manager lets you group servers in any fashion you choose. For example, you can manage servers according to purpose. For example, you might group servers by whether the servers handle Internet or intranet data, by whether they power finance or HR applications, or by physical location.
All monitored servers are automatically included in the top
level server grouping, All Servers. Other
server groupings are replication groups or user-defined groups.
You can create a user-defined group by clicking the
Manage Servers link. Add a group name and
then click the button. The
new group is displayed immediately.
Replication groups are automatically discovered by MySQL Enterprise Monitor and in this respect differ from user-defined groups. For more information about replication groups see Section 2.7, “The Replication Tab”. However, like user-defined groups you can edit the name of a replication group and add other servers to it.
To add to a group, select the add to group
link. Choose the server or servers you wish to add and then
complete the operation by choosing the button. You can add a server to a group even
if the agent is down.
To remove a server from a group expand the server group tree and
click the remove from group link. To delete a
server altogether see
Section 2.8.3.3, “Removing a Server From the Dashboard”.
Slaves removed from a replication group are rediscovered and re-added to that group.
To delete an group, you can use the Delete Group link. This deletes the group and removes the servers from the deleted group.
You cannot delete automatically created groups, such as those built during replication discovery, unless the group is empty. If the group is not empty, you get a error.
There are three ways to modify an existing group; by renaming
it, adding to it, or removing it. Select the
rename link to change the name of a group and
add to group to add servers. Deleting a group
simply requires clicking the remove all from
group link. This removes the server group but has no
effect on individual servers.
If you no longer wish to monitor a MySQL server you can remove it from the Dashboard. There is no provision for deleting an active server from the Dashboard—to remove a server you must make it inactive by stopping the agent.
For instructions on stopping an agent see:
Once the agent is stopped you may delete the monitored server. Deleting a server simply means that it no longer shows up in the Dashboard.
You can remove one or multiple servers at the same time. To remove a server or servers, click the checkbox next to each server that you want to delete, then click the button. You are asked to confirm the deletion of the servers: click to delete the servers, or to cancel the delete operation.
You may remove a server from any group at any time. Removing the last server from a group also removes that group.
The Manage Users panel lets you create, delete and manage individual users that have access to MySQL Enterprise Service Manager
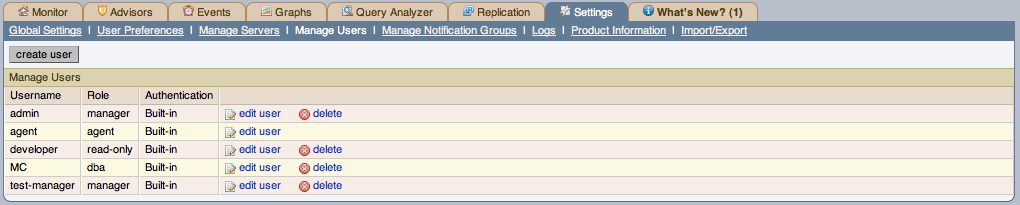
To log in to the Dashboard a user account is required. There are four types of users with varying privileges:
manager role
A user with the role of
managercan perform all operations within MySQL Enterprise Service Manager, including changing the server configuration, adding and removing users, and viewing query analyzer and other data.dba role
Users with the
dbarole should be database administrators who are using MySQL Enterprise Monitor to monitor servers and queries. They have a similar set of privileges to those with themanager, except that they cannot do the following:Cannot add/remove or change users
Cannot change the MySQL Enterprise credentials used to communicate with the MySQL Enterprise website.
Cannot change the HTTP proxy settings.
Cannot update the Advisor bundle
Cannot change the LDAP authentication preferences.
In addition to these limitations, you can control for each user with the dba role whether:
View Query Analyzer tab: Limits whether the user can see the Query Analyzer tab and its contents.
View action (example) queries: Limits whether the user can see the values within queries shown within the query analyzer.
The setting for these abilities is provided when you select the
dbarole for a user.read-only
The
read-onlyrole is identical to thedbarole, but is unable to make any changes to the configuration of MySQL Enterprise Monitor, although they can view the current settings.agent
The
agentrole is reserved for all users that you want to have access and ability to send agent information. You can use this if you want to provide individual logins for each agent.
When the Dashboard is first launched there are two default users,
Administrator and Agent,
both created during installation. Their default user names are
respectively, admin and
agent. The Administrator defined during
installation as having the root role is unique; this user cannot
be deleted.
If you are logged in as an Administrator, you
can add a new user by choosing the Manage Users
link from the Settings tab. To create a user
click the button, select a role
for the user, and enter a user name and password.
When a new user first logs in, a dialog box opens requesting time zone and locale information. This information may be changed later from the User Preferences tab. For more information, see Section 2.8.2, “User Preferences”.
If you installed the Advisors through the Dashboard you should have already configured the settings for the root role user. (See Section 2.8.1, “Global Settings” and following for more information about this topic.)
To receive MySQL Enterprise and Advisor updates configure the MySQL Enterprise settings for at least one user. The MySQL Enterprise settings were set up on the first login to the Dashboard. For information on changing these settings see, Section 2.8.1, “Global Settings”.
To edit an existing user's information, select the Manage
Users link, then select the user you wish to edit. Make
your desired changes in the fields provided and then save your
changes.
Users can be authenticated either using an internal authentication system, which stores the user, password and role information within MySQL Enterprise Monitor, or you can opt to use an external LDAP service. To use the LDAP service, you must still create each user, and then select the Authenticate this user using LDAP checkbox within the Edit User window. The username entered is authenticated against the configured LDAP server. For more information on configuring the LDAP server to be used, see LDAP Authentication.
To delete an existing user, click the delete
link next to the user that you want to delete.
The Manage Notification Groups panels lets you create and manage the notification groups used when different notifications and warnings are distributed.
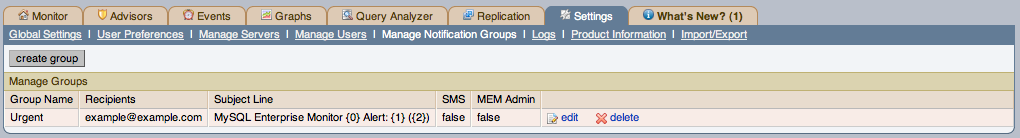
Notification groups are collections of users who should be notified when advisor alerts occur. These users may have login credentials for the Dashboard but this is not a requirement.
You can create a group by clicking the create
group link. Specify a group name and add recipients.
When adding a user an email address must be specified. If you are
adding multiple users separate them with commas.
To modify an existing notification group, select the
edit link next to the group name. Deleting a
group simply requires clicking the delete link.
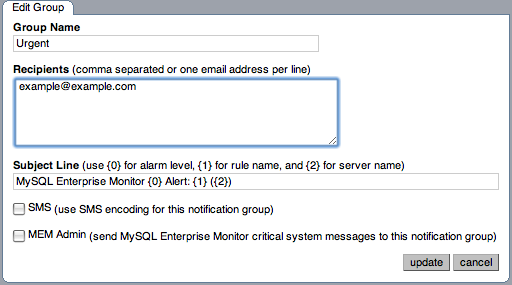
If a rule triggers an alarm, an email is sent to the members of the notification group specified when the rule was scheduled. For more information about scheduling rules see Section 2.3.2, “Scheduling Rules”.
You can set the subject line of the email that is sent by editing
the Subject Line field. You can insert the
alarm level using the string {0}, the rule name
that was triggered using {1}, and the server
name that triggered it using {2}.
You can optionally set the emails that are generated when the notification occurs to be limited to the size of an SMS message. You can then use a notification group email address that forwards to an SMS service so that you can get notification on your phone with an SMS service. Selecting the checkbox next to SMS only changes the length and format of the message that is sent to be compatible with the SMS size limits.
You can also optionally select a notification group to be used when sending critical error messages (such as MySQL Enterprise Agent or MySQL Enterprise Service Manager failures) by selecting the checkbox next to MEM Admin.
You should ensure that there is a mail server available for sending out alerts and that there is an account configured for receiving any alerts that are created. For SMS messages, you must configure an email address with a third-party service that forwards the notification emails to an SMS number. SMS sending functionality is not provided in MySQL Enterprise Service Manager.
Use the Logs link to inspect the various log
files associated with the MySQL Enterprise Service Manager. The following image is
an example of this screen.
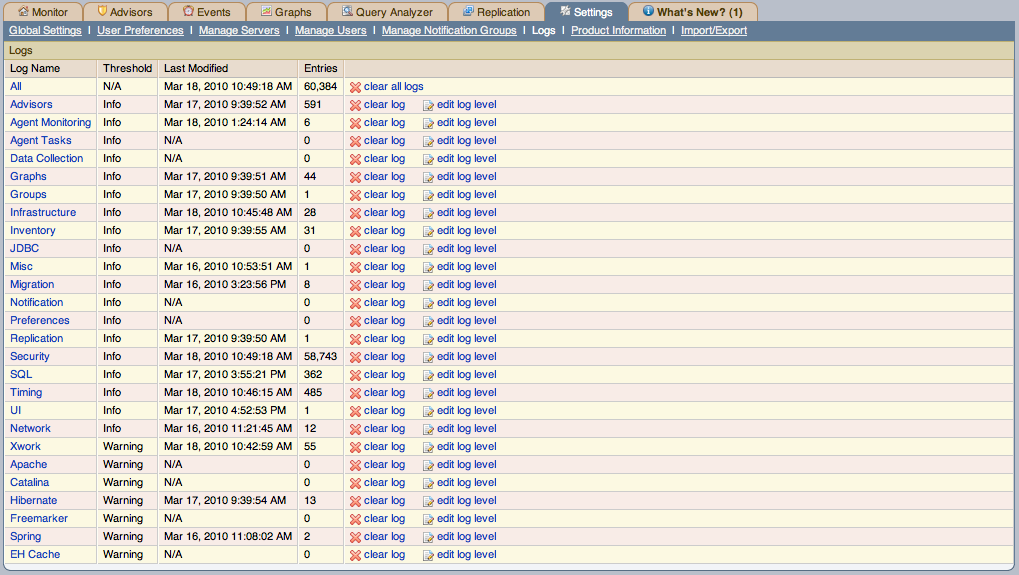
The various categories of logs are shown in alphabetic order. The most recent changes to each log are shown in the Last Modified column. The number of entries in any specific log is shown under the Entries column.
To view detailed information click the Log
Name. This opens a separate browser window showing the
date, time, alert type, and accompanying message.
On this screen you can filter log information in a couple of ways; by the message type and by time period .
To filter by message type select from the options in the level drop-down box. These are, in order of decreasing severity:
All
Error
Warning
Information
Trace
Debug
You can also adjust the number of items that appear on each page.
Press the clear all logs link to remove all log
entries. To remove entries of a specific kind click the
clear logs link associated with the specific
log. A confirmation dialog box lets you back out of this operation
and avoid accidentally removing log information.
To clear log files of a specific age see the Data Purge
Behavior section of the Global
Preferences page. For more information on this topic see
Data Purge Behavior.
Use the edit log level link to change the type
of error logged. The value selected from the Edit Log
Level dialog box determines what appears under the
Threshold column (second from the left in
Data Purge Behavior).
Selecting Error from the list box creates the
least number of log entries and Debug the most.
Choosing None turns off logging altogether.
It is also possible to download a compressed version of all the log files. For more information, see Section 2.8.7, “Product Information”.
Use the Product Information link to view
detailed information about your subscription level and contract
status.
Subscription Warnings
The Subscription Warnings section contains information unique to your subscription. Information provided here relates to your subscription settings and the servers currently being monitored. For more information, see Section 2.8.7.1, “Subscription Warning”.
Contract Status
The Contract Status section displays the subscription level, expiration date, contract number, the number of servers supported, and your MySQL Enterprise user name. The Subscription Level section gives more detailed information, including features and any restrictions that may apply. You may update your subscription at any time by clicking the button.
Subscription Information
The Subscription Information section contains detailed information about your subscription level and the number of hosts currently monitored within your subscription level.
Enterprise Dashboard Server Info
The Enterprise Dashboard Server Info section provides detailed information about the running of your MySQL Enterprise Service Manager, including information about the Java environment, hostname and version information.
The section also includes detailed information about the current status of your MySQL Enterprise Service Manager, showing information on the agents, rules, and outstanding status of the various components. The information provided in this section is listed below:
Pending Heartbeats
Processed Heartbeats
Pending Jobs
Number of Agents
Monitored mysqld Instances
Build Version
Advisor Version
Number of Rules
Number of Graphs
Last Successful Email
Last Email Failure
Last Failure Message
You can monitor the status of the email messages sent by MySQL Enterprise Service Manager by looking at the values of the Last Successful Email and Last Email Failure sections. Any failure by MySQL Enterprise Service Manager to send an email is reported, with the failure date recorded in Last Email Failure. You can examine the Last Failure Message field to determine the precise reason for the failure.
Readme
The Readme section contains a copy of the text
Readmefile provided with each release, and provides release specific information about your MySQL Enterprise Service Manager installation.The Diagnostic Report section includes a hyperlink, Download diagnostic report. The Zip file contains a variety of information and log files which can be used by support to determine and diagnose some problems with your MySQL Enterprise Monitor installation. The file is named according to your license number and the current date/time, for example
support-1234-6578-20100331T1026.zip. The file includes, but is not limited to, the following items:Replication 1.dot: The calculated MySQL server replication structure.catalina.out: The Tomcat log file.java-threads.dot: A list of the current Java threads and the dependencies.java.props: The current Java configuration properties.java.threads: A list of the current Java threads and their backtrace.mysql-monitor.log: The MySQL log file.preferences.properties: The MySQL Enterprise Monitor preferences.query.instanceOverview.html: An HTML list of the current query analyzer data.root.csv: A copy of your main MySQL Enterprise Monitor log file.server.props: A copy of your server properties.subscription.xml: Details of your subscription information.
This report is especially useful for debugging the MySQL Enterprise Service Manager and the MySQL Enterprise Agent.
When you select the report, a new page opens showing the report generation status. A message is provided once the generation has completed.
The Subscriptions Warning section on the
product information page displays any warnings relative to your
subscription. For example, if your subscription has expired you
may receive a message such as the following:
Your Subscription Needs to be Updated

* Your Platinum subscription expired 3 days ago on Feb 14, 2008 11:59:59 PM.

If the subscription information on this page is not current, you can
update it by going to the Enterprise Monitor Global Settings page and
providing MySQL Enterprise credentials or by importing a new product
key that you downloaded from http://www.mysql.com/enterprise/download.php.

To update or renew your subscription, please contact your MySQL
Account Representative at sales@mysql.com or visit
http://www.mysql.com/about/contact/renew.html.  After the update or
renewal is complete you can then follow the above instructions for
updating your subscription.
Follow these instructions to update your subscription. If you see this message and your subscription has already been updated, simply click the button in the Contract Status section of this page. This should update your subscription and remove the warning.
After updating your subscription remember to also update your advisors. For instructions on doing this see Section 2.3.1, “Installing and Updating Advisors”.
The Import/Export system lets you export or delete custom rules and graphs that have been imported into the system so that you can transfer them to another MySQL Enterprise Dashboard instance. You can also use this screen to import new custom rules and graphs.
To export rules or graphs:
Select the rules or graphs that you want to export. You can select multiple items by selecting the checkbox against each rule or graph.
Click .
The custom rules and graphs are saved using a filename of the form
custom-export-,
where DATE-TIME.jarDATE is the date of export in
international format (YYYYMMDD) and
TIME is the time (HHMM).
To delete rules or graphs:
Select the rules or graphs that you want to export. You can select multiple items by selecting the checkbox against each rule or graph.
Click .
A confirmation dialog asks you to confirm that the rule or graph should be deleted. Data collections and the corresponding rules are unscheduled from all servers on which the rules have been applied. You cannot undo the operation; to re-enable the rules and graphs at a later date, export them first, then delete them so that you can re-import the custom graphs.
To confirm deletion, click . To cancel deletion, click .
You can import custom rules and graphs by using the import
function. You can use an XML file, or a previously exported
jar file.
To import custom rules or graphs:
Click . This presents you with a custom dialog so that you can choose a file on your client computer to be uploaded to the MySQL Enterprise Dashboard. Locate the file, and click .
Click .
A notification window appears indicating the number of graphs and rules imported.
For more information on writing new rules, custom data items, and creating new graphs, see Chapter 4, Customizing MySQL Enterprise Monitor.
The What's New Page provides a simplified interface for providing updates and news related to your MySQL Enterprise Subscription. By default, the information is automatically updated every hour. To disable the updates, or force an update, see Section 2.9.1, “Setting What's New Configuration”.
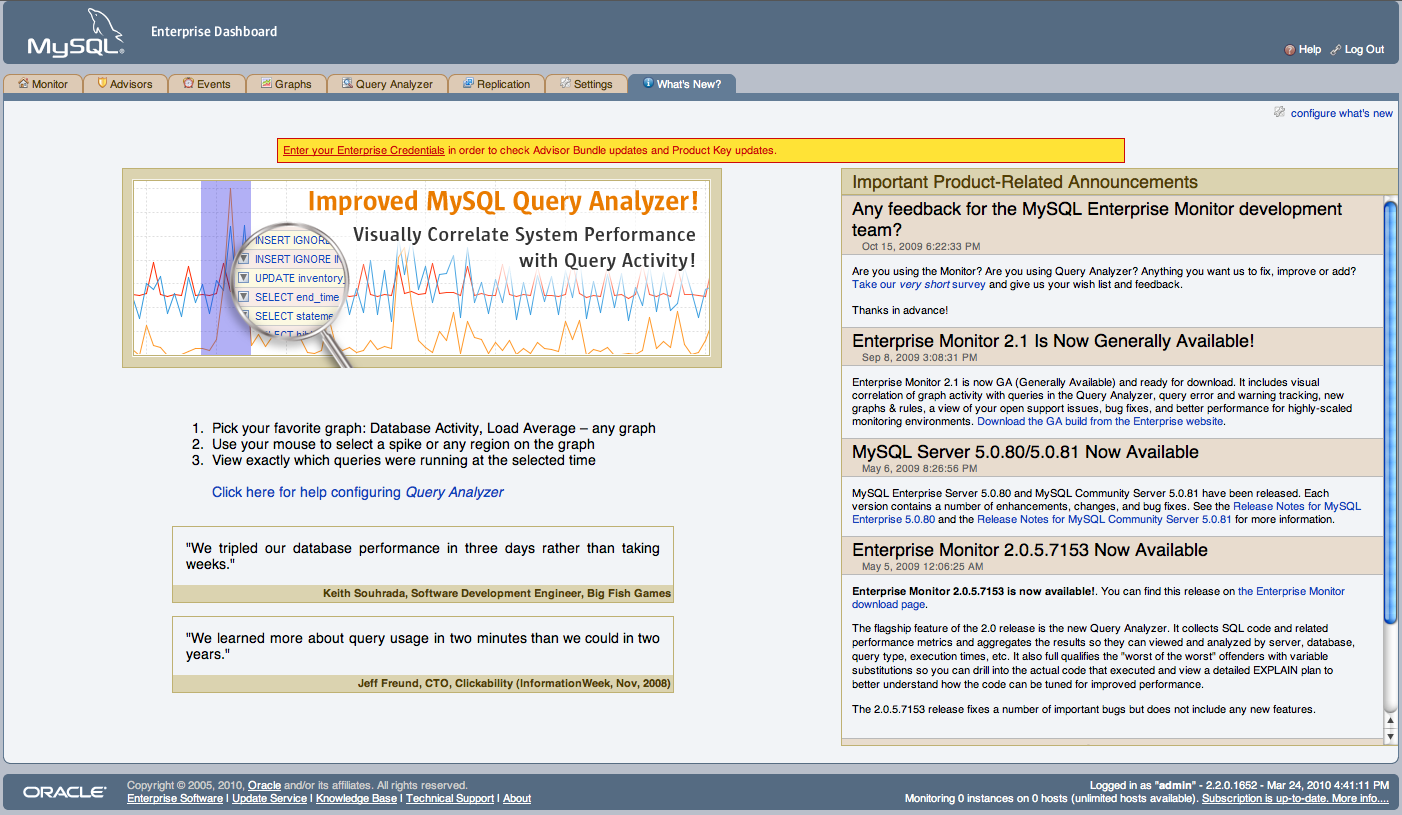
The What's New tab is divided into three main sections:
The area on the left-hand side of the page is used to provide information about the major new features and functionality in MySQL Enterprise Monitor.
Open Support Issues provides a quick interface to the list of currently open issues with MySQL Support as identified through the MySQL Enterprise and Support websites. Issues that are currently marked in the system as Waiting On Customer are also added to the main MySQL Enterprise Dashboard above the Heat Chart.
To use the Open Support Issues functionality, you must have set your MySQL Enterprise credentials within MySQL Enterprise Dashboard. For more information, see Section 2.8.1, “Global Settings”.
Important Product Release Announcements provides a list of news items from the news feed provided on the MySQL Enterprise website. The news feed will contain important information, including, but not limited to:
New releases of MySQL Products, including MySQL Server and MySQL Enterprise Monitor.
End-of-life and support changes.
Urgent errors and notifications.
When items are new (unread), they will be indicated with a star icon. Unread items on the What's New page will also be notified with a number in the tab title within the main Dashboard. Items are automatically marked as read when you visit the What's New page.
The announcements information is made available in two ways, using either a connection to the MySQL Enterprise website, when the information will be updated at a set interval, or through information included with the MySQL Enterprise Advisor bundles.
NoteTo use poll the MySQL Enterprise site directly your MySQL Enterprise Service Manager must have access to the MySQL Enterprise website. If your MySQL Enterprise Service Manager is not directly connected to the Internet, you can set an HTTP Proxy to be used to access the information. For more information on configuring an HTTP Proxy, see Section 2.8.1, “Global Settings”.
You can disable the display of your open Support issues and product notifications by using the link on the What's New tab. For more information, see Section 2.9.1, “Setting What's New Configuration”.
You can configure the operation and forcibly update the information on the What's New page by clicking the button at the top-right of the What's New page.
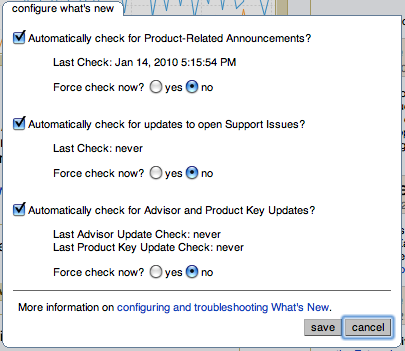
The configurable options are:
Automatically check for New Announcements?
To disable the New Announcements updates, deselect the checkbox. Updates are enabled by default.
The last time an update of the New Announcements information was successfully executed is displayed below the title.
You can force an update of the New Announcements information by selecting the radio button next to Force check now?. A check will be executed when you click the button to close the configuration dialog.
Automatically check to Support Issues?
To disable the Support Issues updates, deselect the checkbox. Updates are enabled by default.
The last time an update of the Support Issues information was successfully executed is displayed below the title.
You can force an update of the Support Issues information by selecting the radio button next to Force check now?. A check will be executed when you click the button to close the configuration dialog.
Automatically check for Advisor and Product Key Updates?
The MySQL Enterprise Service Manager can automatically look for changes to your MySQL Enterprise Advisor and product key information by polling the MySQL Enterprise website.
To disable the Advisor and Product key updates, deselect the checkbox. Updates are enabled by default.
You can force a check for updates to the Advisor and Product key information by selecting the radio button next to Force check now?. A check will be executed when you click the button to close the configuration dialog.
Click to save your settings. If you selected any system to force an update, the update will take place in the background. To cancel your changes, click .