Table of Contents
- B.1. MySQL Enterprise Monitor Limitations
- B.2. Supported Browsers
- B.3. Installation Requirements
- B.4. Configuring Tomcat Parameters
- B.5. Backing up MySQL Enterprise Service Manager
- B.6. Migrating 1.3.x Historical Data to MySQL Enterprise Monitor 2.0
- B.7. Improving Disk Space Usage with Purge in 2.1 and 2.2
- B.8. Regular MySQL Enterprise Monitor Maintenance
- B.9. Advisor/Graph Reference
This appendix contains reference information for MySQL Enterprise Monitor.
The following list provides information on known limitations within MySQL Enterprise Monitor
The maximum size for data stored within the
mysql.inventorytable is 64 bytes.The MySQL Enterprise Agent when operating for Query Analyzer as a proxy cannot handle queries greater than 16MB.
The MySQL Enterprise Agent when operating for Query Analyzer as a proxy does not support clients using the MySQL protocol older than MySQL 5.0.
The MySQL Enterprise Agent when operating for Query Analyzer as a proxy does not support clients affects the authentication of clients. As the proxy is the real client connecting to the backend MySQL server, authentication should use the hostname of the proxy, not the original client.
When viewing the graphs generated by MySQL Enterprise Service Manager, the fonts used for the graphs may not be displayed properly if the required font is missing.
You can specify a custom font by setting a custom property within the embedded MySQL Server to a known working font. To do this, connect to your embedded MySQL sever using the information provided by the
configuration_report.txtfile. Once connected, execute the following statment:mysql> INSERT INTO map_entries VALUES (1,'Helvetica','graph.font');
Replacing
Helveticawith the font you want to use.The font used for graph rendering is selected as follows, in this order:
The user override value.
The MySQL Enterprise Service Manager default of Arial.
The graph engine default of SansSerif.
It is not possible to monitor more than one MySQL Enterprise Dashboard instance hosted on the same machine simultaneously within the same browser, even if each MySQL Enterprise Dashboard uses a different port for access. The effect of this limitation may be more significant on certain browsers.
When monitoring multiple MySQL instances with one MySQL Enterprise Agent, if any of the MySQL instances are down at the point when the agent is started, the agent does not attempt to reconnect to the servers. This could lead to indications that MySQL instances were down when in fact they were running and available. To avoid this problem, ensure all of the monitored instances are available before starting the agent.
The MySQL Enterprise Dashboard is known to work within the following browser environments:
Microsoft Internet Explorer 7.x, 8.x
NoteMySQL Enterprise Dashboard is not compatible with the Compatibility View option within Internet Explorer 8.x. Please make sure this option is disabled before using MySQL Enterprise Dashboard
Safari 3.2, 4.x
Firefox 3.0, 3.5
Google Chrome 4.0
The MySQL Enterprise Dashboard is known not to work within the following browser environments:
Microsoft Internet Explorer 6.x
Opera
Google Chrome
The Service Manager is available for Windows, Mac OS X, and a variety of Unix and Linux operating systems. In most cases, the standard operating system and packages are supported without further libraries and modules. All the required components are installed automatically.
Mac OS X Notes
The Mac OS X Service Manager is only supported on Intel architecture. However, the Mac OS X agent is supported for both Intel and the PowerPC.
Installation requires approximately 450MB of disk space for MySQL Enterprise Service Manager
Windows Notes
Installation requires approximately 260MB of disk space for MySQL Enterprise Service Manager
Unix/Linux Notes
Installation requires approximately 450MB of disk space for MySQL Enterprise Service Manager
On FreeBSD, you must have
bind8installed.
Disk-space usage requirements are approximate for the base application. During usage, the service manager records detailed information about your MySQL servers and environment, and disk space usage increases with time to record this historical data. You can control how long information is stored once the service manager has been installed.
Running MySQL Enterprise Service Manager places a reasonable load on your system, and this load increases linearly as you add more agents monitoring more servers. Ideally, you should use a dedicated machine for MySQL Enterprise Service Manager, rather than running it alongside other applications and services.
Minimum System Requirements
2 or more CPU cores
2 or more GB of RAM
Disk I/O subsystem applicable for a write-intensive database
Recommended System Requirements (if monitoring 100 or more MySQL servers)
4 or more CPU cores
8 or more GB of RAM
Disk I/O subsystem applicable for a write-intensive database (RAID10, RAID 0+1)
The Monitor Agent is available for a wide range of operating systems. For an up-to-date list please see the http://www.mysql.com/products/enterprise/. The agent can be used to monitor any MySQL server from version 4.0.x through 6.0.x.
Production support is not currently available for MySQL Enterprise Monitor (Service Manager component) in virtualized environments.
The parameters for the Tomcat hosting system used to support MySQL Enterprise Service Manager and MySQL Enterprise Dashboard can have an affect on the performance of the system.
The default settings for Java for Tomcat are as follows:
| Initial heap size | -Xms | 768MB |
| Maximum heap size | -Xmx | 768MB |
| Java stack size | -Xss | 128MB |
You can change these parameters to higher values,by editing the
JAVA_OPTS setting within the corresponding
platform script.
On Unix/Linux and Mac OS X
Edit the values within
apache-tomcat/bin/setenv.shfile within your MySQL Enterprise Service Manager directory. You should avoid setting maximum figures higher than the physical memory of your system as this may reduce, rather than increase the performace.If you change these parameters, shut down and restart MySQL Enterprise Service Manager for the changes to take effect.
Windows
Edit the
JAVA_OPTSsettings within theapache-tomcat/bin/setenv.batfile.To enable the changes, you must re-install your service. To do this, shutdown your MySQL Enterprise Service Manager service and then reinstall the service by running:
shell> mysqlmonitorctl.bat uninstall
shell> mysqlmonitorctl.bat install
On all platforms, changes to the JAVA_OPTS
using the above methods should be retained over an upgrade of the
MySQL Enterprise Service Manager service.
If you change these parameters, you must restart MySQL Enterprise Service Manager for the changes to take effect.
If you want to backup the data stored within your MySQL Enterprise Service Manager,
you can use any of the typical backup solutions, such as
mysqldump, to save your data. All you need to
backup the information is host name, user name and password
details that were set during the installation of the
MySQL Enterprise Service Manager
You can locate this information by examining the contents of the
configuration_report.txt file that was
generated when MySQL Enterprise Service Manager was installed. A scample of the
file is provided below:
MySQL Enterprise Monitor (Version 2.0.0.7088 : 20081031_152749_r7088)

Here are the settings you specified:
Application hostname and port: http://127.0.0.1:18080
Tomcat Ports: 18080 - 18443 (SSL)
MySQL Port : 13306

Repository Credentials (bundled MySQL):
---------------------------------------
service_manager/Password

Use the following command to login to the MySQL Enterprise Monitor database:
mysql -uservice_manager -pPassword -P13306 -h127.0.0.1
The last line provides the information about how to connect to the server using the standard mysql command line client.
All the MySQL Enterprise Monitor repository information, including your
configuration, rule and historical data is stored within the
mem database.
To backup this information using mysqldump you
might use the following command:
shell> mysqldump --single-transaction »
-uservice_manager -pPassword -P13306 -h127.0.0.1 mem >mem.dump
The above command would create a file,
mem.dump, containing all of the MySQL Enterprise Monitor
data.
To ensure consistency in a recovery situation, you may also want to backup the agent configuration and metadata stored on each monitored MySQL server. To do this:
Backup the configuration files of each agent. You should keep a copy of the
etcdirectory for each agent. This directory contains the main configuration file,mysql-monitor-agent.ini, and the configuration information for each server being monitored, which is stored within theetc/instancesdirectory.On each server being monitored, retain a copy of the
mysql.inventorytable, which contains the unique ID of the MySQL server.
You can migrate the data generated during a MySQL Enterprise Monitor 1.3.x installation using the Data Migration functionality of the Server Configuration panel.
To use the data migration feature, you must have installed MySQL Enterprise Service Manager using an update installer. The update installer performs the initial migration of your configuration, rules, schedule, and events data. The historical data is not migrated until you explicitly request the migration of information within the Manage Servers section of the Settings panel.
Data migration works on a single server, allowing you to select on which servers you want to migrate information. The migration is subject to the following:
You must elect to migrate the data from each server individually.
Migration takes approximately 5-6 hours, for each month, for each server. Therefore, if you have six months of data on 10 servers it could take between 300 and 360 hours (15 days) to migrate all of your historical data one server at a time.
To limit the data migration, set the Data Purge Behavior within the Settings page. Only data more recent than the specified purge period is migrated. Data older than the purge period is ignored.
To prevent performance issues, migrate only one or a small number of servers concurrently.
You can start and stop the migration of the data at any time. As a general guide, you should avoid stopping the data migration process and allow it to complete unless:
Run out of disk space.
MySQL Enterprise Service Manager becomes too slow and unresponsive.
Migration never completes.
With the last item, where the migration never completes, occasionally there are some aspects of the data that cannot be migrated successfully. This prevents the migration process completing, but does not affect the conversion of any data that could be migrated.
Starting Historical Data Migration
To start data migration:
Switch to the Manage Servers display of the Settings panel within MySQL Enterprise Dashboard.
Ensure that the data migration functionality has been enabled. The and buttons next to Historical Data Migration are visible.
Select the servers you want to migrate by using the checkbox next to each server name. You can select one or more servers to migrate. Servers that are suitable for migration show their migration status within the Migration Status column. If the server cannot be migrated,
N/Ais shown.Click next to Historical Data Migration.
To start the migration, click in the confirmation dialog box. To cancel migration, click .
The servers to migrate show
Queued for
          Migration
in the Migration Status column.

Monitoring Historical Data Migration
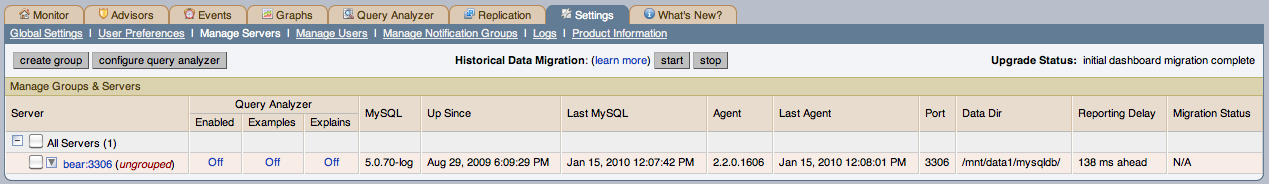
You can check the migration status of any individual server by examining the Migration Status column for each server. You can see an example of the migration status below.

Note that the migration status is shown according to the state of migration at the time the page was loaded. The actual migration continues in the background, and the current state may not match the state of the migration at the time it is viewed.
Servers showing Done in the Migration
Status column have already completed their migration.
You can check the overall migration status by examining the Upgrade Status display.
Stopping Historical Data Migration
You can stop the migration process for any server that is still migrating data. The migration can be restarted at any time without causing any problems.
To stop the historical data migration:
Select the servers you want to stop migrating by using the checkbox next to each server name. You can select one or more servers to stop migrating.
Click next to Historical Data Migration.
You receive confirmation that the migration has been stopped, or a notification if migration has already completed.
Removing Old Data
Once data migration has been completed for all the servers you
want to migrate, you may want to delete or remove access to the
old data within your MySQL Enterprise Monitor repository. Data for MySQL Enterprise Monitor 1.3
was stored in a database called merlin within
the MySQL repository. Data for MySQL Enterprise Monitor 2.0 is stored within a
database called mem.
To create a backup of the old information, use mysqldump:
shell> mysqldump -uservice_manager -pPassword -P13306 -h127.0.0.1 merlin >data-1.3.sql
The above creates a file, data-1.3.sql
containing all of the MySQL Enterprise Monitor 1.3 information.
If you remove access to the old data, then the data migration
options for old servers are removed from the Manage
Servers panel within MySQL Enterprise Service Manager. To remove access,
REVOKE access to the merlin
database:
mysql& REVOKE ALL on merlin.* FROM 'service_manager';
Revoking access to the old data does not reclaim any of the disk space used by the old data.
To delete the data from the database and free up the space being
used by the historical information, DROP the
merlin database:
mysql& DROP DATABASE merlin;
Once all the data has been migrated you can hide the migration user interface by clicking the button.
In MySQL Enterprise Monitor 2.1, the data received by the MySQL Enterprise Service Manager from MySQL Enterprise Agent instances is inserted into tables, with the information within the tables purged periodically to remove the old data, according to the defined purging interval.
In installations with a large volume of data, the purging of old information can take a considerable amount of time, slowing down the MySQL Enterprise Service Manager and using up valuable disk space.
In MySQL Enterprise Monitor 2.2, the tables used for storing this information are changed, and the older tables are used only when viewing historical information. The information within the table is not purged until all of the table data is older than the specified purge period, when the old tables are dropped.
The following instructions are designed to reduce the disk space usage for customers that are either using MySQL Enterprise Monitor 2.1 currently, or that have already upgraded an existing MySQL Enterprise Monitor 2.1 installation to MySQL Enterprise Monitor 2.2. If you have performed a new (not upgrade) installation of MySQL Enterprise Monitor 2.2, these steps are not required.
To reduce the space used by the tables in both 2.1 and 2.2 until the data is finally purged, you should follow these steps:
If you are running MySQL Enterprise Monitor 2.1, upgrade to MySQL Enterprise Monitor 2.2 using an upgrade installer. This migrates the existing table data and prepare you for the next stage.
WarningPerforming a upgrade installation from MySQL Enterprise Monitor 2.1 to MySQL Enterprise Monitor 2.2 requires approximately 150% of your current disk space requirements while the information is migrated. Once the migration is complete, your disk space usage returns to a value slightly higher than within your MySQL Enterprise Monitor 2.1 installation.
Start up your MySQL Enterprise Service Manager and MySQL Enterprise Agent instances.
Connect to the MySQL server being used by your MySQL Enterprise Service Manager. You can find a sample mysql command for connecting to your server within the
configuration_report.txtfile within your MySQL Enterprise Service Manager installation.Once connected to MySQL, change to the
memdatabase:mysql> use mem;Now execute the following
ALTER TABLEstatements to change the original InnoDB tables to use MyISAM:ALTER TABLE dc_ng_double_age0 ENGINE=MYISAM; ALTER TABLE dc_ng_double_age1 ENGINE=MYISAM; ALTER TABLE dc_ng_double_age2 ENGINE=MYISAM; ALTER TABLE dc_ng_double_now ENGINE=MYISAM; ALTER TABLE dc_ng_long_age0 ENGINE=MYISAM; ALTER TABLE dc_ng_long_age1 ENGINE=MYISAM; ALTER TABLE dc_ng_long_age2 ENGINE=MYISAM; ALTER TABLE dc_ng_long_now ENGINE=MYISAM; ALTER TABLE dc_ng_string_now ENGINE=MYISAM;
NotePlease keep in mind the following points when running these statements
Performing this operation should not affect the operation of your MySQL Enterprise Service Manager, since new data is written into different tables.
The time required to perform the conversation depends on the size of your original tables. It may take a considerable amount of time if you have a large volume of old data.
You need slightly more than twice the amount of diskspace currently being used by the tables until the conversion completes.
Once the conversion has completed, you can continue to use your MySQL Enterprise Service Manager without restarting or any further administration. The existing old table data is removed as soon as the data in the old table is older than your selected purging interval. The new MyISAM tables should take up approximately 60% of the space of the InnoDB tables.
MySQL Enterprise Monitor is generally self-managing and does not need much maintenance. To keep your MySQL Enterprise Monitor running efficiently, automate or manually perform these maintenance tasks:
Set the purge interval for your data to an appropriate value according to duration and history of data that you want to keep. For more information, see Data Purge Behavior.
Check, and delete, the contents of the temporary directory with your MySQL Enterprise Service Manager installation directory.
Basic
Advisors
Graphs
Silver
Advisors
CREATE TABLE LIKE Does Not Require Any Privileges On Source Table
Database May Not Be Portable Due To Identifier Case Sensitivity
Excessive Percentage Of Attempted Connections To The Server Have Failed
Improper key_cache_block_size Setting Can Corrupt MyISAM Tables
In-Memory Temporary Table Size Limited By Maximum Heap Table Size
Malformed Password Packet In Connection Protocol Can Crash Server
Next-Key Locking Disabled For InnoDB But Binary Logging Enabled
Non-Authorized User Has DB, Table, Or Index Privileges On All Databases
Row-based Replication Broken For UTF8 CHAR Columns Longer Than 85 Characters
Stored Routine Runs In Definer''s Rather Than Caller''s Security Context
Use Of View Overrides Column Update Privileges On Underlying Table
User Can Gain Privileges By Running Stored Routine Declared Using SQL SECURITY INVOKER
User With Only ALTER Privilege On Partitioned Table Can Obtain SELECT Privilege Information
Graphs
Gold
Advisors
Graphs
Platinum
Advisors
Graphs
Individual Advisor information is show below.
32-Bit Binary Running on 64-Bit AMD Or Intel System
The chip architecture and operating system installed on a machine both impact the performance of software running on the system. While it is possible to run 32-bit software on many 64-bit systems, in general, software built to run on a 64-bit system will run better on such a system than software built to run on a 32-bit system.
Default frequency 06:00:00
Default auto-close enabled no
Account Has An Overly Broad Host Specifier
The MySQL server has user accounts with overly broad host specifiers. A MySQL account is identified by both a username and a hostname, which are found in the User and Host columns of the mysql.user table. The User value is the name that a client must supply when connecting to the server. The Host value indicates the host or hosts from which the user is allowed to connect. If this is a literal hostname, the account is limited to connections only from that host. If the hostname contains the '%' wildcard character, the user can connect from any host that matches the wildcard character and potentially from any host at all.
From a security standpoint, literal host values are best and
%is worst. Accounts that have Host values containing wildcards are more susceptible to attack than accounts with literal host values, because attackers can attempt to connect from a broader range of machines.For example, if an account has user and host values of
rootand%, it means that you can connect as the root user fromanymachine if you know the password. By contrast, if the host name islocalhostor127.0.0.1, the attacker can only attempt to connect as the root user from the server host.Default frequency 00:05:00
Default auto-close enabled no
A MySQL server may have user accounts with privileges on all databases and tables (*.*). In most cases global privileges should be allowed only for the MySQL root user, and possibly for users that you trust or use for backup purposes. Global privileges such as
DROP, ALTER, DELETE, UPDATE, INSERT,andLOCK TABLESmay be dangerous as they may cause other users to be affected adversely.Default frequency 00:05:00
Default auto-close enabled no
Account Has Old Insecure Password Hash
Prior to MySQL 4.1, password hashes computed by the PASSWORD() function were 16 bytes long. As of MySQL 4.1 (and later), PASSWORD() was modified to produce a longer 41-byte hash value to provide enhanced security.
Default frequency 06:00:00
Default auto-close enabled no
Account Has Strong MySQL Privileges
Certain account privileges can be dangerous and should only be granted to trusted users when necessary. For example, the FILE privilege allows a user to read and write files on the database server (which includes sensitive operating system files), the PROCESS privilege allows currently executing statements to be monitored, and the SHUTDOWN privilege allows a user to shut down the server. In addition, the GRANT privilege allows a user to grant privileges to others.
Default frequency 00:05:00
Default auto-close enabled no
Agent Host Time Out of Sync Relative to Dashboard
To maintain data consistency and to facilitate day-to-day system management operations, which often require comparing logs, files, and timestamps across servers, it is important that the server clocks across all your systems and data centers be synchronized with respect to each other relative to UTC time (which takes timezones into account). When the clock on one server is minutes or hours behind another server, any timestamps created in the databases or on the file systems of those two servers will differ by that amount. Thus if you depend on timestamps to test the freshness of some data item, or if you are trying to diagnose a problem and need to compare timestamps across systems, your task will be more complicated due to this time difference.
In addition, the data and graphs shown in the MySQL Enterprise Monitor Dashboard will be skewed by the difference in time between the machine hosting the Service Manager and the machines running the Agents. For example, if the time on an Agent machine is one hour behind the time on the Service Manager machine, the MySQL server that Agent is monitoring will appear to be down (see Bug#45937) and no data will appear in the graphs for that server for the first hour after the Agent is started.
Default frequency 00:05:00
Default auto-close enabled yes
Attempted Connections To The Server Have Failed
Aborted connection attempts to MySQL may indicate an issue with respect to the server or network, or could be indicative of DoS or password-cracking attempts against the MySQL Server. The aborted-connects count is incremented when:
A client does not have privileges to access a database
A client uses the wrong password
A malformed packet is received
The connect_timeout variable is exceeded
Default frequency 00:05:00
Default auto-close enabled no
AUTO_INCREMENT Field Limit Nearly Reached
Many applications need to generate unique numbers and sequences for identification purposes (e.g. customer IDs, bug or trouble ticket tags, membership or order numbers, etc). MySQL's mechanism for doing this is the AUTO_INCREMENT column attribute, which enables you to generate sequential numbers automatically.
However, the range of numbers that can be generated is limited by the underlying data type. For example, the maximum value possible for a TINYINT UNSIGNED column is 255. If you try to generate a number that exceeds the maximum allowed by the underlying data type (e.g. by inserting a NULL value into the AUTO_INCREMENT column), you will trigger database errors and your application may not behave properly.
Note that the primary purpose of AUTO_INCREMENT in MySQL is to generate a sequence of
positiveintegers. The use of non-positive numbers in an AUTO_INCREMENT column is unsupported, so you may as well define those columns to be UNSIGNED, which effectively doubles their allowable range.Default frequency 06:00:00
Default auto-close enabled no
Binary Log File Count Exceeds Specified Limit
The binary log captures DML, DDL, and security changes that occur and stores these changes in a binary format. The binary log enables replication as well as point-in-time recovery, preventing data loss during a disaster recovery situation. It also enables you to review all alterations made to your database. However, binary logs consume disk space and file system resources, and can be removed from a production server after they are no longer needed by the slaves connecting to this master server, and after they have been backed up.
Default frequency 06:00:00
Default auto-close enabled no
Binary Log Space Exceeds Specified Limit
The binary log captures DML, DDL, and security changes that occur and stores these changes in a binary format. The binary log enables replication as well as point-in-time recovery, preventing data loss during a disaster recovery situation. It also enables you to review all alterations made to your database. However, binary logs consume disk space and can be removed from a production server after they are no longer needed by the slaves connecting to this master server, and after they have been backed up.
Default frequency 06:00:00
Default auto-close enabled no
Binary Log Usage Exceeding Disk Cache Memory Limits
When binary log usage exceeds the binary log cache memory limits, it is performing excessive disk operations. For optimal performance, transactions that move through the binary log should be contained within the binary log cache.
Default frequency 00:05:00
Default auto-close enabled no
The binary log captures DML, DDL, and security changes that occur and stores these changes in a binary format. The binary log enables point-in-time recovery, preventing data loss during a disaster recovery situation. It also enables you to review all alterations made to your database.
Binary logging can be limited to specific databases with the
--binlog-do-dband the--binlog-ignore-dboptions. However, if these options are used, your point-in-time recovery options are limited accordingly, along with your ability to review alterations made to your system.Default frequency 06:00:00
Default auto-close enabled no
The binary log captures DML, DDL, and security changes that occur and stores these changes in a binary format. The binary log enables point-in-time recovery, preventing data loss during a disaster recovery situation. It also enables you to review all alterations made to your database.
Default frequency 06:00:00
Default auto-close enabled no
Binary Logging Not Synchronized To Disk At Each Write
By default, the binary log is not synchronized to disk at each write. If the server host, operating system, or MySQL server crash, there is a chance that the latest statements in the binary log are not written to disk. To prevent this, you can cause the binary log to be synchronized to disk after every Nth binary log entry using the
sync_binlogglobal variable. 1 is the safest value, but also the slowest.Default frequency 06:00:00
Default auto-close enabled no
Binary Logs Automatically Removed Too Quickly
The binary log captures DML, DDL, and security changes that occur and stores these changes in a binary format. The binary log enables point-in-time recovery, preventing data loss during a disaster recovery situation. It is used on master replication servers as a record of the statements to be sent to slave servers. It also enables you to review all alterations made to your database.
However, the number of log files and the space they use can grow rapidly, especially on a busy server, so it is important to remove these files on a regular basis when they are no longer needed, as long as appropriate backups have been made. The
expire_logs_daysparameter enables automatic binary log removal.Default frequency 12:00:00
Default auto-close enabled no
Once the maximum connection limit for the MySQL server has been reached, no other user connections can be established and errors occur on the client side of the application.
Default frequency 00:01:00
Default auto-close enabled no
CPU I/O usage should be low on a properly configured and well-tuned system. Excessive CPU I/O usage is often indicative of poor disk or network performance.
Default frequency 00:01:00
Default auto-close enabled no
CPU usage should be low-to-moderate on a properly configured and well-tuned system. Excessive CPU usage can be indicative of many problems: insufficient RAM, fragmented disks, poorly-tuned queries, etc.
Default frequency 00:01:00
Default auto-close enabled no
CREATE TABLE LIKE Does Not Require Any Privileges On Source Table
Due to Bug#25578, a user who does not have any access to a database can still clone the structure of tables in that database. Knowing the structure of tables in a database may give a determined hacker insight that allows him or her to proceed with other exploits.
This bug has been fixed in later versions of the MySQL server.
Default frequency 06:00:00
Default auto-close enabled no
Data Flushed To Disk After Each SQL Statement
MySQL updates its data files on disk with the write() system call after every SQL statement and lets the operating system handle the synchronizing to disk. You can force MySQL to flush everything to disk after every SQL statement with the
--flushoption, however, this will have an adverse effect on performance.Default frequency 06:00:00
Default auto-close enabled no
Database May Not Be Portable Due To Identifier Case Sensitivity
The case sensitivity of the underlying operating system determines the case sensitivity of database and table names. If you are using MySQL on only one platform, you don't normally have to worry about this. However, depending on how you have configured your server you may encounter difficulties if you want to transfer tables between platforms that differ in filesystem case sensitivity.
Default frequency 06:00:00
Default auto-close enabled no
Date-Handling Bugs Can Crash The Server
Two bugs related to date-handling operations can crash the server leading to potential Denial of Service (DoS) attacks:
Default frequency 06:00:00
Default auto-close enabled no
Default Value Being Used For max_prepared_stmt_count
Prepared statements may increase performance in applications that execute similar statements more than once, primarily because the query is parsed only once. Prepared statements can also reduce network traffic because it is only necessary to send the data for the parameters for each execution rather than the whole statement.
However, prepared statements consume memory in the MySQL server until they are closed, so it is important to use them properly and to limit the number of statements that can be open at any one time. The default value for max_prepared_stmt_count may not be appropriate for your application and environment.
Default frequency 06:00:00
Default auto-close enabled no
Disabling Next-Key Locking In InnoDB Can Crash The Server
Due to several bugs, the server could crash if next-key locking in InnoDB was disabled.
These bugs have been fixed in later versions of the MySQL server.
Default frequency 06:00:00
Default auto-close enabled no
The Event Scheduler is a very useful feature when enabled. It is a framework for executing SQL commands at specific times or at regular intervals. Conceptually, it is similar to the idea of the Unix crontab (also known as a "cron job") or the Windows Task Scheduler.
The basics of its architecture are simple. An event is a stored routine with a starting date and time, and a recurring tag. Once defined and activated, it will run when requested. Unlike triggers, events are not linked to specific table operations, but to dates and times. Using the event scheduler, the database administrator can perform recurring events with minimal hassle. Common uses are the cleanup of obsolete data, the creation of summary tables for statistics, and monitoring of server performance and usage.
Default frequency 00:05:00
Default auto-close enabled no
Excessive Disk Temporary Table Usage Detected
If the space required to build a temporary table exceeds either
tmp_table_sizeormax_heap_table_size, MySQL creates a disk-based table in the server's tmpdir directory. Also, tables that have TEXT or BLOB columns are automatically placed on disk.For performance reasons it is ideal to have most temporary tables created in memory, leaving exceedingly large temporary tables to be created on disk.
Default frequency 00:05:00
Default auto-close enabled no
Excessive Number of Locked Processes
Depending on the circumstances, storage engines, and other factors, one process may be using or accessing a resource (e.g. a table or row) required by another process in such a way that the second process cannot proceed until the first process releases the resource. In this case the second process is in a "locked" state until the resource is released. If many processes are in a locked state it may be a sign of serious trouble related to resource contention, or a long running session that is not releasing currently held locks when it should have.
Default frequency 00:01:00
Default auto-close enabled no
Excessive Number of Long Running Processes
Most applications and databases are designed to execute queries very quickly. If many queries are taking a long time to execute (e.g. more than a few seconds) it can be a sign of trouble. In such cases queries may need to be tuned or rewritten, or indexes added to improve performance. In other cases the database schema may have to be redesigned.
Default frequency 00:01:00
Default auto-close enabled no
Excessive Number of Long Running Processes Locked
Most applications and databases are designed to execute queries very quickly, and to avoid resource contention where one query is waiting for another to release a lock on some shared resource. If many queries are locked and taking a long time to execute (e.g. more than a few seconds), it can be a sign of performance trouble and resource contention. In such cases queries may need to be tuned or rewritten, or indexes added to improve performance. In other cases the database schema may have to be redesigned.
Default frequency 00:01:00
Default auto-close enabled no
Excessive Percentage Of Attempted Connections To The Server Have Failed
Excess aborted connection attempts to MySQL may indicate an issue with respect to the server or network, or could be indicative of DoS or password-cracking attempts against the MySQL Server. The aborted-connects count is incremented when:
A client does not have privileges to access a database
A client uses the wrong password
A malformed packet is received
The connect_timeout variable is exceeded
Default frequency 00:05:00
Default auto-close enabled no
Flush Time Set To Non-Zero Value
If
flush_timeis set to a non-zero value, all tables are closed every flush_time seconds to free up resources and synchronize unflushed data to disk. If your system is unreliable and tends to lock up or restart often, forcing out table changes this way degrades performance but can reduce the chance of table corruption or data loss. We recommend that this option be used only on Windows, or on systems with minimal resources.Default frequency 06:00:00
Default auto-close enabled no
The general query log is a general record of what mysqld is doing. The server writes information to this log when clients connect or disconnect, and it logs each SQL statement received from clients. The general query log can be very useful when you suspect an error in a client and want to know exactly what the client sent to mysqld.
However, the general query log should not be enabled in production environments because:
It adds overhead to the server;
It logs statements in the order they were received, not the order they were executed, so it is not reliable for backup/recovery;
It grows fast and can use a lot of disk space;
You cannot stop logging to the general query log without stopping the server (for versions previous to 5.1).
You should use the binary log instead.
Default frequency 06:00:00
Default auto-close enabled no
Improper key_cache_block_size Setting Can Corrupt MyISAM Tables
The server deducts some bytes from the key_cache_block_size option value and reduces it to the next lower 512 byte boundary. The resulting block size is not a power of two. Setting the key_cache_block_size system variable to a value that is not a power of two results in MyISAM table corruption.
This bug has been fixed in later versions of the MySQL server.
Default frequency 06:00:00
Default auto-close enabled no
In-Memory Temporary Table Size Limited By Maximum Heap Table Size
If the space required to build a temporary table exceeds either
tmp_table_sizeormax_heap_table_size, MySQL creates a disk-based table in the server's tmpdir directory. For performance reasons it is ideal to have most temporary tables created in memory, leaving exceedingly large temporary tables to be created on disk. Many DBAs configuretmp_table_sizeappropriately, but forget thatmax_heap_table_sizealso plays a role.Default frequency 06:00:00
Default auto-close enabled no
Incorrect InnoDB Flush Method On Windows
If
innodb_file_per_tableis enabled andinnodb_flush_methodis not set tounbufferedon Windows, MySQL may not start and you may see operating system error code 87.Default frequency 06:00:00
Default auto-close enabled no
Indexes Not Being Used Efficiently
The target server does not appear to be using indexes efficiently. The values of Handler_read_rnd_next and Handler_read_rnd together - which reflect the number of rows read via full table scans - are high compared to the Handler variables which denote index accesses - such as Handler_read_key, Handler_read_next etc. You should examine your tables and queries for proper use of indexes.
Default frequency 00:05:00
Default auto-close enabled no
InnoDB Buffer Cache Has Sub-Optimal Hit Rate
Logical I/O is many times faster than physical I/O, and therefore a DBA should strive to keep physical I/O to a minimum. It is true that logical I/O is not free, and that the DBA should work to keep
allI/O to a minimum, but it is best if most data access is performed in memory. When using InnoDB, most data access should occur in RAM, and therefore the InnoDB buffer cache hit rate should be high.Default frequency 00:05:00
Default auto-close enabled no
InnoDB Buffer Pool Writes May Be Performance Bottleneck
For optimal performance, InnoDB should not have to wait before writing pages into the InnoDB buffer pool.
Default frequency 00:05:00
Default auto-close enabled no
InnoDB Doublewrite Buffer Enabled
InnoDB uses a novel file flush technique called doublewrite. It adds safety to recovery following an operating system crash or a power outage, and improves performance on most varieties of Unix by reducing the need for fsync() operations.
Doublewrite means that before writing pages to a data file, InnoDB first writes them to a contiguous tablespace area called the doublewrite buffer. Only after the write and the flush to the doublewrite buffer has completed does InnoDB write the pages to their proper positions in the data file. If the operating system crashes in the middle of a page write, during recovery InnoDB can find a good copy of the page from the doublewrite buffer.
Default frequency 06:00:00
Default auto-close enabled no
Once you use the InnoDB Plugin on a set of database files, care must be taken to avoid crashes and corruptions when using those files with an earlier version of InnoDB, as might happen by opening the database with MySQL when the plugin is not installed. It is
stronglyrecommended that you use a "slow shutdown" (SET GLOBAL innodb_fast_shutdown=0) when stopping the MySQL server when the InnoDB Plugin is enabled. This will ensure log files and other system information written by the plugin will not cause problems when using a prior version of InnoDB.The reason "slow" shutdown (innodb_fast_shutdown=0) is recommended is because the InnoDB Plugin may write special records to the transaction undo log that will cause problems if the built-in InnoDB in MySQL attempts to read the log. Specifically, these special records will be written when a record in a COMPRESSED or DYNAMIC table is updated or deleted and the record contains columns stored off-page. The built-in InnoDB in MySQL cannot read these undo log records. Furthermore, the built-in InnoDB in MySQL will fail to roll back incomplete transactions that affect tables that it is unable to read (tables in COMPRESSED or DYNAMIC format).
Also note that a "normal" shutdown will not necessarily empty the undo log. A normal shutdown occurs when innodb_fast_shutdown=1, the default. When InnoDB is shut down, some active transactions may have uncommitted modifications, or they may be holding a read view that prevents the purging of some version information from the undo log. The next time InnoDB is started after a normal shutdown (innodb_fast_shutdown=1), it will roll back any incomplete transactions and purge old version information. Therefore, it is important to perform a "slow" shutdown (innodb_fast_shutdown=0) as part of the downgrade process.
Default frequency 12:00:00
Default auto-close enabled no
InnoDB File Format Check Disabled Or Incorrect
To prevent possible crashes or data corruptions when the InnoDB Plugin opens an ib-file set, it will check that it can fully support the file formats in use within the ib-file set. If the system is restarted following a crash, or a "fast shutdown" (i.e., innodb_fast_shutdown is greater than zero), there may be on-disk data structures (such as redo or undo entries, or doublewrite pages) that are in a "too-new" format for the current software. During the recovery process, serious damage can be done to your data files if these data structures are accessed. The startup check of the file format occurs before any recovery process begins, thereby preventing the problems described in the "Possible Problems" section of the InnoDB Plugin documentation.
Setting innodb_file_format_check to OFF, or to a different format than the one in use, is very dangerous, as it permits the recovery process to run, possibly corrupting your database if the previous shutdown was a crash or "fast shutdown". You should only set innodb_file_format_check in this manner if you are sure that the previous shutdown was done with innodb_fast_shutdown=0, so that essentially no recovery process will occur.
Default frequency 12:00:00
Default auto-close enabled no
InnoDB Flush Method May Not Be Optimal
Different values for
innodb_flush_methodcan have a marked effect on InnoDB performance. In some versions of GNU/Linux and Unix, flushing files to disk by invoking fsync() (which InnoDB uses by default) or other similar methods, can be surprisingly slow. If you are dissatisfied with database write performance, you might try setting the innodb_flush_method parameter to O_DIRECT or O_DSYNC.Default frequency 06:00:00
Default auto-close enabled no
InnoDB INFORMATION_SCHEMA Plugins Missing
Several INFORMATION_SCHEMA tables -- INNODB_CMP, INNODB_CMPMEM, INNODB_TRX, INNODB_LOCKS, and INNODB_LOCK_WAITS -- contain live information about compressed InnoDB tables, the compressed InnoDB buffer pool, all transactions currently executing inside InnoDB, the locks that transactions hold and those that are blocking transactions waiting for access to a resource (a table or row). These tables are very useful for monitoring the activity and performance of the InnoDB Plugin storage engine.
However, these INFORMATION_SCHEMA tables are themselves plugins to the MySQL server. As such, they need to be INSTALLed as described in the InnoDB Plugin User's Guide. If they are not installed, you will not be able to use them to monitor the InnoDB storage engine.
Default frequency 12:00:00
Default auto-close enabled no
InnoDB Log Buffer Flushed To Disk After Each Transaction
By default, InnoDB's log buffer is written out to the log file at each transaction commit and a flush-to-disk operation is performed on the log file, which enforces ACID compliance. In the event of a crash, if you can afford to lose a second's worth of transactions, you can achieve better performance by setting
innodb_flush_log_at_trx_committo either 0 or 2. If you set the value to 2, then only an operating system crash or a power outage can erase the last second of transactions. This can be very useful on slave servers, where the loss of a second's worth of data can be recovered from the master server if needed.Default frequency 06:00:00
Default auto-close enabled no
InnoDB Log Waits May Be Performance Bottleneck
For optimal performance, InnoDB should not have to wait before writing DML activity to the InnoDB log buffer.
Default frequency 00:05:00
Default auto-close enabled no
InnoDB Not Using Newest File Format
The InnoDB Plugin has two new features that can be very useful -- compressed tables and long variable-length columns stored off-page. Under the right circumstances, both of these features can improve the performance of your system. However, in order to take advantage of these new features you must configure InnoDB to use the new file format that enables them.
Default frequency 12:00:00
Default auto-close enabled no
To guard against ignored typos and syntax errors in SQL, or other unintended consequences of various combinations of operational modes and SQL commands, the InnoDB Plugin provides a "strict mode" of operations. In this mode, InnoDB will raise error conditions in certain cases, rather than issue a warning and process the specified command (perhaps with some unintended defaults). This is analogous to MySQL's sql_mode, which controls what SQL syntax MySQL will accept, and determines whether it will silently ignore errors, or validate input syntax and data values.
Using the new clauses and settings for ROW_FORMAT and KEY_BLOCK_SIZE on CREATE TABLE and ALTER TABLE commands and the CREATE INDEX command can be confusing when not running in strict mode. Unless you run in strict mode, InnoDB will ignore certain syntax errors and will create the table or index, with only a warning in the message log. However if InnoDB strict mode is on, such errors will generate an immediate error and the table or index will not be created, thus saving time by catching the error at the time the command is issued.
Default frequency 12:00:00
Default auto-close enabled no
InnoDB Tablespace Cannot Automatically Expand
If the InnoDB tablespace is not allowed to automatically grow to meet incoming data demands and your application generates more data than there is room for, out-of-space errors will occur and your application may experience problems.
Default frequency 06:00:00
Default auto-close enabled no
InnoDB Transaction Logs Not Sized Correctly
To avoid frequent checkpoint activity and reduce overall physical I/O, which can slow down write-heavy systems, the InnoDB transaction logs should be approximately 50-100% of the size of the InnoDB buffer pool, depending on the size of the buffer pool.
Default frequency 06:00:00
Default auto-close enabled no
Insecure Password Authentication Option Is Enabled
Prior to MySQL 4.1, password hashes computed by the PASSWORD() function were 16 bytes long. As of MySQL 4.1 (and later), PASSWORD() was modified to produce a longer 41-byte hash value to provide enhanced security. However, in order to allow backward-compatibility with user tables that have been migrated from pre-4.1 systems, you can configure MySQL to accept logins for accounts that have password hashes created using the old, less-secure PASSWORD() function, but this is not recommended.
Default frequency 06:00:00
Default auto-close enabled no
Insecure Password Generation Option Is Enabled
Prior to MySQL 4.1, password hashes computed by the PASSWORD() function were 16 bytes long. As of MySQL 4.1 (and later), PASSWORD() was modified to produce a longer 41-byte hash value to provide enhanced security. In order to allow backward-compatibility with older client programs, you can configure MySQL to generate short (pre-4.1) password hashes for new passwords, however, this is not recommended.
Default frequency 06:00:00
Default auto-close enabled no
INSERT ON DUPLICATE KEY UPDATE Bug May Break Replication
For INSERT ... ON DUPLICATE KEY UPDATE statements where some AUTO_INCREMENT values were generated automatically for inserts and some rows were updated, one auto-generated value was lost per updated row, leading to faster exhaustion of the range of the AUTO_INCREMENT column. Affected versions of MySQL include 5.0.24 to 5.0.34, and 5.1.12 to 5.1.17 (inclusive).
Because the original problem can affect replication (different values on master and slave), it is recommended that the master and its slaves be upgraded to the current version.
Default frequency 06:00:00
Default auto-close enabled no
Key Buffer Size Greater Than 4 GB
To minimize disk I/O, the MyISAM storage engine employs a key cache (or key buffer) to keep the most frequently accessed index blocks in memory. However, prior to MySQL version 5.0.52 this key buffer is limited in size to 4 GB,
even on
          64-bit operating systems
. If set to a larger value, mysqld may crash when it tries to increase the actual buffer beyond 4 GB. Note that key_buffer_size is limited to 4GB on both 32-bit and 64-bit Windows systems, even in MySQL version 5.0.52 and later.Default frequency 06:00:00
Default auto-close enabled no
Key Buffer Size May Not Be Optimal For Key Cache
The key cache hit ratio represents the proportion of keys that are being read from the key cache in memory instead of from disk. This should normally be greater than 99% for optimum efficiency.
Default frequency 00:05:00
Default auto-close enabled no
Key Buffer Size May Not Be Optimal For System RAM
The target server does not appear to have sufficient memory devoted to the key cache. On a dedicated server, this cache is commonly about 25%-50% of total RAM.
Default frequency 06:00:00
Default auto-close enabled no
LOCAL Option Of LOAD DATA Statement Is Enabled
The LOAD DATA statement can load a file that is located on the server host, or it can load a file that is located on the client host when the LOCAL keyword is specified.
There are two potential security issues with supporting the LOCAL version of LOAD DATA statements:
The transfer of the file from the client host to the server host is initiated by the MySQL server. In theory, a patched server could be built that would tell the client program to transfer a file of the server's choosing rather than the file named by the client in the LOAD DATA statement. Such a server could access any file on the client host to which the client user has read access.
In a Web environment where the clients are connecting from a separate web server, a user could use LOAD DATA LOCAL to read any files that the web server process has read access to (assuming that a user could run any statement against the SQL server). In this environment, the client with respect to the MySQL server actually is the web server, not the remote program being run by the user who connects to the web server.
Default frequency 00:05:00
Default auto-close enabled no
Performance can be degraded if the percentage of table operations that have to wait for a lock is high compared to the overall number of locks. This can happen when using a table-level locking storage engine, such as MyISAM, instead of a row-level locking storage engine.
Default frequency 00:05:00
Default auto-close enabled no
Malformed Password Packet In Connection Protocol Can Crash Server
Due to Bug#28984, a malformed password packet in the connection protocol could cause the server to crash. This can lead to denial of service (DoS) attacks.
This bug has been fixed in later versions of the MySQL server.
Default frequency 06:00:00
Default auto-close enabled no
Maximum Connection Limit Nearing Or Reached
Once the maximum connection limit for the MySQL server has been reached, no other user connections can be established and errors occur on the client side of the application.
Default frequency 00:05:00
Default auto-close enabled no
Missing Security Improvements In GRANT Options
The GRANT statement is used to create MySQL user accounts and to grant rights to accounts. Due to bugs 15756 and 14385, rights may be granted erroneously in certain circumstances:
In grant table comparisons, improper use of a latin1 collation caused some hostname matches to be true that should have been false (Bug#15756).
GRANTs to users with wildcards in their host information could be erroneously applied to similar users with the same username and similar wildcards. For example, a privilege granted to foo@% is also applied to user foo@192.% (Bug#14385).
These bugs have been fixed in later versions of the MySQL server.
Default frequency 06:00:00
Default auto-close enabled no
Multi-Byte Encoding Processing Can Lead To SQL Injection
Due to bug 8378, the server incorrectly parsed strings escaped with the mysql_real_escape_string() C API function. As a result, even when the character set-aware mysql_real_escape_string() function was used, SQL injection was possible.
This bug has been fixed in later versions of the MySQL server.
Default frequency 06:00:00
Default auto-close enabled no
Multiple Threads Used When Repairing MyISAM Tables
Using multiple threads when repairing MyISAM tables can improve performance, but it can also lead to table and index corruption as reported by several bugs (#11527, #11684, #18874). Even though these bugs have been fixed, this feature is still considered beta-quality, as noted in the manual.
Default frequency 06:00:00
Default auto-close enabled no
MyISAM Concurrent Insert Setting May Not Be Optimal
MyISAM uses table-level locking, which can adversely affect performance when there are many concurrent INSERT and SELECT statements because INSERTs will block all SELECTs until the INSERT is completed. However, MyISAM can be configured to allow INSERT and SELECT statements to run concurrently in certain situations.
If
concurrent_insert is set to 1(the default), MySQL allows INSERT and SELECT statements to run concurrentlyfor MyISAM tables that have no free blocks in the middleof the data file.If
concurrent_insert is set to 2(available in MySQL 5.0.6 and later), MySQL allows concurrent insertsfor all MyISAM tables, even those that have holes. For a table with a hole, new rows are inserted at the end of the table if it is in use by another thread. Otherwise, MySQL acquires a normal write lock and inserts the row into the hole.Note that setting concurrent_insert to 2 allows tables to grow even when there are holes in the middle. This can be bad for applications that delete large chunks of data but continue to issue many SELECTs, thus effectively preventing INSERTs from filling the holes.
Default frequency 06:00:00
Default auto-close enabled no
MyISAM Indexes Found with No Statistics
The MySQL optimizer needs index statistics to help make choices about whether to use indexes to satisfy SQL queries. Having no statistics or outdated statistics limits the optimizer's ability to make smart and informed access plan choices.
Default frequency 12:00:00
Default auto-close enabled no
MyISAM Key Cache Has Sub-Optimal Hit Rate
The key cache hit ratio represents the proportion of index values that are being read from the key cache in memory instead of from disk. This should normally be greater than 99% for optimum efficiency.
Default frequency 00:05:00
Default auto-close enabled no
MySQL Agent Memory Usage Excessive
The memory needed by the MySQL Agent for basic monitoring is fairly small and consistent, and depends on the number of rules you have enabled. However, when the Query Analyzer is enabled, the Agent can use significantly more memory to monitor and analyze whatever queries you direct through it. In this case, the amount of memory used depends on the number of unique normalized queries, example queries and example explains being processed, plus the network bandwidth required to send query data to the Service Manager. In general, the amount of memory used for the Query Analyzer is small and well-bounded, but under some circumstances it can become excessive, especially on older versions of Linux.
Default frequency 00:01:00
Default auto-close enabled no
MySQL Agent Not Communicating With Database Server
The MySQL Enterprise Service Agent must be able to communicate with the local MySQL database server in order to monitor the server and provide advice on enforcement of best practices.
Default frequency 00:01:00
Default auto-close enabled yes
In order to monitor a MySQL server, a Service Agent must be running and communicating with the Service Manager. If the Agent cannot communicate with the Service Manager, the Service Manager has no way of knowing if the MySQL database server being monitored is running, and it cannot collect current statistics to properly evaluate the rules scheduled against that server.
Default frequency 00:00:01
Default auto-close enabled yes
MySQL Server Has Been Restarted
To perform useful work, a database server must be up-and-running continuously. It is normal for a production server to run continuously for weeks, months, or longer. If a server has been restarted recently, it may be the result of planned maintenance, but it may also be due to an unplanned event that should be investigated.
Default frequency 00:05:00
Default auto-close enabled no
To perform useful work, it must be possible to connect to the local MySQL database server. If the MySQL Enterprise Service Agent cannot communicate with the server, it is likely the server is not running.
Default frequency 00:01:00
Default auto-close enabled yes
Next-Key Locking Disabled For InnoDB But Binary Logging Enabled
Next-key locking in InnoDB can be disabled, which may improve performance in some situations. However, this may result in inconsistent data when recovering from the binary logs in replication or recovery situations. Starting from MySQL 5.0.2, this option is even more unsafe than it was in version 4.1.x.
Default frequency 06:00:00
Default auto-close enabled no
No Limit On Total Number Of Prepared Statements
Due to Bug#16365, there is no limit to the number of prepared statements that can be open per connection. This can lead to a Denial Of Service (DoS) attack, as the server will crash with out-of-memory (OOM) errors when the amount of statements becomes very large.
This bug has been fixed in later versions of the MySQL server.
Default frequency 06:00:00
Default auto-close enabled no
No Value Set For myisam-recover
The
myisam-recoveroption enables automatic MyISAM crash recovery should a MyISAM table become corrupt for some reason. If this option is not set, then a table will be "Marked as crashed" if it becomes corrupt, and no sessions will be able to SELECT from it, or perform any sort of DML against it.Default frequency 06:00:00
Default auto-close enabled no
Non-Authorized User Has DB, Table, Or Index Privileges On All Databases
Privileges such as SELECT, INSERT, ALTER, and so forth allow a user to view and change data, as well as impact system performance. Such operations should be limited to only those databases to which a user truly needs such access so the user cannot inadvertently affect other people's applications and data stores.
Default frequency 01:00:00
Default auto-close enabled no
Non-Authorized User Has GRANT Privileges On All Databases
The
GRANTprivilege, when given on all databases as opposed to being limited to a few specific databases, enables a user to give to other users those privileges that the grantor possesses on all databases. It can be used for databases, tables, and stored routines. Such a privilege should be limited to as few users as possible. Users who do indeed need the GRANT privilege should have that privilege limited to only those databases they are responsible for, and not for all databases.Default frequency 01:00:00
Default auto-close enabled no
Non-Authorized User Has Server Admin Privileges
Certain privileges, such as SHUTDOWN and SUPER, are primarily used for server administration. Some of these privileges can have a dramatic effect on a system because they allow someone to shutdown the server or kill running processes. Such operations should be limited to a small set of users.
Default frequency 01:00:00
Default auto-close enabled no
Object Changed: Database Has Been Altered
For development environments, changes to databases and objects may be a normal occurrence, but not for production environments. It is wise to know when any changes occur in a production environment with respect to any database structures and investigate the reasons for the changes.
Default frequency 00:10:00
Default auto-close enabled no
Object Changed: Database Has Been Created
For development environments, changes to databases and objects may be a normal occurrence, but not for production environments. It is wise to know when any changes occur in a production environment with respect to any database structures and investigate the reasons for the changes.
Default frequency 00:10:00
Default auto-close enabled no
Object Changed: Database Has Been Dropped
For development environments, changes to databases and objects may be a normal occurrence, but not for production environments. It is wise to know when any changes occur in a production environment with respect to any database structures and investigate the reasons for the changes.
Default frequency 00:10:00
Default auto-close enabled no
Object Changed: Function Has Been Created
For development environments, changes to databases and objects may be a normal occurrence, but not for production environments. It is wise to know when any changes occur in a production environment with respect to any database structures and investigate the reasons for the changes.
Default frequency 00:10:00
Default auto-close enabled no
Object Changed: Function Has Been Dropped
For development environments, changes to databases and objects may be a normal occurrence, but not for production environments. It is wise to know when any changes occur in a production environment with respect to any database structures or functions and investigate the reasons for the changes.
Default frequency 00:10:00
Default auto-close enabled no
Object Changed: Index Has Been Created
For development environments, changes to databases and objects may be a normal occurrence, but not for production environments. It is wise to know when any changes occur in a production environment with respect to any database structures and investigate the reasons for the changes.
Default frequency 00:10:00
Default auto-close enabled no
Object Changed: Index Has Been Dropped
For development environments, changes to databases and objects may be a normal occurrence, but not for production environments. It is wise to know when any changes occur in a production environment with respect to any database structures and investigate the reasons for the changes.
Default frequency 00:10:00
Default auto-close enabled no
Object Changed: Table Has Been Altered
For development environments, changes to databases and objects may be a normal occurrence, but not for production environments. It is wise to know when any changes occur in a production environment with respect to database structures and investigate the reasons for the changes.
Default frequency 00:10:00
Default auto-close enabled no
Object Changed: Table Has Been Created
For development environments, changes to databases and objects may be a normal occurrence, but not for production environments. It is wise to know when any changes occur in a production environment with respect to database structures and investigate the reasons for the changes.
Default frequency 00:10:00
Default auto-close enabled no
Object Changed: Table Has Been Dropped
For development environments, changes to databases and objects may be a normal occurrence, but not for production environments. It is wise to know when changes occur in a production environment with respect to database structures and investigate the reasons for the changes.
Default frequency 00:10:00
Default auto-close enabled no
Object Changed: User Has Been Dropped
For development environments, changes to databases and objects may be a normal occurrence, but not for production environments. It is wise to know when changes occur in a production environment with respect to database structures and investigate the reasons for the changes.
Default frequency 00:10:00
Default auto-close enabled no
For development environments, changes to databases and objects may be a normal occurrence, but not for production environments. It is wise to know when any changes occur in a production environment with respect to any database structures and investigate the reasons for the changes.
Default frequency 00:10:00
Default auto-close enabled no
Prepared Statements Not Being Closed
Prepared statements may increase performance in applications that execute similar statements more than once, primarily because the query is parsed only once. Prepared statements can also reduce network traffic because it is only necessary to send the data for the parameters for each execution rather than the whole statement.
However, prepared statements take time to prepare and consume memory in the MySQL server until they are closed, so it is important to use them properly. If you are not closing prepared statements when you are done with them, you are needlessly tying up memory that could be put to use in other ways.
Default frequency 00:05:00
Default auto-close enabled no
Prepared Statements Not Being Used Effectively
Prepared statements may increase performance in applications that execute similar statements more than once, primarily because the query is parsed only once. Prepared statements can also reduce network traffic because it is only necessary to send the data for the parameters for each execution rather than the whole statement.
However, prepared statements take time to prepare and consume memory in the MySQL server until they are closed, so it is important to use them properly. If you are only executing a statement a few times, the overhead of creating a prepared statement may not be worthwhile.
Default frequency 00:05:00
Default auto-close enabled no
Query Cache Has Sub-Optimal Hit Rate
When enabled, the query cache should experience a high degree of "hits", meaning that queries in the cache are being reused by other user connections. A low hit rate may mean that not enough memory is allocated to the cache, identical queries are not being issued repeatedly to the server, or that the statements in the query cache are invalidated too frequently by INSERT, UPDATE or DELETE statements.
Default frequency 00:05:00
Default auto-close enabled no
MySQL can cache the results of SELECT statements in memory so that they do not have to constantly be parsed and executed. If your application often runs the same queries over and over, caching the results can increase performance significantly. It's important to use a version or binary of MySQL that supports the query cache.
Default frequency 06:00:00
Default auto-close enabled no
Enabling the query cache can increase performance by 200% for queries that are executed often and have large result sets.
Default frequency 00:05:00
Default auto-close enabled no
Query Cache Potentially Undersized
When the Query Cache is full, and needs to add more queries to the cache, it will make more room in the cache by freeing the least recently used queries from the cache, and then inserting the new queries. If this is happening often then you should increase the size of the cache to avoid this constant "swapping".
Default frequency 00:05:00
Default auto-close enabled no
A reasonable amount of free memory is required for a system to perform well. Without free memory, new processes and threads cannot start, and the operating system may do excessive paging (swapping blocks of memory to and from disk).
Default frequency 00:01:00
Default auto-close enabled no
Root Account Can Login Remotely
By default, MySQL includes a root account with unlimited privileges that is typically used to administer the MySQL server. If possible, accounts with this much power should not allow remote logins in order to limit access to only those users able to login to the machine on which MySQL is running. This helps prevent unauthorized users from accessing and changing the system.
Default frequency 00:05:00
Default auto-close enabled no
The root user account has unlimited privileges and is intended for administrative tasks. Privileged accounts should have strong passwords to prevent unauthorized users from accessing and changing the system.
Default frequency 00:05:00
Default auto-close enabled yes
Row-based Replication Broken For UTF8 CHAR Columns Longer Than 85 Characters
Due to Bug#37426, row-based replication breaks when CHAR() UTF8 fields with a length greater than 85 characters are used.
This bug has been fixed in later versions of the MySQL server.
Default frequency 06:00:00
Default auto-close enabled no
Security Alterations Detected: User Privileges Granted
For development environments, changes to database security privileges may be a normal occurrence, but for production environments it is wise to know when any security changes occur with respect to database privileges, and to ensure that those changes are authorized and required.
Default frequency 00:05:00
Default auto-close enabled no
Security Alterations Detected: User Privileges Revoked
For development environments, changes to database security privileges may be a normal occurrence, but for production environments it is wise to know when any security changes occur with respect to database privileges, and to ensure that those changes are authorized and required.
Default frequency 00:05:00
Default auto-close enabled no
Security Alterations Have Been Detected
For development environments, changes to database security privileges may be a normal occurrence, but for production environments it is wise to know when any security changes occur with respect to database privileges, and to ensure that those changes are authorized and required.
Default frequency 00:05:00
Default auto-close enabled no
Security Risk with BINLOG Statement
Due to Bug#31611, any user can execute BINLOG statements, which effectively gives them the ability to execute any SQL statement regardless of the privileges associated with their user account (i.e. as given by the GRANT statement). This allows any connected user to get any privileges they want, edit any data they want, add and drop tables, etc.
This bug has been fixed in later versions of the MySQL server.
Default frequency 06:00:00
Default auto-close enabled no
Server Contains Default "test" Database
By default, MySQL comes with a database named
testthat anyone can access. This database is intended only for testing and should be removed before moving into a production environment. Because the defaulttestdatabase can be accessed by any user and has permissive privileges, it should be dropped immediately as part of the installation process.Default frequency 00:05:00
Default auto-close enabled no
Server Has Accounts Without A Password
Accounts without passwords are particularly dangerous because an attacker needs to guess only a username. Assigning passwords to all accounts helps prevent unauthorized users from accessing the system.
Default frequency 00:05:00
Default auto-close enabled yes
Anonymous MySQL accounts allow clients to connect to the server without specifying a username. Since anonymous accounts are well known in MySQL, removing them helps prevent unauthorized users from accessing the system.
Default frequency 00:05:00
Default auto-close enabled yes
Server Includes A Root User Account
By default, MySQL includes a root account with unlimited privileges that is typically used to administer the MySQL server. There is no reason this account must be named 'root'. Accounts with this much power should not be easily discovered. Since the root account is well known in MySQL, changing its name helps prevent unauthorized users from accessing and changing the system.
Default frequency 00:05:00
Default auto-close enabled no
Server-Enforced Data Integrity Checking Disabled
SQL Modes define what SQL syntax MySQL should support and what kind of data validation checks it should perform. If no SQL modes are enabled this means there is no form of server-enforced data integrity, which means incoming data that is invalid will not be rejected by the server, but instead will be changed to conform to the target column's default datatype. Note, however, that beginning with MySQL 4.1, any client can change its own session SQL mode value at any time.
Default frequency 06:00:00
Default auto-close enabled no
Server-Enforced Data Integrity Checking Not Strict
SQL Modes define what SQL syntax MySQL should support and what kind of data validation checks it should perform. There are many possible options that can be used in conjunction with each other to specify varying degrees of syntax and data validation checks the MySQL server will perform. However, to ensure the highest level of confidence for data integrity, at least one of the following should be included in the list:
TRADITIONAL, STRICT_TRANS_TABLES,orSTRICT_ALL_TABLES.Note, however, that beginning with MySQL 4.1, any client can change its own session SQL mode value at any time.
Default frequency 06:00:00
Default auto-close enabled no
Slave Detection Of Network Outages Too High
Slaves must deal with network connectivity outages that affect the ability of the slave to get the latest data from the master, and hence cause replication to fall behind. However, the slave notices the network outage only after receiving no data from the master for
slave_net_timeout
          seconds
. You may want to decreaseslave_net_timeoutso the outages -- and associated connection retries -- are detected and resolved faster. The default for this parameter is 3600 seconds (1 hour), which is too high for many environments.Default frequency 06:00:00
Default auto-close enabled no
Slave Error: Unknown or Incorrect Time Zone
In order to use time zone names in conjunction with certain statements, functions, and data types, you must configure the server to understand those names by loading information from the operating system's time zone files into a set of tables in the mysql database. However, while the MySQL installation procedure creates those time zone tables, it does not load them; they must be loaded manually after installation.
Default frequency 00:05:00
Default auto-close enabled no
Slave Execution Position Too Far Behind Read Position
When a slave receives updates from its master, the I/O thread stores the data in local files known as relay logs. The slave's SQL thread reads the relay logs and executes the updates they contain. If the position from which the SQL thread is reading is way behind the position to which the I/O thread is currently writing, it is a sign that replication is getting behind and results of queries directed to the slave may not reflect the latest changes made on the master.
Default frequency 00:05:00
Default auto-close enabled no
If replication on a slave has been stopped, it means the slave is not retrieving the latest statements from the master and it is not executing those statements on the slave.
Default frequency 00:01:00
Default auto-close enabled yes
Slave Has Experienced A Replication Error
When a slave receives updates from its master it must apply those updates locally so the data on the slave matches that on the server. If an error occurs while applying an update on a slave, the data on the slave may not match that on the master and it is an indication that replication may be broken.
Default frequency 00:05:00
Default auto-close enabled no
Slave Has Login Accounts With Inappropriate Privileges
Altering and dropping tables on a slave can break replication. Unless the slave also hosts non-replicated tables, there is no need for accounts with these privileges. As an alternative, you should set the
read_onlyflagONso the server allows no updates except from users that have the SUPER privilege or from updates performed by slave threads.Default frequency 06:00:00
Default auto-close enabled no
Slave Has Problem Communicating With Master
Slaves must connect to a master to get the latest data from the master. If they cannot connect, or periodically have trouble connecting, replication may fall behind (i.e. the slave may not have the latest data that was written to the master).
Default frequency 00:05:00
Default auto-close enabled no
If neither the slave I/O thread nor the slave SQL threads are running, it means the slave is not getting the latest statements from the master and it is not executing those statements on the slave, and thus replication has stopped entirely.
Default frequency 00:01:00
Default auto-close enabled yes
The slave I/O thread is the thread that retrieves statements from the master's binary log and records them into the slave's relay log. If this thread isn't running, it means the slave is not able to retrieve the latest data from the master.
Default frequency 00:01:00
Default auto-close enabled yes
Slave Not Configured As Read Only
Arbitrary or unintended updates to a slave may break replication or cause a slave to be inconsistent with respect to its master. Making a slave
read_onlycan be useful to ensure that a slave accepts updates only from its master server and not from clients; it minimizes the possibility of unintended updates.Default frequency 06:00:00
Default auto-close enabled no
Slave Relay Log Space Is Very Large
When a slave receives updates from its master, the I/O thread stores the data in local files known as relay logs. The slave's SQL thread reads the relay logs and executes the updates they contain. After the SQL thread has executed all the updates in a relay log, the file is no longer needed and can be deleted to conserve disk space.
Default frequency 06:00:00
Default auto-close enabled no
Slave Relay Logs Not Automatically Purged
When a slave receives updates from its master, the I/O thread stores the data in local files known as relay logs. The slave's SQL thread reads the relay logs and executes the updates they contain. After the SQL thread has executed all the updates in a relay log, the file is no longer needed and can be deleted to conserve disk space.
Default frequency 06:00:00
Default auto-close enabled no
The slave SQL thread is the thread that reads statements from the slave's relay log and executes them to bring the slave in sync with the master. If this thread isn't running, it means the slave is not able to apply the latest changes it has read from the master, and results of queries directed to the slave may not reflect the latest changes made on the master.
Default frequency 00:01:00
Default auto-close enabled yes
Slave SQL Thread Reading From Older Relay Log Than I/O Thread
When a slave receives updates from its master, the I/O thread stores the data in local files known as relay logs. The slave's SQL thread reads the relay logs and executes the updates they contain. If the SQL thread is reading from an older relay log than the one to which the I/O thread is currently writing, it is a sign that replication is getting behind and results of queries directed to the slave may not reflect the latest changes made on the master.
Default frequency 00:05:00
Default auto-close enabled no
If a slave is too far behind the master, results of queries directed to the slave may not reflect the latest changes made on the master.
Default frequency 00:01:00
Default auto-close enabled yes
Slave Waiting To Free Relay Log Space
For slaves with limited disk space you can place a limit on how large the replication relay log can grow. When the limit is reached, the I/O thread stops reading binary log events from the master server until the SQL thread has caught up and deleted some unprocessed relay logs. While this protects MySQL from filling up the disk, it means replication is delayed and the slave will fall behind the master.
Default frequency 00:05:00
Default auto-close enabled no
Slave Without REPLICATION SLAVE Accounts
If the master ever fails, you may want to use one of the slaves as the new master. An account with the REPLICATION SLAVE privilege must exist for a server to act as a replication master (so a slave can connect to it), so it's a good idea to create this account on your slaves to prepare it to take over for a master if needed.
Default frequency 06:00:00
Default auto-close enabled no
The slow query log can be used to identify queries that take a long time to complete.
Default frequency 00:05:00
Default auto-close enabled no
Stored Procedures Found With SELECT * Syntax
Best practices for SQL coding state that no query should be issued with SELECT *. Reasons include:
To ensure that only the necessary columns are returned from a SQL statement, the actual column names should be specifically entered. This cuts down on unwanted network traffic as only columns necessary for query satisfaction are present.
If the underlying table has columns added or removed, the query itself may malfunction if cursors or other such application objects are used.
Default frequency 06:00:00
Default auto-close enabled no
Stored Routine Runs In Definer''s Rather Than Caller''s Security Context
Due to bug 18630, a stored routine created by one user and then made accessible to a different user using GRANT EXECUTE could be executed by that user with the privileges of the routine's definer.
This bug has been fixed in later versions of the MySQL server.
Default frequency 06:00:00
Default auto-close enabled no
You can move tables and databases from the database directory to other locations and replace them with symbolic links to the new locations. You might want to do this, for example, to move a database to a file system with more free space or to increase the speed of your system by spreading your tables to different disks.
However, symlinks can compromise security. This is especially important if you run mysqld as root, because anyone who has write access to the server's data directory could then delete any file in the system!
Default frequency 06:00:00
Default auto-close enabled no
MySQL is multi-threaded, so there may be many clients issuing queries for a given table simultaneously. To minimize the problem with multiple client threads having different states on the same table, the table is opened independently by each concurrent thread.
The table cache is used to cache file descriptors for open tables and there is a single cache shared by all clients. Increasing the size of the table cache allows mysqld to keep more tables open simultaneously by reducing the number of file open and close operations that must be done. If the value of
Open_tablesis approaching the value oftable_cache, this may indicate performance problems.Default frequency 00:05:00
Default auto-close enabled no
Table Cache Set Too Low For Startup
The table cache size controls the number of open tables that can occur at any one time on the server. MySQL will work to open and close tables as needed, however you should avoid having the table cache set too low, causing MySQL to constantly open and close tables to satisfy object access.
If the table cache limit has been exceeded by the number of tables opened in the first three hours of service, then the table cache size is likely set too low.
Default frequency 00:30:00
Default auto-close enabled no
Table Lock Contention Excessive
Performance can be degraded if the percentage of table operations that have to wait for a lock is high compared to the overall number of locks. This can happen when using a table-level locking storage engine, such as MyISAM, instead of a row-level locking storage engine.
Default frequency 00:05:00
Default auto-close enabled no
The target server does not appear to be using indexes efficiently. The values of Handler_read_rnd_next and Handler_read_rnd together - which reflect the number of rows read via full table scans - are high compared to the sum of Handler variables which denote all row accesses - such as Handler_read_key, Handler_read_next etc. You should examine your tables and queries for proper use of indexes.
Default frequency 00:05:00
Default auto-close enabled no
Tables Found with No Primary or Unique Keys
A primary or unique key of a relational table uniquely identifies each record in the table. Except in very unusual circumstances, every database table should have one or more columns designated as the primary key or as a unique key, and it is common practice to declare one.
Default frequency 12:00:00
Default auto-close enabled no
Temporary Tables To Disk Ratio Excessive
If the space required to build a temporary table exceeds either
tmp_table_sizeormax_heap_table_size, MySQL creates a disk-based table in the server's tmpdir directory. Also, tables that have TEXT or BLOB columns are automatically placed on disk.For performance reasons it is ideal to have most temporary tables created in memory, leaving exceedingly large temporary tables to be created on disk.
Default frequency 00:05:00
Default auto-close enabled no
Each connection to the MySQL database server runs in its own thread. Thread creation takes time, so rather than killing the thread when a connection is closed, the server can keep the thread in its thread cache and use it for a new connection later.
Default frequency 00:05:00
Default auto-close enabled no
Thread Cache Size May Not Be Optimal
Each connection to the MySQL database server runs in its own thread. Thread creation takes time, so rather than killing the thread when a connection is closed, the server can keep the thread in its thread cache and use it for a new connection later.
Default frequency 00:05:00
Default auto-close enabled no
Too Many Concurrent Queries Running
Too many active queries indicates there is a severe load on the server, and may be a sign of lock contention or unoptimized SQL queries.
Default frequency 00:05:00
Default auto-close enabled no
UDF Support Can Be Used To Execute Arbitrary Code
In versions 4.1 and 5.0 of MySQL, by default, User Defined Functions (UDFs) are loaded from the system library path (e.g. /usr/lib). It has been determined that the security filter used does not guard properly against certain attacks using existing system libraries. As a result, it is possible for users with privileged access to execute arbitrary code. This problem can also be exploited on systems that are not actively using UDFs, if any untrusted remote users have DBA privileges on MySQL. To properly protect against this problem, a new variable has been introduced,
plugin_dir, which can be used to specify a different directory from which to load plugins.Default frequency 12:00:00
Default auto-close enabled no
UDFs Loaded From Insecure Location
User Defined Functions (UDFs) allow you to add features and extend the functionality of your MySQL server, but they also pose a danger if they can be loaded from an insecure location.
To protect against this problem the
plugin_dirvariable was introduced, which can be used to specify the directory from which to load plugins. If the value is non-empty, user-defined function object files must be located in that directory. If the value is empty, the UDF object files can be located in any directory that is searched by your system's dynamic linker, which does not guard properly against certain attacks using existing system libraries. As a result, it is possible for users with privileged access to execute arbitrary code. This problem can also be exploited on systems that are not actively using UDFs, if any untrusted remote users have DBA privileges on MySQL.Default frequency 12:00:00
Default auto-close enabled no
Use Of View Overrides Column Update Privileges On Underlying Table
Due to Bug#27878, by using a view, a user who only has privileges to update a given column of a table is able to update any column of that table, even though the view is defined with SQL SECURITY INVOKER. Also, use of a view could allow a user to gain update privileges for tables in other databases.
This bug has been fixed in later versions of the MySQL server.
Default frequency 06:00:00
Default auto-close enabled no
User Can Gain Privileges By Running Stored Routine Declared Using SQL SECURITY INVOKER
Due to Bug#27337, if a stored routine was declared using SQL SECURITY INVOKER, a user who invoked the routine could gain privileges. For example, a user without the CREATE privilege on a certain database could gain that privilege after invoking a stored routine.
This bug has been fixed in later versions of the MySQL server.
Default frequency 06:00:00
Default auto-close enabled no
User Has Rights To Database That Does Not Exist
When a database is dropped, user privileges on the database are not automatically dropped. This has security implications as that user will regain privileges if a database with the same name is created in the future, which may not be the intended result.
Default frequency 00:05:00
Default auto-close enabled no
User Has Rights To Table That Does Not Exist
When a table is dropped, user privileges on the table are not automatically dropped. This has security implications as that user will regain privileges if a table with the same name in the same database is created in the future, which may not be the intended result.
Default frequency 00:05:00
Default auto-close enabled no
User With Only ALTER Privilege On Partitioned Table Can Obtain SELECT Privilege Information
Due to Bug#23675, a user with only the ALTER privilege on a partitioned table could obtain information about the table that should require the SELECT privilege.
This bug has been fixed in later versions of the MySQL server.
Default frequency 06:00:00
Default auto-close enabled no
Users Can View All Databases On MySQL Server
The SHOW DATABASES privilege should be granted only to users who need to see all the databases on a MySQL Server. It is recommended that the MySQL Server be started with the
--skip-show-databaseoption enabled to prevent anyone from using the SHOW DATABASES statement unless they have been specifically granted the SHOW DATABASES privilege.Note: If a user is granted any global privilege, such as CREATE TEMPORARY TABLES or LOCK TABLES, they are automatically given the ability to show databases unless the server is started with the --skip-show-database option enabled. DBAs should be aware of this fact, in the event that any applications make use of temporary tables.
Default frequency 00:05:00
Default auto-close enabled no
Error conditions encountered by a MySQL server are always logged in the error log, but warning conditions are only logged if
log_warningsis set to a value greater than 0. If warnings are not logged you will not get valuable information about aborted connections and various other communication errors. This is especially important if you use replication so you get more information about what is happening, such as messages about network failures and reconnections.Default frequency 12:00:00
Default auto-close enabled no
XA Distributed Transaction Support Enabled For InnoDB
XA Distributed Transaction support is turned on by default. If you are not using this feature, note that it adds an extra fsync for each transaction and may adversely affect performance.
Default frequency 06:00:00
Default auto-close enabled no
Individual graphs are defined below.
Displays the number of client connections by displaying the number of connected threads, active threads, and cached threads.
| Name | Connections |
| Range Label | # connections |
| Series | Expression |
| Cached | cached |
| Running | running |
| Total | connected |
| Variables | Data Item |
| connected | mysql:status:Threads_connected |
| running | mysql:status:Threads_running |
| cached | mysql:status:Threads_cached |
Shows the number of client connections that have been aborted, either during connection, or aborted active connections. This information is useful to determine if your server is overloaded (and therefore aborting connections), or if there is a network fault. Aborted connections also indicate those which did not disconnect properly, for example during a timeout.
| Name | Connections - Aborted |
| Range Label | total/min |
| Series | Expression |
| Clients | clients |
| Connections | connections |
| Variables | Data Item |
| clients | mysql:status:Aborted_clients |
| connections | mysql:status:Aborted_connects |
Displays the thread cache information, comparing new thread creations against all database connections.
| Name | Connections - Cache |
| Range Label | total/min |
| Series | Expression |
| Connections | connections |
| Threads Created | tcreated |
| Variables | Data Item |
| tcreated | mysql:status:Threads_created |
| connections | mysql:status:Connections |
Shows the maximum number of connections, and the maximum number of used connections.
| Name | Connections - Maximum |
| Range Label | total |
| Series | Expression |
| Allowed | max_connections_allowed |
| Used | max_connections_used |
| Variables | Data Item |
| max_connections_allowed | mysql:variables:max_connections |
| max_connections_used | mysql:status:Max_used_connections |
Displays the CPU usage statistics over time for the machine hosting the MySQL server. The graph shows the aggregate system, user, wait and idle times for your CPU(s). You can use this information to help determine your CPU utilization and whether you are getting the most efficient use of your CPU power.
| Name | CPU Utilization |
| Range Label | % |
| Series | Expression |
| Kernel | sys/(sys+user+wait+idle)*100 |
| Total | (sys+user+wait)/(sys+user+wait+idle)*100 |
| User | user/(sys+user+wait+idle)*100 |
| Wait I/O | wait/(sys+user+wait+idle)*100 |
| Variables | Data Item |
| sys | os:cpu:cpu_sys |
| user | os:cpu:cpu_user |
| wait | os:cpu:cpu_wait |
| idle | os:cpu:cpu_idle |
Displays the database activity, by showing the individual counts
over time of different DML statements per minute. For example, you
can monitor the number of SELECT statements
executed per minute over time and gain an understanding of your
server throughput. This information can be used to monitor the
activity level, and provide a useful quick reference for your
server operation.
| Name | Database Activity |
| Range Label | avg statements/sec |
| Series | Expression |
| Call | ((call_proc)/60) |
| Delete | ((deletes+delete_multi)/60) |
| Insert | ((inserts+insert_selects)/60) |
| Replace | ((replaces+replace_selects)/60) |
| Select | (selects/60) |
| Update | ((updates+update_multi)/60) |
| Variables | Data Item |
| update_multi | mysql:status:Com_update_multi |
| replaces | mysql:status:Com_replace |
| replace_selects | mysql:status:Com_replace_select |
| deletes | mysql:status:Com_delete |
| delete_multi | mysql:status:Com_delete_multi |
| call_proc | mysql:status:Com_call_procedure |
| selects | mysql:status:Com_select |
| inserts | mysql:status:Com_insert |
| insert_selects | mysql:status:Com_insert_select |
| updates | mysql:status:Com_update |
Shows the cache hit ratios (as a percentage) for the query cache, MyISAM and InnoDB tables, and the connection and thread cache information. The information provided by the hit ratios can provide indicators of whether your cache is working effectively, or is of a size suitable for the data that you are storing and retrieving. Low hit ratios indicate that your cache are inefficient and may need to be investigated.
| Name | Hit Ratios |
| Range Label | % |
| Series | Expression |
| InnoDB Buffer | 100-((iReads / (iReadRequests+1))*100) |
| Key Cache | (100-((keyReads / (keyReadRequests+1))*100)) * (keyReadRequests
>= keyReads) |
| Query Cache | (qHits/(qHits+qInserts+1))*100 |
| Thread Cache | 100-((tcreated / (connections+1))*100) |
| Variables | Data Item |
| qHits | mysql:status:Qcache_hits |
| qInserts | mysql:status:Qcache_inserts |
| keyReads | mysql:status:Key_reads |
| keyReadRequests | mysql:status:Key_read_requests |
| iReads | mysql:status:Innodb_buffer_pool_reads |
| iReadRequests | mysql:status:Innodb_buffer_pool_read_requests |
| tcreated | mysql:status:Threads_created |
| connections | mysql:status:Connections |
InnoDB Adaptive Hash Index Memory
Shows the size of the InnoDB adaptive hash index. These are used to hold the data from tables in memory providing the size of the indexes is small enough to fit in memory. The graph shows the memory usage of the adaptive hash index.
| Name | InnoDB Adaptive Hash Index Memory |
| Range Label | MB |
| Series | Expression |
| Hash Node Size | ( hash_size * 16384 ) / 1024 / 1024 |
| Variables | Data Item |
| hash_size | mysql:innodbstatus:innodb_hash_node_heap |
InnoDB Adaptive Hash Index Searches
Displays the number of InnoDB adaptive hash index searches and those searches not using the adaptive hash index. You can use this to determine if your adaptive hash index is being used correctly, and is of a suitable size of the information and tables that are being accessed.
| Name | InnoDB Adaptive Hash Index Searches |
| Range Label | searches/sec |
| Series | Expression |
| hash searches | hash |
| non-hash searches | nonhash |
| Variables | Data Item |
| hash | mysql:innodbstatus:innodb_hash_searches_per_sec |
| nonhash | mysql:innodbstatus:innodb_non_hash_searches_per_sec |
Displays the size and page usage of the InnoDB buffer pool, providing information on the cache usage and performance. The graph shows the buffer pool size, active pages, and the number of modified pages.
| Name | InnoDB Buffer Pool |
| Range Label | MB |
| Series | Expression |
| Modified | (modified*16384)/(1024*1024) |
| Total Size | (size*16384)/(1024*1024) |
| Used | (used*16384)/(1024*1024) |
| Variables | Data Item |
| size | mysql:innodbstatus:innodb_bp_size |
| used | mysql:innodbstatus:innodb_bp_db_pages |
| modified | mysql:innodbstatus:innodb_bp_modified_pages |
Shows the time spent by InnoDB compressing and uncompressing data in compressed tables.
| Name | InnoDB Compression Time |
| Range Label | secs per min |
| Series | Expression |
| Compressing | compress |
| Uncompressing | uncompress |
| Variables | Data Item |
| compress | mysql:innodb_compression_time:compress_seconds |
| uncompress | mysql:innodb_compression_time:uncompress_seconds |
Displays the InnoDB I/O counts showing the number of
fsync, read, and write operations used to
support InnoDB tables.
| Name | InnoDB OS File Access |
| Range Label | avg operations/sec |
| Series | Expression |
| File fsync() | (fsync/60) |
| File Reads | (read/60) |
| File Writes | (write/60) |
| Variables | Data Item |
| read | mysql:innodbstatus:innodb_io_os_file_reads |
| write | mysql:innodbstatus:innodb_io_os_file_writes |
| fsync | mysql:innodbstatus:innodb_io_os_file_fsyncs |
Shows the row counts per minute for individual SQL operations
(READ, INSERT,
UPDATE and DELETE).
| Name | InnoDB Row Details |
| Range Label | avg rows/sec |
| Series | Expression |
| Rows Deleted | (deleted/60) |
| Rows Inserted | (inserted/60) |
| Rows Read | (read/60) |
| Rows Updated | (updated/60) |
| Variables | Data Item |
| read | mysql:innodbstatus:innodb_rows_read |
| inserted | mysql:innodbstatus:innodb_rows_inserted |
| updated | mysql:innodbstatus:innodb_rows_updated |
| deleted | mysql:innodbstatus:innodb_rows_deleted |
Displays the InnoDB semaphore status. The graph indicates the amount of time that different InnoDB threads have spent waiting due to the locks used to prevent the same structures being updated at the same time. A large number of threads waiting for the semaphores may be a result of disk I/O or connection problems inside InnoDB. You may want to modify your InnoDB thread concurrency.
| Name | InnoDB Semaphores |
| Range Label | avg waits/sec |
| Series | Expression |
| OS Waits | (oswaits/60) |
| Spin Rounds | (srounds/60) |
| Spin Waits | (swaits/60) |
| Variables | Data Item |
| swaits | mysql:innodbstatus:innodb_sem_mutex_spin_waits |
| srounds | mysql:innodbstatus:innodb_sem_mutex_rounds |
| oswaits | mysql:innodbstatus:innodb_sem_mutex_os_waits |
The size of the InnoDB transaction history. A high number may indicate a large number of open (uncommitted) transactions.
| Name | InnoDB Transaction History |
| Range Label | Undo Entries |
| Series | Expression |
| Undo Log Size | hist_len |
| Variables | Data Item |
| hist_len | mysql:innodbstatus:innodb_trx_history_list_length |
The number of blocked, locked, and active transactions. You can use this to determine the contention on tables for InnoDB transactions.
| Name | InnoDB Transactions |
| Range Label | total |
| Series | Expression |
| Blocked | blocked_trx |
| Lock Waiting | lock_trx |
| Running | active_trx |
| Variables | Data Item |
| active_trx | mysql:innodb_active_transactions:count |
| blocked_trx | mysql:innodb_blocked_transactions:count |
| lock_trx | mysql:innodb_lock_wait_transactions:count |
Displays the total Kilobytes per minute of bytes transferred to/from the server by client applications. Spikes in this output may indicate an unusual application operation or connection.
| Name | KBytes In/Out |
| Range Label | avg kbytes/sec |
| Series | Expression |
| Received | ((bytesIn/1024)/60) |
| Sent | ((bytesOut/1024)/60) |
| Total | (((bytesIn+bytesOut)/1024)/60) |
| Variables | Data Item |
| bytesIn | mysql:status:Bytes_received |
| bytesOut | mysql:status:Bytes_sent |
The load average of the server hosting the MySQL server. The load average shows the number of processes using or waiting for CPU time in the last 1, 5 and 15 minutes. Load averages showing a load highe than the number of CPU cores may indicate an overloaded server.
| Name | Load Average |
| Range Label | Load Average |
| Series | Expression |
| 1 | zero |
| 15 | two |
| 5 | one |
| Variables | Data Item |
| zero | os:loadavg:0 |
| one | os:loadavg:1 |
| two | os:loadavg:2 |
Displays the current amount of memory used by the agent, and by the Lua component of the agent.
| Name | Memory Usage - Agent |
| Range Label | MB |
| Series | Expression |
| Agent | agent_mem_size / 1024 / 1024 |
| Lua | lua_mem_size / 1024 / 1024 |
| Variables | Data Item |
| lua_mem_size | agent:lua:mem_size |
| agent_mem_size | agent:proc:mem_resident |
Displays the RAM usage on the server for the monitored MySQL instance. You should compare the total and used RAM values to ensure that you are not exceeding your available RAM, which will lead to swapping and performance issues.
| Name | Memory Usage - OS Resident |
| Range Label | MB |
| Series | Expression |
| Total | ram_total/(1024*1024) |
| Used | (ram_total-ram_unused)/(1024*1024) |
| Variables | Data Item |
| ram_total | os:mem:ram_total |
| ram_unused | os:mem:ram_unused |
Displays the use of swap space on the server for the monitored MySQL instance. High swap usage may indicate that your server needs more RAM or that your MySQL configuration needs to be modified, as high levels of swap will have a negative impact on performance.
| Name | Memory Usage - OS Virtual |
| Range Label | MB |
| Series | Expression |
| Total | swap_total/(1024*1024) |
| Used | (swap_total-swap_unused)/(1024*1024) |
| Variables | Data Item |
| swap_total | os:mem:swap_total |
| swap_unused | os:mem:swap_unused |
Displays the efficiency of the MyISAM key index buffer usage. On a system using a lot of MyISAM tables, low usage indicates that your MyISAM key buffer size is too high (reducing the RAM available for other buffering). High usage may indicate that you need to increase your MyISAM key buffer size to help improve performance.
| Name | MyISAM Key Buffer Usage |
| Range Label | MB |
| Series | Expression |
| Modified | (blk_size*not_flushed)/1024/1024 |
| Total Size | key_buffer/1024/1024 |
| Used | (key_buffer - (blk_size*unused))/1024/1024 |
| Variables | Data Item |
| key_buffer | mysql:variables:key_buffer_size |
| blk_size | mysql:variables:key_cache_block_size |
| unused | mysql:status:Key_blocks_unused |
| not_flushed | mysql:status:Key_blocks_not_flushed |
The number of tables in the open state per minute.
| Name | Opened Tables |
| Range Label | total/min |
| Series | Expression |
| Opened Tables | openedTables |
| Variables | Data Item |
| openedTables | mysql:status:Opened_tables |
The block usage of the query cache. Low usage may indicate that you are not getting the best performance out of your query cache. High numbers may indicate that you need to increase your query cache size to allow more queries to be cached.
| Name | Query Cache Blocks |
| Range Label | num blocks |
| Series | Expression |
| Free | free_blocks |
| Size | size_blocks |
| Variables | Data Item |
| size_blocks | mysql:status:Qcache_total_blocks |
| free_blocks | mysql:status:Qcache_free_blocks |
Displays the hits, inserts and queries not cacheable in the query cache. Low cache hits may indicate that your queries are being expired from the cache before they can be used, which may mean they are unsuitable for storing in the query cache.
| Name | Query Cache Efficiency |
| Range Label | avg cache ops/sec |
| Series | Expression |
| Hits | (hits/60) |
| Inserts | (inserts/60) |
| Not Cached | (not_cached/60) |
| Variables | Data Item |
| hits | mysql:status:Qcache_hits |
| inserts | mysql:status:Qcache_inserts |
| not_cached | mysql:status:Qcache_not_cached |
Displays the number of queries removed from the cache because the size of the query cache was not large enough to store the queries that can be cached. Try increasing your query cache size.
| Name | Query Cache Lowmem Prunes |
| Range Label | avg cache ops/sec |
| Series | Expression |
| Lowmem Prunes | (deletes/60) |
| Variables | Data Item |
| deletes | mysql:status:Qcache_lowmem_prunes |
Displays the free space and total size of the query cache.
| Name | Query Cache Memory |
| Range Label | MB |
| Series | Expression |
| Free MB | free/(1024*1024) |
| Size MB | size/(1024*1024) |
| Variables | Data Item |
| free | mysql:status:Qcache_free_memory |
| size | mysql:variables:query_cache_size |
Shows the number of queries stored in the query cache. In normal operation this should be a relatively constant figure. A large number of switches between high and low numbers may indicate that differently sized queries are being inserted into the query cache, and then later removed as a high number of smaller queries are added to the cache. Try increasing the size of your query cache.
| Name | Query Cache Queries |
| Range Label | num queries |
| Series | Expression |
| Queries in Cache | queries |
| Variables | Data Item |
| queries | mysql:status:Qcache_queries_in_cache |
Displays the number of seconds behind the master for a given slave in a replication scenario. An increasing value means that your slave is unable to keep up with your master.
| Name | Replication Delay |
| Range Label | total seconds |
| Series | Expression |
| Seconds Behind Master | sbehind |
| Variables | Data Item |
| sbehind | mysql:slavestatus:Seconds_Behind_Master |
Shows the average of the number of accesses for data for different query operations for all table reads, regardless of the storage engine being using, against the number of queries being executed.
| Name | Row Access Statistics |
| Range Label | rows |
| Series | Expression |
| Average Rows Per Query | ((first+key+next+prev+hread_rnd+hread_rnd_next+sort_rows) /
questions) |
| Variables | Data Item |
| first | mysql:status:Handler_read_first |
| key | mysql:status:Handler_read_key |
| next | mysql:status:Handler_read_next |
| prev | mysql:status:Handler_read_prev |
| hread_rnd | mysql:status:Handler_read_rnd |
| hread_rnd_next | mysql:status:Handler_read_rnd_next |
| sort_rows | mysql:status:Sort_rows |
| questions | mysql:status:Questions |
Displays the aggregated row access statistics per minute. Information is shown both in terms of the full table scans (which are expensive to perform), and index based accesses.
| Name | Row Accesses |
| Range Label | avg rows/sec |
| Series | Expression |
| Rows Read via Full Scan | ((hread_rnd+hread_rnd_next)/60) |
| Rows Read via Indexes | ((first+key+next+prev)/60) |
| Variables | Data Item |
| key | mysql:status:Handler_read_key |
| next | mysql:status:Handler_read_next |
| prev | mysql:status:Handler_read_prev |
| hread_rnd | mysql:status:Handler_read_rnd |
| hread_rnd_next | mysql:status:Handler_read_rnd_next |
| first | mysql:status:Handler_read_first |
Shows the number of delete, write (INSERT), and
update operations on rows per minute on all tables regardless of
storage engine.
| Name | Row Writes |
| Range Label | avg rows/sec |
| Series | Expression |
| Rows Deleted | (delete/60) |
| Rows Inserted | (write/60) |
| Rows Updated | (update/60) |
| Variables | Data Item |
| delete | mysql:status:Handler_delete |
| update | mysql:status:Handler_update |
| write | mysql:status:Handler_write |
Shows the number of different sort operations performed on queries.
| Name | Sort Activity |
| Range Label | total/min |
| Series | Expression |
| Merge Passes | Sort_merge_passes |
| Range | Sort_range |
| Scan | Sort_scan |
| Variables | Data Item |
| Sort_merge_passes | mysql:status:Sort_merge_passes |
| Sort_range | mysql:status:Sort_range |
| Sort_scan | mysql:status:Sort_scan |
Shows the percentage of table locks that have had to wait before an operation can continue. High lock ratios can indicate high contention in your tables, with too many operations having to wait, affecting the performance.
| Name | Table Lock Wait Ratio |
| Range Label | lock wait % |
| Series | Expression |
| Wait Ratio | ((lock_waits/lock_immediate)*100) |
| Variables | Data Item |
| lock_waits | mysql:status:Table_locks_waited |
| lock_immediate | mysql:status:Table_locks_immediate |
Shows the average number of table locks per second.
| Name | Table Locks |
| Range Label | avg locks/sec |
| Series | Expression |
| Immediate | (locks_immediate/60) |
| Waited | (locks_waited/60) |
| Variables | Data Item |
| locks_waited | mysql:status:Table_locks_waited |
| locks_immediate | mysql:status:Table_locks_immediate |
Displays the number of memory temporary tables and disk temporary tables. Disk temporary tables are slower to create, populate, and read back. You may want to increase your memory temporary table size or check your queries to determine whether the use of temporary tables can be minimized.