Table of Contents
Query Analyzer lets you monitor SQL statements executed on a MySQL server and see details about each query, as well as number of executions and execution times. Similar queries with different literal values are combined (“normalized”) for reporting purposes.
Query Analyzer collects information about SQL statements that a MySQL client application sends to the MySQL server. The client application must either route its database requests through the MySQL Enterprise Agent proxy service, or use the MySQL Enterprise Monitor Plugin for a given connector that sends the information directly to MySQL Enterprise Service Manager. Once your MySQL client application is configured to communicate via the MySQL Enterprise Agent, queries are monitored and the normalized queries are sent to the MySQL Enterprise Agent.
For the different ways to enable Query Analysis, see Section 3.1, “Providing Query Analyzer Data”.
The MySQL Proxy component and Query Analyzer require that clients connecting through MySQL Enterprise Agent use MySQL 5.0 or later. Clients that use the library provided with MySQL 4.1 or earlier do not work with MySQL Enterprise Agent.
Once the data is collected, you view and monitor the queries, check the execution statistics, and filter and drill down on the information. By comparing the queries to the server graphs, you can correlate query execution with server status. For more information on viewing, filtering and reporting on the query analyzer data, see Section 3.2, “Query Analyzer User Interface”.
MySQL Enterprise subscription, MySQL Enterprise Monitor, MySQL Replication Monitor, and MySQL Query Analyzer are only available to commercial customers. To learn more, see: http://www.mysql.com/products/enterprise/features.html.
The Query Analyzer can be fed information from a number of different sources, in each case with the provider supplying the statistical information about the queries, execution times, result counts and other data to be displayed and analyzed with the Query Analyzer tab within MySQL Enterprise Dashboard.
There are a number of different methods available for supplying query information to MySQL Enterprise Service Manager:
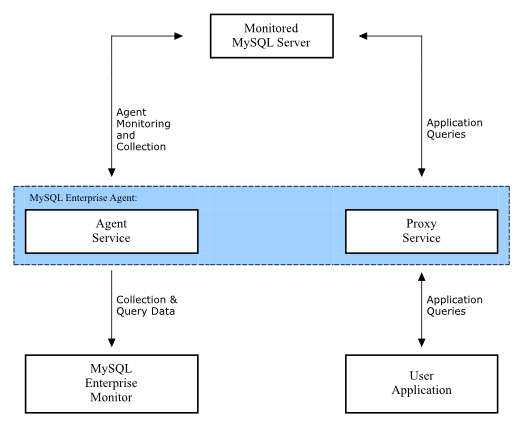
Using the MySQL Proxy functionality built into MySQL Enterprise Agent. This is the method offered and supported since MySQL Enterprise Monitor 2.0.
When using the proxy, queries from the client application are directed through the proxy to the MySQL server, with all results from the MySQL server being returned from the proxy to the client application. While this transmission of information takes place, the proxy component keeps statistical information and supplies this information to MySQL Enterprise Service Manager for analysis.
The structure of this process in relation to the MySQL server containing the client application data, the client application, and the the MySQL Enterprise Monitor components is shown in the figure below.
For more information on using this method, see Section 3.1.3, “Using the Agent Proxy”.
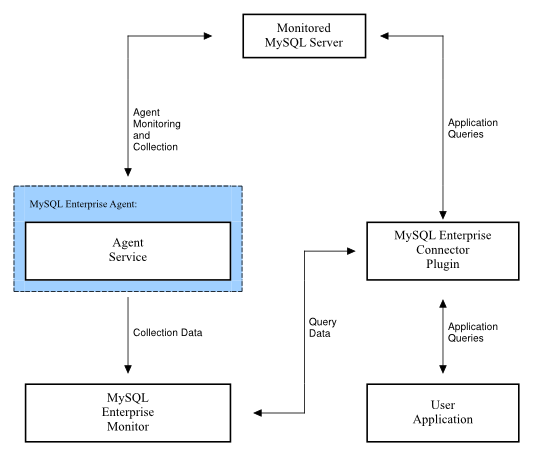
Use a MySQL connector with a corresponding MySQL Enterprise Monitor Plugin that provides tracing and statistical information directly to MySQL Enterprise Service Manager.
Using this method requires a connector that is capable of collecting and sending the query statistical data directly to MySQL Enterprise Service Manager. The connectors handles all of the collection of the basic query statistics, such as the execution time for each query, and the row counts, and provides this information to MySQL Enterprise Service Manager for analysis. This solution negates the need the proxy component, providing you with maximum speed between your application, connector and MySQL server containing your client application data.
The structure of this solution is shown in the figure below.
For more information on using this method, see the table below for information on which connectors support this method of operation.
The table below provides information on which connectors support the different functionality types.
Table 3.1. Query Analyzer Feeding Solution Comparison
| Feature | C/Java | C/NET | Proxy |
|---|---|---|---|
| Uses Proxy | No | No | Yes |
| Supports EXPLAIN | Yes | Yes | Yes |
The MySQL Enterprise Plugin for Connector/J enables any application using the Connector/J JDBC driver to automatically supply query analyzer information directly to MySQL Enterprise Service Manager. Once you have installed the installed plugin library in combination with your existing Connector/J driver, information will be sent to the MySQL Enterprise Service Manager for analysis. You do not need to modify or alter your applications to enable this functionality.
Prerequisites
MySQL Connector/J version 5.1.12 or later
JDK-1.5.0 or later
MySQL Enterprise Service Manager version 2.2 or later
The MySQL instance that is being used must by monitored by a MySQL Enterprise monitoring agent. The
mysql.inventorytable must be accessible to the configured user for the Connector/J connection to get the UUID of the monitored server.Apache Commons logging in the
CLASSPATHof the application being analyzed. If Commons Logging is not in use, this product ships with a version that must be deployed in the Application'sCLASSPATH.
Installation
Place the jar file
lib/c-java-mysql-enterprise-plugin-[version].jar
in the application's CLASSPATH where it is
visible to the version of MySQL Connector/J in use. This location is
preferably in the same location as MySQL Connector/J's jar file, or
in a parent classloader to MySQL Connector/J's jar file's location.
If the application being analyzed does not have Apache Commons
Logging in the CLASSPATH, install the file
lib/required/commons-logging-1.1.1.jar in the
application's CLASSPATH as well. If no other
component in your application uses Apache Commons Logging, install
it in the same place where the query analyzer plugin was installed.
Configuration
Once the required jar files are deployed, the connection URL for jdbc needs to be modified to use and configure the query analyzer plugin. The following properties and their corresponding values need to be added to the URL that is used by the application to be analyzed.
For more information on Connector/J properties, see Connector/J (JDBC) Reference.
Table 3.3. MySQL Monitor Plugin for Connector/J Options
| Property Name | Property Type | Default |
|---|---|---|
mysqlenterprise.httpSocketTimeoutMillis | numeric | |
mysqlenterprise.serviceManagerPassword | string | |
mysqlenterprise.serviceManagerUrl | string | |
mysqlenterprise.serviceManagerUser | string | |
statementInterceptors | string |
statementInterceptors=com.mysql.etools.jdbc.StatementPerformanceCountersEnables the operation of the plugin. Without this configuration option, query information will not be provided to MySQL Enterprise Service Manager
mysqlenterprise.serviceManagerUrlVersion Introduced 2.2.0 Permitted Values Type stringSpecifies the URL to the service manager. You can obtain this information from the configuration file created when MySQL Enterprise Service Manager was installed. Note that you must include the full URL, including the port number. For example
http://monitor.example.com:18080.mysqlenterprise.serviceManagerUserVersion Introduced 2.2.0 Permitted Values Type stringSpecifies the agent username to be used when communicating information to MySQL Enterprise Service Manager.
mysqlenterprise.serviceManagerPasswordVersion Introduced 2.2.0 Permitted Values Type stringSpecifies the agent password to be used when communicating information to MySQL Enterprise Service Manager.
Optional
mysqlenterprise.httpSocketTimeoutMillisVersion Introduced 2.2.0 Permitted Values Type numericThe number of milliseconds to wait when communicating with the service manager.
If you want to use SSL to communicate query information to the
MySQL Enterprise Service Manager then you can configure this using the properties
below. Out of the box, the plugin is configured to work with the
self-signed certificates that ship with the enterprise monitor.
Therefore, it will provide confidentiality for the information that
is sent by the plugin if the service manager URL starts with
https://. However, as-configured, the plugin does
not prevent man-in-the-middle attacks nor does it support
client-side certificates for authentication. To enable these
features, refer to the non-default values of the following
parameters:
Table 3.4. MySQL Monitor Plugin for Connector/J SSL Options
| Property Name | Property Type | Default |
|---|---|---|
mysqlenterprise.clientCertificateKeystorePassword | string | |
mysqlenterprise.clientCertificateKeystoreType | string | |
mysqlenterprise.clientCertificateKeystoreUrl | string | |
mysqlenterprise.trustCertificateKeystorePassword | string | |
mysqlenterprise.trustCertificateKeystoreType | numeric | |
mysqlenterprise.trustCertificateKeystoreUrl | string | |
mysqlenterprise.verifySslCerts | boolean | false |
mysqlenterprise.verifySslHostnames | boolean | false |
mysqlenterprise.verifySslHostnamesIf set to "true", host names presented in the SSL server certificate will be verified following the scheme listed at BrowserCompatHostnameVerifier which is the same scheme as used by Firefox and Curl and specified by RFC 2818.
mysqlenterprise.verifySslCertsSpecifies whether the plugin verify that the certificate presented by the server was signed by a CA in the
trustCertificateKeystore.mysqlenterprise.trustCertificateKeystoreUrlURL to the trusted root certificate KeyStore (if not specified, use Java defaults).
mysqlenterprise.trustCertificateKeystorePasswordPassword for the certificate store.
mysqlenterprise.trustCertificateKeystoreType=[type] KeyStore type for trusted root certificates (NULL or empty means use
JKSdefault, standard keystore types supported by the JVM areJKSandPKCS12, your environment may have more available depending on what security products are installed and available to the JVM.mysqlenterprise.clientCertificateKeystoreUrlURL to the client certificate KeyStore (if not specified, use Java defaults)
mysqlenterprise.clientCertificateKeystorePassword=[password]Password for the client certificate store.
mysqlenterprise.clientCertificateKeystoreTypeKeyStore type for client certificates (NULL or empty means use
JKSdefault, standard keystore types supported by the JVM areJKSandPKCS12, your environment may have more available depending on what security products are installed and available to the JVM.
For example, to configure a Connector/J to communicate with the MySQL Enterprise Service Manager localhost, on port 18080, using the agent username agent, and password PASSWORD, you would add the following options to your connection string:
statementInterceptors=com.mysql.etools.jdbc.StatementPerformanceCounters»
    &serviceManagerUrl=http://localhost:18080/»
    &serviceManagerUser=agent»
    &serviceManagerPassword=PASSWORD
Remember that you must also add the application specific options to
the JDBC URL. For example, the following fragment will connect to
the MySQL database test on
localhost, using the user and password of
mysqltest, while also collecting query data and
sending it to the MySQL Enterprise Service Manager on localhost:
import java.sql.Connection;
import java.sql.DriverManager;
import java.sql.SQLException;

Connection conn = null;
...
try {
    conn =
       DriverManager.getConnection("jdbc:mysql://localhost/test?" +
                                   "user=mysqltest" +
                                   "&password=mysqltest" +
                                   "&statementInterceptors=com.mysql.etools.jdbc.StatementPerformanceCounters" +
                                   "&serviceManagerUrl=http://localhost:18080/" +
                                   "&serviceManagerUser=agent" +
                                   "&serviceManagerPassword=PASSWORD"
                                   );

    // Do something with the Connection

   ...
} catch (SQLException ex) {
    // handle any errors
}
If a DataSource is in use (typically when using Glassfish, Weblogic, or Websphere), these properties must be passed as part of the URL property, they can not be added to the DataSource configuration itself.
If an alternate logging system has not been selected for Connector/J, it is recommended that Connector/J's log factory is configured to use something other than the standard logger by adding the following property to the URL or DataSource:
logger=Log4JLogger (for applications using Log4J)
logger=CommonsLogger (for applications using Apache Commons Logging)
logger=JDK14Logger (for applications using Java 1.4 or later logging)
Further configuration of the plugin is done via the Enterprise
Service Manager's user interface, using the Query Analyzer tab. From
here, the capture of query performance data for a given MySQL
instance that the plugin is being with can be enabled or disabled.
Further, the level of detail that is captured; summary, examples
(with source code locations) and EXPLAIN plans
can be configured as well.
The query analyzer plugin checks the configuration once each minute (while it is reporting data it has collected), thus configuration changes are not immediate.
Usage Notes
You should be aware of the following while using the MySQL Enterprise Plugin for Connector/J:
When a Java application that is reporting queries terminates, you may lose the information about some queries because the queued query information has not been sent to MySQL Enterprise Service Manager. You can get round this issue by adding a sleep to your application to ensure the normal reporting schedule submits the outstanding queries. For example, you could add:
Thread.sleep(60000);
To your application before the application terminates.
The MySQL Enterprise Plugin for Connector/NET provides query analyzer data from any application using Connector/NET, including both standalone and web based applications. Information about the queries is sent directly to the MySQL Enterprise Service Manager. Once you have installed the MySQL Enterprise Plugin for Connector/NET, query analysis will be available for your applications, without requiring any modification to your application code.
Prerequisites
You must be using Connector/NET version 6.2.3 or later.
Your application should already be using the
Mysql.data.dlland have been built with the library requirement.If you are using the released builds of Connector/NET, you must include the
logging=trueoption within your connection string.
Installation
Download the MySQL Enterprise Plugin for Connector/NET package. Extract the package using
a suitable Zip tool, and then place the plugin library,
MySql.MonitorPlugin.dll in the same directory as
your compiled application.
Configuration
If the application that you want to profile does not have an
app.config application configuration file then
you need to make one.
To enable query analyzer functionality, you need to register the
trace listeners in the System.Diagnostics section
of the app.config file. You can see an example
configuration file below:
<system.diagnostics>

  <sources>

    <source name="mysql" switchName="SourceSwitch" switchType="System.Diagnostics.SourceSwitch">

      <listeners>

        <add name="EMTrace" type="MySql.EMTrace.EMTraceListener, MySql.MonitorPlugin"
                initializeData=""
                Host="SERVERHOST:SERVERPORT"
                PostInterval="POSTINTERVAL"
                UserId="AGENTUSERID"
                Password="AGENTPASSWORD"/>

      </listeners>

    </source>

  </sources>

  <switches>


    <add name="SourceSwitch" value="All"/>

  </switches>

</system.diagnostics>
<system.data>

  <DbProviderFactories>

    <add name="MySQL Data Provider" invariant="MySql.Data.MySqlClient" description=".Net Framework Data Provider for MySQL" type="MySql.Data.MySqlClient\
.MySqlClientFactory, MySql.Data, Version=6.2.1.0, Culture=neutral, PublicKeyToken=c5687fc88969c44d" />

  </DbProviderFactories>

</system.data>
Within the configuration, you must set the values of the following parameters:
HostThe hostname and port number, separated by a colon, of the MySQL Enterprise Service Manager where the query analyzer data should be sent.
PostIntervalThe interval in seconds between posts of the collected query analyzer information from you application to the MySQL Enterprise Service Manager. You should choose the value for this carefully. Too long and it may take some time for queries to appear in the query analyzer.
UserIdThe username of a user within MySQL Enterprise Service Manager that has rights to send agent information.
PasswordThe password of a user within MySQL Enterprise Service Manager that has rights to send agent information.
To get extended information on queries and have that information sent up to MySQL Enterprise Monitor you must enable the Connector/NET usage advisor. Examples of the extended information includes not using an index on a query, or not accessing all columns from a result set.
To enable the usage advisor, you must add usage
advisor=true to the connection string within your
application. Enabling this option also automatically enables logging
within Connector/NET. For more information, see
Connector/NET Connection String Options Reference.
During execution of the application during development within Visual
Studio, you should see a significant amount of output in the
Output window. If you are running the
application standalone and want to monitor the trace output, you
should configure and additional listener in your configuration file.
You can do this by adding the following within the
system.diagnostics section of your
app.config file:
<trace autoflush="false" indentsize="4">
  <listeners>
    <add name="consoleListener" type="System.Diagnostics.ConsoleTraceListener" />
  </listeners>
</trace>
There are three different ways of feeding query analyzer using the MySQL Enterprise Agent Proxy Service:
Change your MySQL client application to talk to the Proxy port you configured during installation. This requires changing your MySQL client application code, and may require that you stop and restart your MySQL client application , but does not require any changes to your MySQL server. For more information, see Section 3.1.3.1, “Enabling Query Analyzer by Changing the MySQL Client Application”.
Change your MySQL server to listen on a different port, and configure the Agent/proxy to listen on the original MySQL server port. This does not require any changes to your MySQL client application , but will require shutting down and restarting your MySQL server, which may affect your cache and performance. For more information, see Section 3.1.3.2, “Enabling Query Analyzer by Changing MySQL Server”.
Use IP tables to redirect the network packets to the agent/proxy.
MySQL Query Analyzer is designed to gather query performance information from a variety of sources. Query Analyzer uses a new agent plug-in to proxy your queries and collect performance data that is then transmitted to the Enterprise Monitor. This is a new role for the Agent: it is no longer just monitoring, it is now optionally between your MySQL client application and the mysql server.
Depending upon your system load, it is possible to overload the
proxy or have the proxy/agent consume system resources needed by
mysql itself. In particular, the memory needed by the MySQL Agent
for basic monitoring is fairly small and consistent and depends on
the number of rules you have enabled. However, when the Query
Analyzer is enabled, the Agent can use significantly more memory to
monitor and analyze whatever queries you direct through it. In this
case, the amount of memory used depends on the number of unique
normalized queries, example queries and example
EXPLAINs being processed plus the network
bandwidth required to send this query performance data to the
Service Manager. In general, the amount of memory used for the Query
Analyzer is well-bounded, but under heavy load or, in some cases
under older versions of linux, RAM usage by Query Analyzer may be
too high for your environment and load.
Therefore we advise you to use this release of Query Analyzer extensively in development, test and stage environments under load for an extended period of time before considering usage in a production environment. For all deployments:
Carefully monitor the Agent's resource consumption using the new graph Memory Usage - Agent graphs available on the Graph tab. You can also add an SMTP or SNMP notification to the new Heat Chart rule MySQL Agent Memory Usage Excessive.
If the amount of memory consumed is too high, consider sampling queries during nonpeak hours or monitoring only a subset of queries on this system.
If you experience any problems with Query Analyzer, we're interested in working with you closely and quickly to resolve them. Please open a Support issue right away. We're already working hard on optimizing Agent/proxy RAM usage and are planning a series of rapid releases to quickly distribute these and other improvements to you.
Note that you must have enabled Query Analyzer within the
agent/proxy during installation. If you did not enable Query
Analyzer during the installation of the agent/proxy, check the
following elements within the main
mysql-monitor-agent.ini configuration file:
Add the
proxyplugin to thepluginsparameter:plugins=proxy,agent
Ensure that the
quan.luaitems file is enabled in theagent-item-filesconfiguration property:agent-item-files = share/mysql-proxy/items/quan.lua,share/mysql-proxy/items/items-mysql-monitor.xml
Check and set the
proxy-address,proxy-backend-addresses, andproxy-lua-scriptsettings are configured:proxy-address=:6446 proxy-backend-addresses = 127.0.0.1:3306 proxy-lua-script = share/mysql-proxy/quan.lua
For more information on these configuration options, see Section C.2.1, “MySQL Enterprise Agent Configurable Options”.
You may also need to make some additional changes to the security configuration on your server to ensure that queries are correctly reported to MySQL Enterprise Service Manager:
You must ensure that each user configured within your MySQL client application that connects through the agent/proxy and is required to report query analyzer information is allowed to connect to the server from the host on which the agent/proxy is running. When the user connects to the agent/proxy, and the agent/proxy connects to the server the host of the agent/proxy will be used as the identifying client host name during the connection.
WarningBecause the proxy is providing the immediate connectivity to the MySQL server, authentication must use the proxy hostname, not the client hostname.
To update your user credentials, you need to use the
GRANTstatement. For example:mysql> GRANT SELECT,UPDATE,INSERT on database.* to 'user'@'localhost' IDENTIFIED BY 'password';
The MySQL client application user must have
SELECTprivileges on themysql.inventorytable. This table contains the server UUID and is required to report the query analyzer data to the MySQL Enterprise Service Manager. To enable this, use theGRANToption:mysql> GRANT SELECT on mysql.inventory to 'user'@'localhost' IDENTIFIED BY 'password';
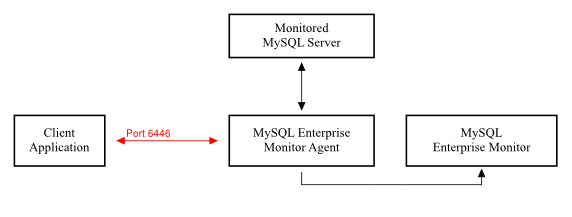
Generally, changing your MySQL client application is the easiest and recommended method. For example, given a typical structure like the one shown in the figure below, the client application would need to be modified so that it no longer communicated directly with the MySQL server, but to the agent/proxy.
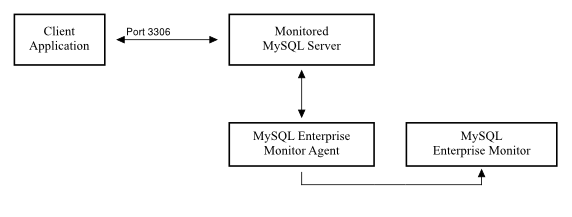
You can see an example of the structure when communicating via the agent/proxy below.
To enable query analyzer within your MySQL client application:
Make sure that the MySQL Enterprise Service Manager and your MySQL Enterprise Agent are configured and running.
Confirm the configuration of your agent by examining the contents of the
etc/mysql-monitor-agent.inifile within your installed Agent directory.Queries will be sent to the host specified in the
proxy-backend-addressesparameter, and the agent will listen for connections to be redirected to the server on the host name and port configured in theproxy-addressparameter.Now modify your MySQL client application to communicate with the address specified in the
proxy-addressparameter.Alternatively, if you do not want to modify your application directly, you can use iptables or firewall rules to redirect queries from the original host/port combination to the agent's port.
Because connections to the MySQL server will be coming from the agent/proxy, not the original host, the user credentials used must be have a suitable
GRANTstatement for connections fromlocalhost, or the host on which the agent/proxy is executing. The user name and password information will be passed on directly through the agent/proxy from the client to the server.Confirm that your MySQL client application still operates normally. There should be no difference between communicating directly with the MySQL server and communicating via the agent/proxy.
If you are using the mysql client to connect
to the agent/proxy and your backend servers, make sure that you
are communicating with the proxy over the right port. By
default, if you specify localhost as the host
name, then mysql will connect using the local
Unix domain socket, rather than the TCP/IP socket.
You can enforce mysql to use the right port
either by explicitly requesting the protocol type, or by using
the IP address rather than localhost. For
example, both of these command lines will start the client using
the right protocol:
shell> mysql --port=6446 --protocol=tcp
shell> mysql --port=6446 --host=127.0.0.1
It is recommended that you use one agent/proxy per MySQL server instance. The agent/proxy is not able to forward queries to multiple MySQL server backends.
When enabling Query Analyzer by changing the MySQL Server, you need to shutdown your server, edit the MySQL configuration file, and then restart MySQL. You will also need to change your Agent/proxy configuration so that the Agent/proxy is listening on the original MySQL TCP/IP port. To use this method:
Edit the
/etc/my.cnfor other MySQL configuration file and change or add theportsetting from it's current value (default 3306), to another value. For example:port = 3307
Shutdown your MySQL Server.
Startup your MySQL Server and confirm that is running.
Edit your MySQL Enterprise Agent configuration so that the agent/proxy is listening for connections on the original MySQL port:
proxy-address=:3306
proxy-backend-addresses = 127.0.0.1:3307
Stop and restart MySQL Enterprise Agent.
You should now be able to connect to your MySQL server through the MySQL Enterprise Agent by connecting on the original port:
shell> mysql --host=127.0.0.1
To analyse the queries captured by the agent/proxy, change to the Query Analyzer tab. You can see an example of the table on that page in the figure below.
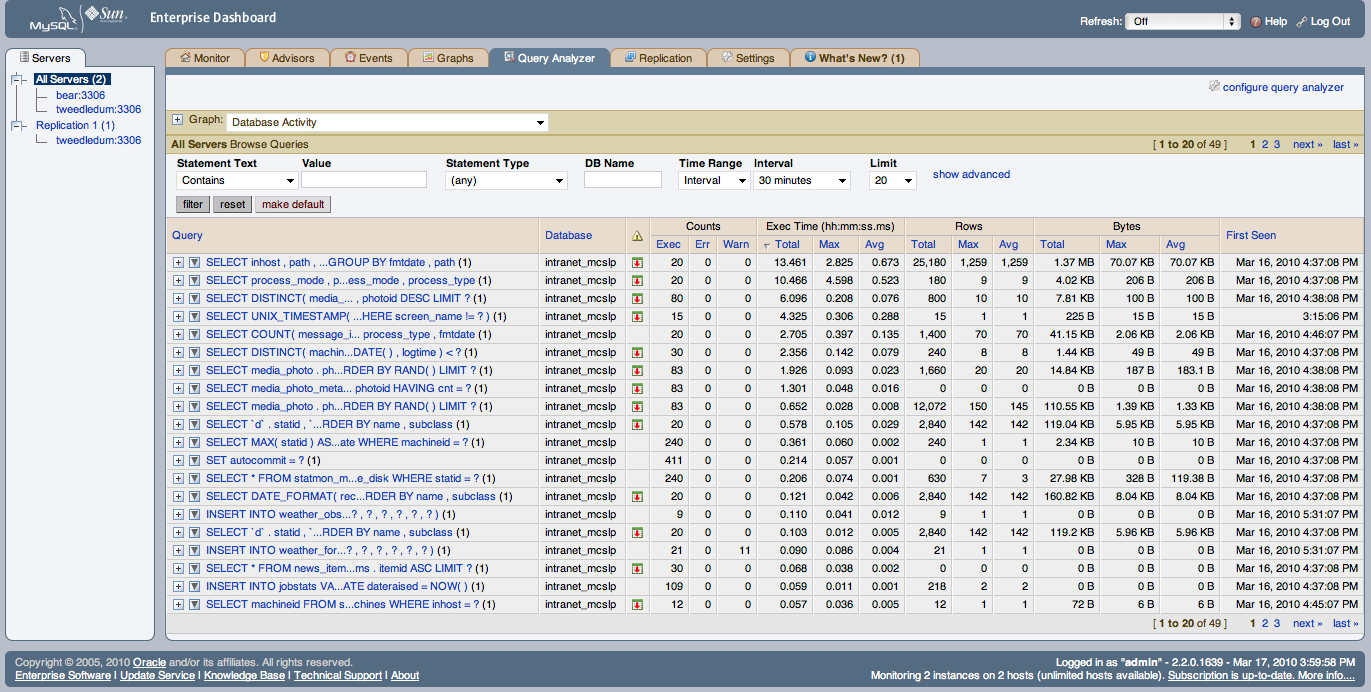
The main Query Analyzer table provides the summary information for all of the queries executed via the agent/proxy. The table will track all the queries submitted to the server via the agent/proxy. The table will show a maximum of 20 rows, and you can page through the list of queries by using the page numbers, or the next, previous, first, and last buttons. To filter the list of queries that are displayed, or to change the number of queries, see Section 3.2.4, “Filtering Query Analyzer Data”.
Each row within the table provides the statistical information for one normalized query statement. If you have configured multiple agent/proxies to accept and forward queries to different servers, then you can expand the server view. The summary information displayed is different depending on whether you have selected a server group or an individual server.
If you have selected a server group, then the information displayed is aggregated from across the entire group. The same query executed on multiple servers will show average, total and minimum/maximum information for that query across all the servers. If you select an individual server, then only queries executed on that server are included within the table.
For each row, the following columns are populated according to the selected filtering options. For example, if the filter have been configured to show queries within the last 30 minutes (Interval), then only queries executed during that time will be displayed, and the corresponding statistics, such as execution times, rows returned and bytes returned will be according to that 30 minute timespan.
Query: The normalized version of the query. Normalization removes the query-specific data so that different queries with different data parameters are identified as the same basic query.
The information is shown as one query per row. Each query row is expandable, and can be expanded to show the execution times for individual servers for that query.
Database: The default database in use at the time of the query. The database name may not match the database used within the query if you have have explicitly stated the database name in the query.
Execution notices: Highlights any specific issues experienced when running queries, including excessive table scans and bad index usage. These provide an immediate indication of a problem with a query that may require additional examination.
Counts: The number of times that the query has been executed. The column is sub-divided into three further columns, showing the number of executions of the query (Exec), the number of times an error has been reported for the query (Err), and the number of times a warning has been produced (Warn).
Exec Time: The execution time for all the matching queries. This is the time, for every invocation of the corresponding query, as calculated by comparing the time when the query was submitted and when the results were returned by the server. Times are expressed in HH:MM:SS.MS (hours, minutes, seconds, and milliseconds).
The Exec Time column is further subdivided into the following columns:
Total: The cumulative execution time for all the executions of this query.
Max: The maximum execution time for an execution of this query.
Avg: The average execution time for the execution of this query.
When looking at the information provided in this query, you should consider comparing the average and maximum execution times to see if there was a problem on a specific server or during a specific time period when the query took place, as this may indicate an issue that needs to be investigated. For more information, see Using Query Analyzer Data.
NoteDue to limitations in the counters used for monitor queries on Microsoft Windows, the time reported for short queries may be reported 0.000. This will be fixed in a future release.
Rows: The rows returned by the query. The column is sub-divided into the following columns:
Total: The sum total number of rows returned by all executions of the query.
Max: The maximum number of rows returned by a single execution of the query.
Avg: The average number of rows returned by all executions of the query.
Bytes: The number of bytes returned by each query. The column is sub-divided into the following columns:
Total: The sum total bytes returned by all executions of the query.
Max: The maximum number of bytes returned by a single execution of the query.
Avg: The average number of bytes returned by all executions of the query.
First Seen: The date and time the query was first seen within the given filter conditions.
You can sort the list of queries by clicking the column name. The direction of the sort (highest to lowest, or lowest to highest) is indicated by a triangle next to the currently selected column. The default is to sort the list of queries by the Total Execution time.
To help you and locate queries you can filter the list of queries using a variety of criteria. For more information on the filtering methods available, see Section 3.2.4, “Filtering Query Analyzer Data”.
To simplify the identification of a given query, you can create a query alias. The alias will be used in place of the normalized query text within the Query Analyzer table. To create an alias for a query, hover over the triangle link against the query. The maximum length for a query alias is 255 characters.
To get more detailed information about reported queries and their execution, see Using Query Analyzer Data.
If you click an individual query, a pop-up window will provide more detailed information about the individual query. You can see an example of this in the figure below. The available tabs within this window will depend on whether you have configured the more detailed query information. By default, you will always be provided the Canonical Query view.
If enabled, you may also view Example Query,
which provide more detailed data about a specific query, including
the data and parameters submitted. In addition, you may also
enable Explain Query, which provides you with
the ability to remotely execute an EXPLAIN
statement with the specified query and view the resulting
information. Finally, you can also view any graph data produced
during the execution of the query by using the
Graphs tab.
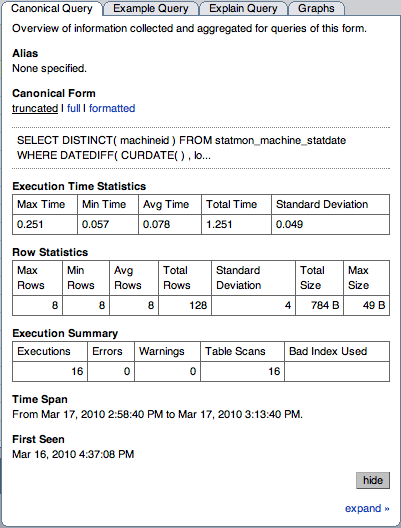
The Canonical Query tab:
The canonical view for a query provides three different views of the query, which can be changed using the links under the Canonical Form section. The
truncatedversion is a shortened version of the query. Thefullversion of the query is the entire query statement. Normalization removes the constants from the individual queries so that queries following the same logical structure are identified as the same basic query.In addition to the summary information given in the table, the Execution Time Statistics section provides you with more detailed execution time statistics, including the minimum time, maximum time, average time, total time and the standard deviation. The standard deviation will enable you to determine whether a particular invocation of a query is outside the normal distribution of times for the given query.
The Row Statistics provide more detailed contents on the maximum, minimum, average, total, and standard deviation for the number of rows returned by the query, and the total size and maximum size of the data returned. The time period for the total and average figures is shown under the Time Span header.
The Execution Summary section provides the summary data available in the main table, covering the execution count, and counts of the number of errors, warnings, queries that triggered table scans, and those that indicated a bad index use.
The First Seen reports when the query was first seen, whether or not this was within the indicated Time Span.
To close the query detail window, click the button.
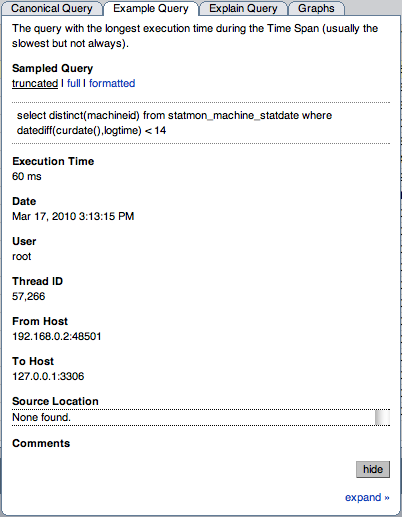
The Example Query tab:
The Example Query tab provides detailed information about the most expensive query executed, as determined by the execution time.
In addition to the full query, with data, that was executed, the tab shows the execution time, data, user, thread ID, client host and execution host for the given query.
For queries from any of the MySQL Enterprise Plugin for Connectors, the Source Location will contain the information from the Connector of where the query was generated.
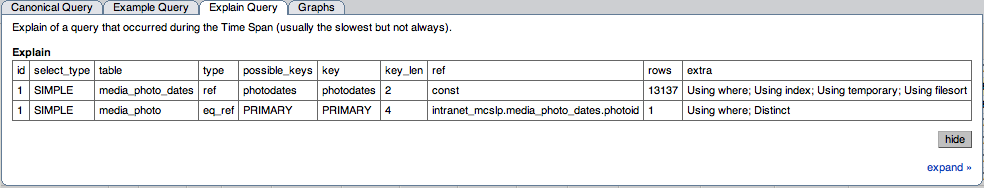
The Explain Query tab:
The Explain Query tab lets you view the output from running the query with the
EXPLAINprefix. For more information, seeEXPLAINSyntax.The Graphs tab:
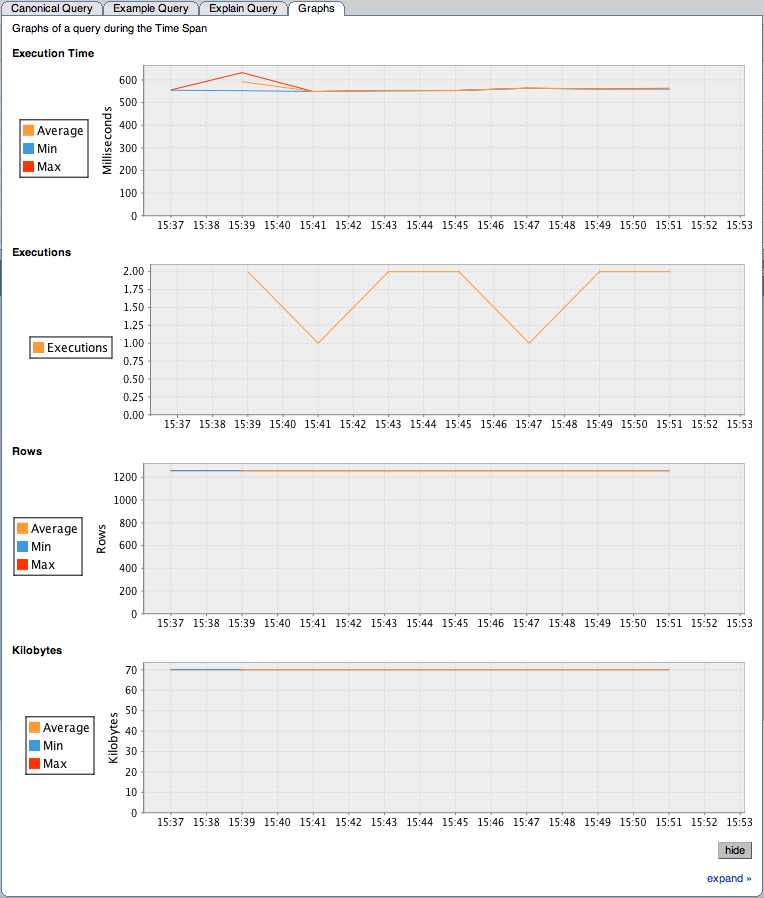
The Graphs tab shows key graphs over the selected time period for the example query. Shown are graphs of the Execution Time, Executions, Rows, and Kilobytes. These can be used to identify deviations from the normal values. Unlike the query-correlation graphs, these graphs shown only the query statistics over the given time period.
The MySQL Enterprise Dashboard supports correlated graphs so that you can compare the graphed execution parameters, such as the server load, thread statistics, or RAM usage, against the queries that were being executed by the server or servers being monitored at that time.
You can use the correlated graphs in two different ways:
By dragging and selecting an area on a graph as displayed within the Monitor over view tab, or the Graphs tab of the MySQL Enterprise Dashboard. When using either of these two tabs, you can drag and select any region on a displayed graph, and the display will change to the Query Analyzer tab, displaying the corresponding zoomed graph, and the associated queries being executed during the selected period.
You can select a graph to be displayed within the Query Analyzer tab. Open the Graph section, and use the pop-up list to select the graph to be displayed. You can see an example of this in Figure 3.10, “MySQL Enterprise Dashboard: Correlated Graphs”.
When using the correlated graphs, selecting an area within the graph will set the start and end time within the query filtering selection. You can combine with other filtering options, such as the Query Type, to zero-in on the queries that you want to examine.
To use the graphs in this manner, select a starting point and click, while holding down the button, drag a selection area to set the time-range for the query display. The time range that you have selected will be displayed above the graph as you select the area.
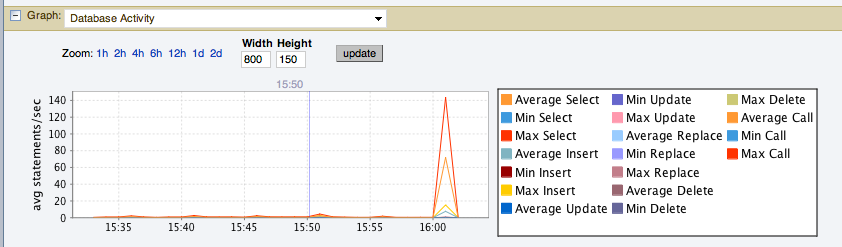
You can also explicitly zoom in an out of the displayed graph by using the links next to the Zoom label. You can select to show just an hour of the graph material, or larger ranges up to two days. At all times, the area on the graph highlighted in blue is the actual date/time range selected within the list of analyzed queries.
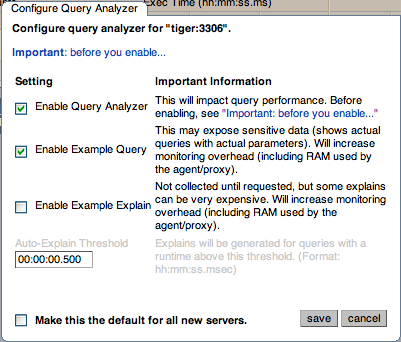
There are a number of settings related to the Query Analyzer data. You can configure the query analyzer operation by using the configure query analyzer link within the Query Analyzer tab, or through the button within the Manage Servers tab within the Settings tab. Both methods provide you with the same dialog:
Through either solution, the configuration options that you select are applied to the individual server or server group selected within the Serversnavigation panel.
There are three configuration options available through either method:
Enable Query Analyzer configures whether query analyzer should be enabled for this server or server group. If selected, query analyzer will be enabled. To disable, select the check box.
NoteThe Query Analyzer functionality may show as being enabled on a server, even though the modules within MySQL Enterprise Agent supplying query analyzer data may not have been enabled.
If Query Analyzer has been enabled, then you can additional configure the Example Query function by selecting the Enable Example Query checkbox. Enabling this option provides an additional tab when you open the Canonical Query window when clicking a query.
Enable Example Query allows the Query Analyzer to display more information about individual queries. When enabled, queries and their data items (rather than the canonical form shown by default) will be provided. Enabling this option may expose the full query statements and therefore may present a security issue.
With the Example Query option enabled, an additional tab within the query summary details is made available. For more information, see Section 3.2.1, “Getting Detailed Query Information”.
If you have enabled Example Query, then you can additional enable Example Explain, To enable this tab, select the Enable Example Explain checkbox.
Enable Example Explain provides another tab when viewing a query where you can view the output from
EXPLAINoutput from MySQL for the selected query. This will show the full query and how the query was executed within the servers.Enabling this option may add overhead to the execution of your server, as the server will run an
EXPLAINstatement each time it identifies a long running query. For more information, Appendix F, MySQL Enterprise Monitor Frequently Asked Questions.
To enable or disable query analyzer for an individual server, go to the Settings tab and click the link. To configure all the properties, click the configure query analyzer link next to server you want modify.
Alternatively, for each server, the Query Analyzer column shows the current setting, On or Off, and whether the Example and Explain functionality is enabled. To change any setting, click the current status to toggle between the On/Off position.
To disable or enable Query Analyzer for the selected servers, use
the or
enable query analyzer buttons within the
Settings tab. You must have selected one or
more servers from the list of available servers before selecting
these buttons.
You can use the options that you have just selected as the default for all new servers that register with MySQL Enterprise Service Manager by using select the Make this the default for all new servers checkbox. By default, when a new server registers with MySQL Monitor, the server is automatically configured to supply Query Analyzer data. This can have impact on the performance of your monitor and agent as it increases the amount of information supplied to the MySQL Monitor.
Configuration of Query Analyzer occurs through the button from within the Query Analyzer tab.
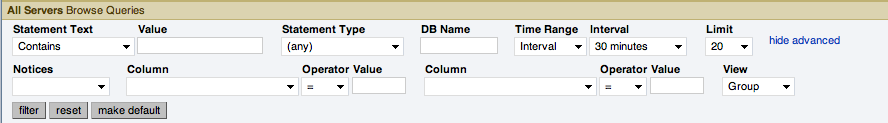
You can filter the queries shown within the Query Analyzer table by using the form at the top of the table. The different fields of the form are used to specify the parameters for the filter process. Once you have specified a filter, all the queries and related statistics shown within the Query Analyzer table are displayed in relation to the filter settings. For example, by default, the filter settings show the queries for the last 30 minutes. All the statistics shown are relative to the last 30 minutes, including average, maximum and execution counts.
The filter fields are:
The filtering functionality is available in a simple format, supporting simple statement and timing based filtering, and an advanced option allowing you to filter by specific columns within the query analyzer table.
The basic filter options are:
Statement Text and Value support text searching of the normalized query. For the search type you can specify either a basic text match (Contains), or a regular expression match (Regex). In addition to the basic text match, you can also search for a query that does not contain a particular string. For regular expression searches, you can specify whether the regular expression should match, or not match (negative regexp) the queries. Regular expressions are parsed using the standard MySQL
REGEXP()function. For more information, see Regular Expressions.NoteThe search is performed against the canonical version of the query. You cannot search against specific text or values within the parameters of the query itself.
Statement Type: Limits the search to statements of a particular type (
SELECT,LITERAL, etc.).DB Name: Limits the queries to those executed within a specific database. The database match is performed using the
LIKEmatch from the MySQL database, hence you can use the%and_characters to multiple and single character matches. For more information, see Pattern Matching.The Time Range menu selects whether the time selection for filtering should be based on the time interval (only queries recorded within the displayed time period are shown, using the Hours and Minutes pop-up), or whether the selection should be based on a time period (From/To), where you can select the time range to be displayed.
Using the Interval mode shows queries within the given time period from the point the graph was updated. For example, if you select 30 minutes, then the queries shown were captured within the last 30 minutes. If you updated the display at 14:00, then the queries displayed would have been captured between 13:30 and 14:00. Using interval mode limits the timespan for the filter selection to a maximum of 23 hours and 59 minutes.
Using the From/To time range lets you show queries between specific dates and times. Using this mode you can show only the queries received during a specific time span, and you can display the query history for a much longer time period, for as long as you have been recording query analysis information.
Limit specifies the number of queries to be displayed within each page.
To use the advanced filtering techniques, click . This provides additional filters:
Notices: Filters on the notices column, allowing you to filter the list to show only the queries that did not raise a notice, indicated a full table scan, or indicated that a bad index was used.
Two column filters are provided, which allow you to filter the queries based on specific values within any of the columns shown in the Query Analyzer report list.
To use the column filters, you must specify the Column that you want to filter on, the Operator to use when performing the comparison and the Value that you want to compare.
For example, to filter by showing all the queries that return more than 100 rows on average, set the Column to
Average
          Rows
, the Operator to>=, and the Value to 100.The View selection determines whether the information should be returned on a group basis, where an aggregate of the same query executed on all monitored servers is shown, or on a Server basis, where queries are summarized by individual server. If the latter option has been selected, the table includes an additional column showing the server.
All the filter settings that you specify are used collectively, that is, all the specified filter options are used to match against the list of queries.
When you have set your filter parameters, you can update the Query Analysis display by clicking the button. To reset the fields to the default settings click the button.
If you want to make the filter options that you have set the default when viewing the Query Analyzer page, click the button. The settings will be retained for the current user only.
If you are having trouble with Query Analyzer, either because the information is not being shown or the full range of queries that you expect are not appearing in the Query Analyzer page then there are a number of systems you can check.
To confirm that your system is correctly configured for Query Analysis, check the following:
Confirm that the agent is running by checking the Agent log and the status of the server within MySQL Enterprise Service Manager
Check the configuration of the agent. You must confirm the following:
The
pluginsparameter within the main configuration file,mysql-monitor-agent.ini, must contain theproxyplugin:plugins=proxy,agent
The
agent-item-filesparameter within the main configuration file,mysql-monitor-agent.ini, must specify theshare/mysql-proxy/items/quan.luascript:agent-item-files = share/mysql-proxy/items/quan.lua, » share/mysql-proxy/items/items-mysql-monitor.xmlThe proxy configuration parameters must point to the MySQL server where you want your queries to be sent. For example, if you are running your agent on the same host as your MySQL server then you might have the following lines in your
mysql-monitor-agent.inifile:proxy-address=:6446 proxy-backend-addresses = 127.0.0.1:3306 proxy-lua-script = share/mysql-proxy/quan.lua
The above configuration can means:
The agent/proxy will listen on the current machine, using port 6446 (
proxy-address).The agent/proxy will send all queries received on to the host
127.0.0.1on port3306(the standard MySQL port), as per theproxy-backend-addressesparameter.
You can see a sample complete configuration file (
mysql-monitor-agent.ini), using the127.0.0.1as the MySQL backend server, and reporting to a MySQL Enterprise Service Manager calledmonitor:[mysql-proxy] plugins=proxy,agent agent-mgmt-hostname = http://agent:password@monitor:18080/heartbeat mysqld-instance-dir= etc/instances agent-item-files = share/mysql-proxy/items/quan.lua,share/mysql-proxy/items/items-mysql-monitor.xml proxy-address=:6446 proxy-backend-addresses = 127.0.0.1:3306 proxy-lua-script = share/mysql-proxy/quan.lua agent-uuid = a3113263-4993-4890-8235-cadef9617c4b log-file = mysql-monitor-agent.log pid-file=/opt/mysql/enterprise/agent/mysql-monitor-agent.pid
Confirm that you can connect through the agent proxy to your backend MySQL server. You can do this by checking with the MySQL client. You must specify the same options as you would if you were connecting to the original server, including specifying the same user and password information:
shell> mysql -h 127.0.0.1 --port 6446 --user=root -p
Enter password:
Welcome to the MySQL monitor.  Commands end with ; or \g.
Your MySQL connection id is 299239
Server version: 5.0.60-log Gentoo Linux mysql-5.0.60-r1

Type 'help;' or '\h' for help. Type '\c' to clear the buffer.

mysql>
Check that your MySQL client application is configured to use the configured proxy port, instead of the real MySQL port when sending queries.
Confirm that Query Analyzer enabled for your host. For more information, see Section 3.2.3, “Query Analyzer Settings”.