6 Generating Oracle Database Firewall Reports
This chapter contains:
About Oracle Database Firewall Reports
This section contains:
Reports Generated from the Administration Console
From the Administration Console, you can produce Sarbanes-Oxley (SOX), Payment Card Industry (PCI), Data Protection Act (DPA), Gramm-Leach-Bliley Act (GLBA), and Health Insurance Portability and Accountability Act (HIPAA) reports. These reports are provided by default, giving full traceability of all essential information over a selected date and time range.
You can specify which of these reports are required for a protected database. To do so, display the Monitoring page in the Administration Console, click List in the Protected Databases menu, click the database name, and then select the required check boxes.
Where appropriate, information is displayed graphically. This improves clarity, highlights anomalies, and enables easy interpretation of trends.
Generating Reports
You can generate reports using the Reports menu in the Reporting tab. The reports can be displayed as a PDF document or Excel spreadsheet. If you schedule a report, Oracle Database Firewall enables you to e-mail the report to one or more recipients. You can schedule the report to be sent to e-mail recipients at specific times, for example, once a day. You can configure a reporting user account, which is only allowed to log in to the Management Server Administration Console and run reports. Other than this user, all valid Database Firewall system administrators can generate reports.
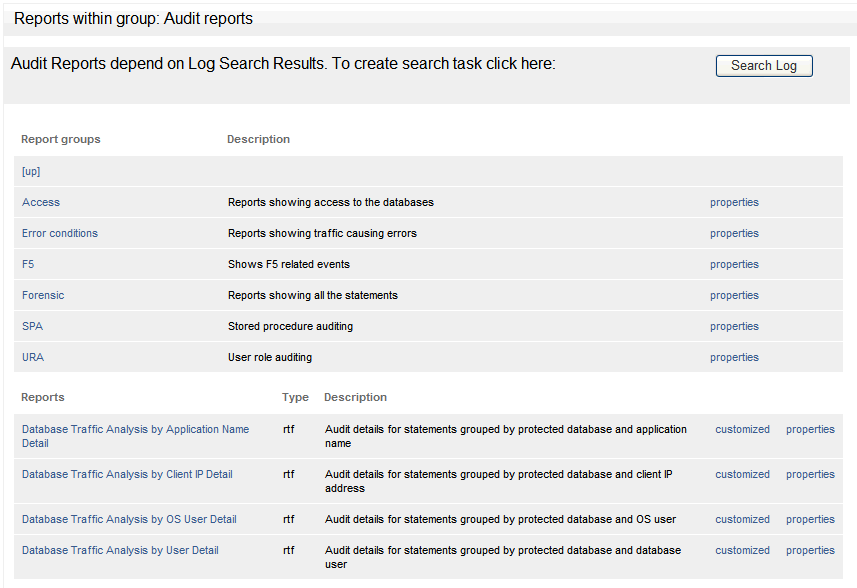
Figure 6-1 shows the Audit reports page, accessible from the Reports page of the Management Server Administration Console.
Figure 6-1 Audit Reports Page of the Management Server Administration Console

Description of "Figure 6-1 Audit Reports Page of the Management Server Administration Console"
Generating Audit and Summary Reports
Clicking List displays two top-level report groups:
-
Audit reports: These are reports that include only the data included in a selected log search (see "Accessing the Traffic Log"). Click Audit reports, then the customized link to choose the log search to use for the report. Click the name of the report to generate the report. Audit reports are refreshed each time they are run.
-
Summary reports: These are reports that extract the required information from the traffic log while the report is being produced. Only "summarized" data (see the next section) is used.
There are many more summary reports than audit reports. Reports can take longer to generate depending on the data included.
To generate a report:
-
Log in to the standalone Database Firewall or Management Server Administration Console.
See "Logging in to the Administration Console" for more information.
-
Select the Reporting tab.
-
From the Reports menu, select List.
The Reports page displays the top-level set of report groups. Each group can contain reports and other groups. The Description column explains the types of report that the group contains.
-
Drill down through the report groups until the report you want to produce is listed in the Reports column of the page.
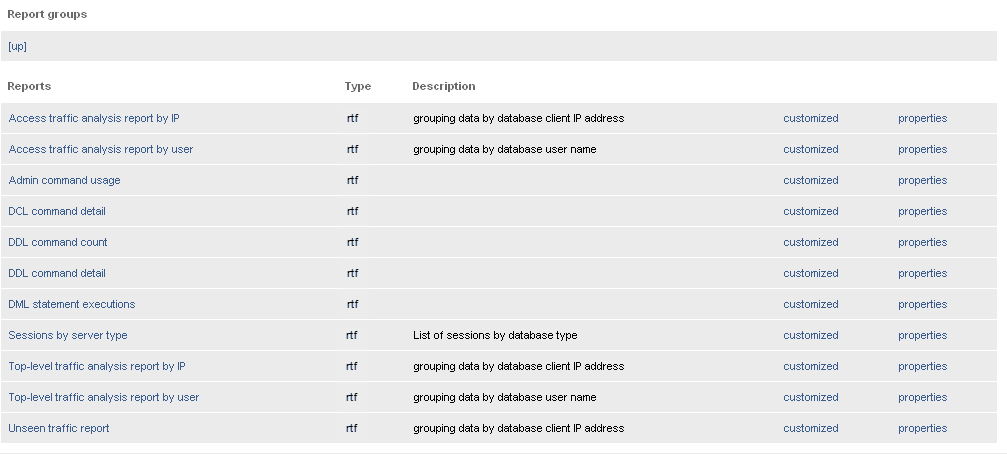
The following screen shows the contents of the Summary reports, General reports, Data access group.

Description of the illustration report_groups.gif
If you want the most recent data to be made available for reporting purposes, click Summarize Now. This makes the data in the traffic log files available for reporting. Automatic summarizing takes place every hour.
Clicking [up] displays the previous report group.
-
If you want to produce a report using default parameters, such as a reporting period of one week from the current time, click the name of the report in the Reports column.
Alternatively, if you want to specify the reporting period or other parameters (depending on the report type), click customized.
The retained reports link is displayed if a copy of the report has been saved on the Oracle Database Firewall Management Server using the Retain button. The link enables you to view or delete retained reports of that type.
You can use the properties link to change the title or description of the report, upload a new report template, or download the existing one.
-
The report is displayed, as shown next.
The Oracle Database Firewall Management Server caches (that is, temporarily stores) the report. If you generate the report again within half an hour, the cached report is displayed.
The following four buttons are available on the page:
-
Retain: Retains a copy of the report on the Oracle Database Firewall Management Server. You can view or remove a retained report by clicking the retained reports link (see the preceding section). Retained reports are included in any configuration archives.
-
Schedule: Allows you to schedule the report to be created automatically at regular intervals (see "Scheduling Reports").
-
Customize: Allows you to change the reporting period or other parameters. Parameters depend on the report being generated.
-
Refresh: Generates the same report again. This button is active when you access the report from the list after the report has been generated.
-
Update report: Generates the report with any new parameters you selected.
-
-
Select the report parameters:
-
The parameters are different depending on the report selected.
-
For all free form parameters, you can use POSIX extended regular expressions to define the parameters. Here are some examples:
-
eereturns any data containing the charactersee(Green, Lee, Feeney, etc.) -
^Steven$returns data with an exact match (Steven) -
Steven | Rogerreturns data containing either Steven or Roger
-
-
By default, the report is displayed as a PDF document. To generate the report in XLS format, select Microsoft Excel 2007 Worksheet (XLSX) from the Report format drop-down list, then click Update report. Clicking the <
report name>.xlsxlink in the bottom-left corner of the screen allows you to view or save the report, depending on your browser settings.
-
Options in the Reports Menu
The following options can be displayed in the Reports menu on the left side of the screen:
-
Main Group: Displays the top-level report group.
-
List: Displays the contents of the last group visited.
-
Add Report: Lets you add a custom report
-
Display Report: Displays the selected report
-
Retained: Displays retained reports of the currently-selected type.
-
Properties: Enables you to change the title or description of the report.
-
Scheduled Reports: Lists all scheduled reports that have been set up.
Adding Your Own Reports
You can add your own custom reports using Oracle Database Firewall and Oracle BI Publisher inlcuded with the Database Firewall installation. You will need a data definition file (XML format) and a report template (RTF format). This section describes how to extract these files from an existing Database Firewall report and use them for your own report. You will need to refer to Oracle Business Intelligence Publisher documentation for how to customize the report template.
Note:
You can use Oracle Business Intelligence Publisher embedded within Database Firewall to run or modify the layout of existing reports. However, in order to add your own reports, you must have a Full Use license for Oracle Business Intelligence Publisher.To add a report starting from existing data definition and template files:
-
Click the Reporting tab.
-
Drill down to an existing report, and click its properties link.
-
At the bottom of the properties page, right-click the Report Data Definition and Report Template links to save both files on your computer.
-
Customize the data definition file (an XML file) as necessary. (You will customize the report template later.)
-
Click the Reporting tab, then click a report group (such as Summary Reports), or drill down through the groups until you get to a group where you want to add a new report.
-
In the Reports menu on the left, click Add Report, enter a title and optional description, and then click Add.
-
Click the upload link for the Report Data Definition, and upload your data definition file into the new report.
-
To generate sample data to use for customizing the report template, in the Reports menu on the left, click Display Report, and then click Generate Sample Data.
Sample data for the new report is generated based on the data definition file you uploaded. A link to the sample data file appears at the bottom of the page.
-
In the new report, right-click the sample data file link and save it to your computer.
-
Use Oracle BI Publisher to customize the report template you downloaded from an existing report, using the sample data you generated in the new report.
Refer to Oracle BI Publisher documentation available from this page:
http://www.oracle.com/technetwork/documentation/index.html. -
To upload the custom report template into the new report, locate it in the report list in Database Firewall, and then click its properties link.
-
Click the upload link for the Report Template, upload the template, and then click Save.
Scheduling Reports
A scheduled report is an audit or summary report that is generated automatically at a specified time. Optionally, the report can be set up to run automatically every hour, day, week, etc. A scheduled report is sent as a PDF document or Excel spreadsheet to specified e-mail addresses. The settings can be different for each report you set up.
To schedule a report:
-
Log in to the standalone Database Firewall or Management Server Administration Console.
See "Logging in to the Administration Console" for more information.
-
Select the System tab.
-
Select Email Configuration to ensure that the SMTP e-mail settings are configured.
See Oracle Database Firewall Administration Guide for more information about configuring the system settings.
-
Generate the required report, as described previously. See "Generating Audit and Summary Reports" for details of how to do this.
-
Select the report parameters, including the report period and the format of the report.
-
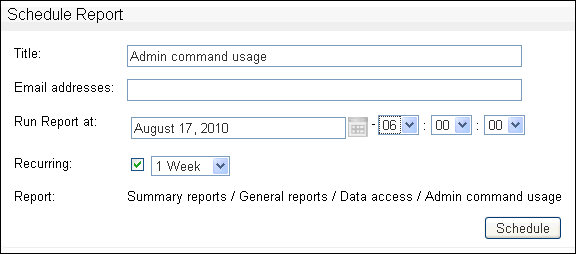
Click the Schedule button displayed at the top of the report. The following page is displayed.
-
Complete all fields, and click Schedule.
You must enter at least one email address. Separate several email addresses with spaces.
The Title is displayed in the list of scheduled reports that are set up and in the title of the report e-mail. The report will now automatically run according to the defined schedule.
-
You can display a list of scheduled reports that have been set up by selecting Scheduled Reports in the Reports menu. For example:
-
Clicking the name of a report allows you to delete or edit the report schedule.
How the Security Index Formula Is Calculated
For reports that display a security index, the index is calculated as follows:
Security Index = Σ (Threat severity (cid) x Frequency (cid) ) / 5
In this specification:
-
Threat severity is the threat severity of the cluster ID, as set in the Analyzer (range 0 to 5).
-
cid is the cluster ID. All clusters that occur over the specified time period are included in the calculation.
-
Frequency is the percentage of all statements recorded over the specified period that match the cluster.

