5 Accessing and Viewing the Traffic Log
This chapter contains:
Accessing the Traffic Log
This section contains:
Accessing Traffic Logs
From time to time, you may want to recover data from the traffic log for auditing purposes, or to investigate possible attempted attacks. The traffic log stores details of all logged SQL statements.
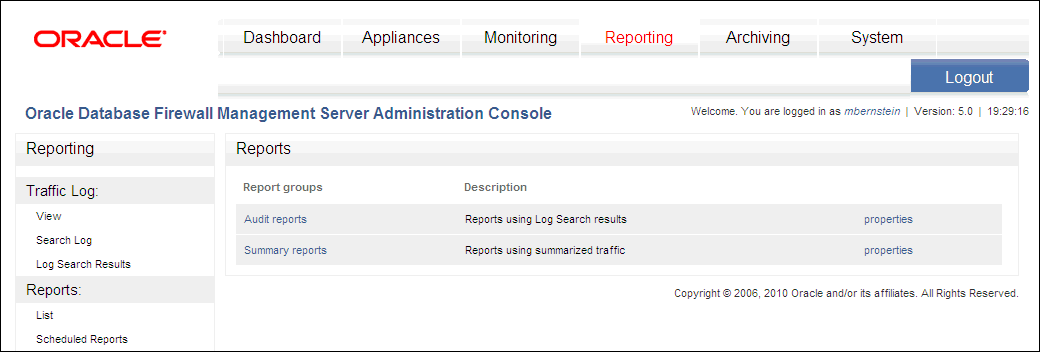
To do so, log in to the standalone Database Firewall or the Management Server Administration Console, select the Reporting tab, and use the Traffic Log menu in the Reporting page to view reports, search logs, and find log search results.
Figure 5-1 shows the Traffic Log page of the Administration Console.
The Traffic Log menu contains three options: View, Search Log and Log Search Results, as described in the following sections. To learn how to log in to the Administration Console, see Oracle Database Firewall Administration Guide.
Viewing Logged Traffic
Clicking the View button, followed by clicking Start, displays logged traffic (the latest information may take up to five minutes to display). The feature is automatically switched off after one hour to prevent loss of performance. A Filter button is available to filter the results.
Searching for Traffic Logs
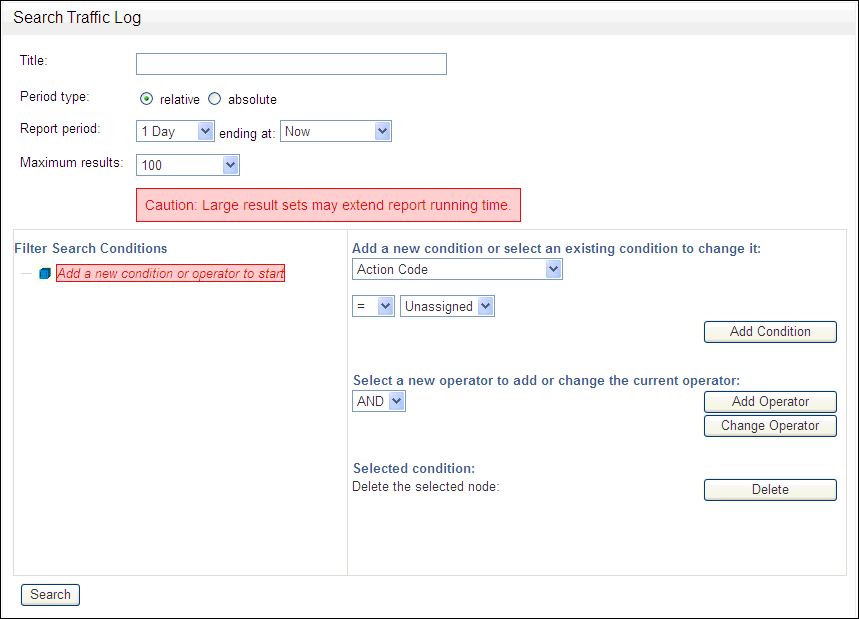
Figure 5-2 shows the Search Traffic Log page of the Administration Console. You can use this option to retrieve a range of records from the traffic log for reporting purposes.
-
Title: Enter a title for the report (for example,
Traffic 1st-2nd March). -
Period Type: Choose relative if you want to retrieve a set of records that occurred with a period that is relative to the current date and time. Choose absolute if you want to retrieve a set of records that occurred within a fixed period.
The following is displayed if you choose relative:
-
Report Period: If, for example, you choose 1 Week and Now - 1 Hour, and the report is generated at 18:00, all records for one week prior to 17:00 will be retrieved. You may want to use the relative option for scheduled reports (see "Generating Audit and Summary Reports"), because the period of report is automatically adjusted according to the time that the report is generated.
The following is displayed if you choose absolute:
-
Timerange begin/Timerange end: Use these options to specify the fixed time period.
-
Maximum results: You can limit the number of results to return. This can help to reduce the length of time required to retrieve records. The earliest records are retrieved if the limit is reached.
-
Search Conditions: You can use the Search Conditions panel to filter the records to retrieve and reduce the time taken for the process to complete. For example, you could choose to return only records that have a threat severity greater than "moderate", or those that have a threat severity greater than "moderate" and belong to the "sales" database. The panel offers a high degree of flexibility to customize the search conditions to your exact requirements. All results are returned if no filter is specified.
You can add search conditions by using the menus, options and fields in the right-hand side of the panel. The tree view on the left-hand side of the panel shows the search conditions that are set up and defines the logical operations between those conditions.
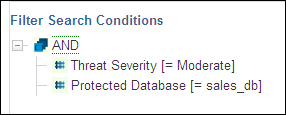
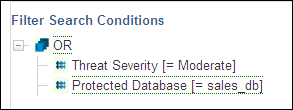
Each operator (AND, OR, NOT) in the tree view operates on the conditions at the next level below.
Figure 5-3 shows how the AND operator appears for a traffic log search condition. In this example, only records for the protected database sales_db that have a threat severity greater than moderate are retrieved.
Figure 5-3 Traffic Log Search Using the AND Operator Condition
Description of "Figure 5-3 Traffic Log Search Using the AND Operator Condition"
Figure 5-4 shows the OR operator search condition, which retrieves records that have a threat severity greater than moderate, and refer to the sales_db database.
Figure 5-4 Traffic Log Search Using the OR Operator Condition
Description of "Figure 5-4 Traffic Log Search Using the OR Operator Condition"
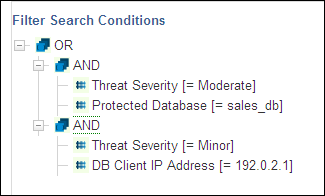
Figure 5-5 shows the OR and AND operator search conditions, which retrieve records that reveal a moderate threat severity level for the sales_db database and a minor threat severity level for a database client IP address.
Figure 5-5 Traffic Log Search Using the OR and AND Conditions
Description of "Figure 5-5 Traffic Log Search Using the OR and AND Conditions"
To define a search condition:
-
Log in to the standalone Database Firewall or Management Server Administration Console.
See "Logging in to the Administration Console" for more information.
-
Select the Reporting tab to display the Reporting page.
-
From the Traffic Log menu, select Search Log.
-
In the Filter Search Conditions area, select an operator (for example, AND) from the Select a new operator to add or change the current operator list, and then click Add Operator.
-
If you want nested conditions, as shown in Figure 5-5, select the top level condition (in this case, OR), select a new operator, and then click Add Operator.
-
To add one or more conditions under each operator:
-
Select the operator to which you want to add a condition.
-
In the Add a new condition or select an existing condition to change it list, select the condition (for example, Threat Severity), and then set the operator (for example, Moderate).
-
Click Add Condition.
-
-
To start the search, click the Search button.
Clicking Search displays the Searches page, which shows the current progress and details of the search. The Searches page is also accessible by clicking Log Search Results in the Traffic Log menu, as described next.
Viewing the Log Search Results
Figure 5-6 shows an example of the results from clicking the Log Search Results button in the Traffic Log menu in the Reporting page.
The displayed Status updates automatically. For example, from "running" to "completed". The page can list multiple searches.
Clicking a title displays the statements included in that search. You can produce an audit report of the results by clicking the Report button. (A Filter button is available to filter the results.) A list of available audit reports is displayed; selecting one of these generates the report using only the data included in the log search results. You also can generate audit reports from the Reports menu. See Chapter 6, "Generating Oracle Database Firewall Reports," for more information.
In the traffic log, you can expand each record to display attributes such as the action code, logging level, database type, cluster type and the origin of the attribute values (Oracle Database Firewall and/or F5 system).
Symbols to the right of the word statement indicate whether the statement contains attribute values that have originated from the Oracle Database Firewall system, F5 system, or both.
The value is the attribute value and the symbol under origin indicates that the attribute value has originated from the Oracle Database Firewall system.
Oracle Database Firewall Administration Guide describes the traffic log attributes in detail.
Log Search Results and Scheduled Reports
If you schedule multiple audit reports based on the same set of log search results, you should follow these guidelines to obtain meaningful data as well as make sure that reports are generated as scheduled:
-
To have consistent data against which to compare multiple reports, schedule reports that use the same log search results to run at the same time. This ensures that the same time period and log data is used for these reports.
-
Generating log search results can take a long time. Keep this in mind when scheduling reports to run at different times, since log search results will be regenerated before each unique scheduled time for reports that use them. If you have too many scheduled time periods for running reports, they may not be generated due to the time it takes to run log search results.
Viewing the Traffic Log for Database Response Monitoring
You can view the database response information by opening the traffic log (see "Accessing the Traffic Log") and examining, in particular, the Transaction Status section.
The Failure Count attribute in the Database Firewall Analysis section indicates that this is the first consecutively-failed login attempt.
See Also:
Oracle Database Firewall Administration Guide for detailed information about the traffic log attributesThe Response Text attribute shows the detailed error message generated by the database. The text in this example refers to a table not found. Note that this attribute contains responses only if Full error message annotation is selected in the database Response Monitoring settings. (To change this setting, you must reconfigure database response monitoring. See Oracle Database Firewall Administration Guide.)
