| Oracle® Enterprise Data Quality for Product Data Application Studio Reference Guide Release 5.6.2 Part Number E23601-03 |
|
|
View PDF |
| Oracle® Enterprise Data Quality for Product Data Application Studio Reference Guide Release 5.6.2 Part Number E23601-03 |
|
|
View PDF |
This chapter explains the basic concepts of creating, editing, and using DSAs.
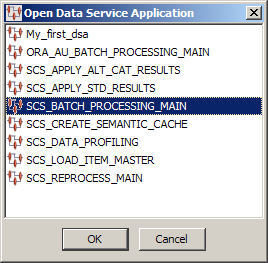
If this is the first time you have started the Governance Studio, the startup window appears blank as in the following figure; otherwise, the results from the last job run are displayed for your selection as in the following figure:
The following steps illustrate how to create a new DSA:
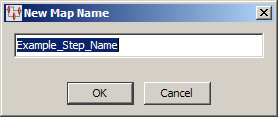
From the File menu, click New… create your new DSA.
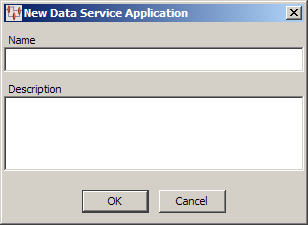
Enter the unique name for this DSA. In the Application Studio, entering a space results in an underscore.
Enter a description for this DSA; a description must be specified.
Click OK. The Application Studio creates your new DSA.
Your new DSA is located in:
\Documents%and%Settings\%USERNAME%\Application%Data\DataLens\data\workflow
Your DSA opens and is now ready for use.
There are three types of DSA building components and the use of each is described in this section:
Processing Steps Folder
Data Input Folder
Data Output Folder
Processing your input data can take on a myriad of different steps. You can create a simple DSA that only looks for a minimum of data matching or one that vigorously reviews the data for matches, duplication, and enriches it. This section describes how the processing nodes can be used to process data.
The core processing steps are the foundation of transforming data. These steps are used to define how the input data will be manipulated in preparation for output formatting. You can add as many core processing steps as needed to transform your data effectively.
The addition of core steps is a simple by selecting a Core Step node from the Map Component Tree pane and dropping it into the Graphical DSA Builder pane to the right of an input node.
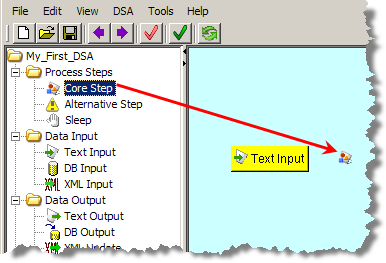
The Core Processing Step dialog is displayed so that you can begin to build the step.
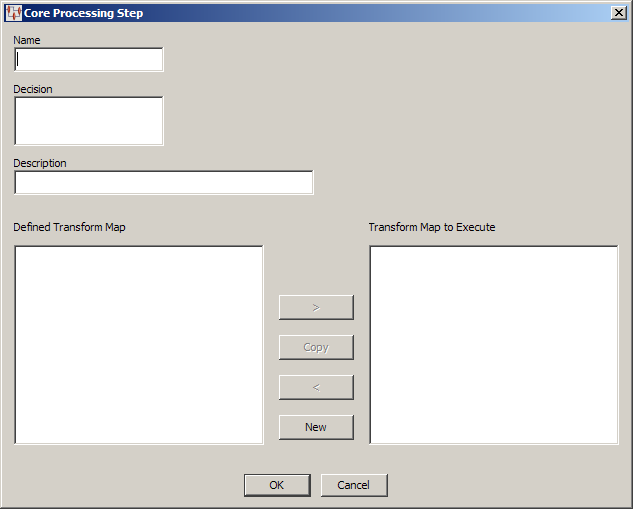
Use this dialog as follows:
Enter a name for the step. Spaces are automatically converted to underscores.
Enter a brief description of the function this step will perform in the Decision field.
Tip:
Use the Enter key to create a line feed in this field; otherwise, a left-right scroll bar appears.Enter a more informative description of the step to make step differentiation easier in future. This is very useful in large DSAs that contain numerous similar steps.
Note:
There is no character limit for this field though when the DSA is loaded this description is truncated to 255 characters. While the entire description is retained for the step, the truncated description is used as a reference to the step.If you have already defined one or more Transformation Maps, they are listed in the Defined Transformation Map list. You can choose to select one of these maps to be executed by this step or you can click the New button to create a new map.
Creating a new map automatically populates the resulting dialog with the name of the Transformation Map as the same name as the core step.
You can accept this default or enter the name you want to use, and then click OK.
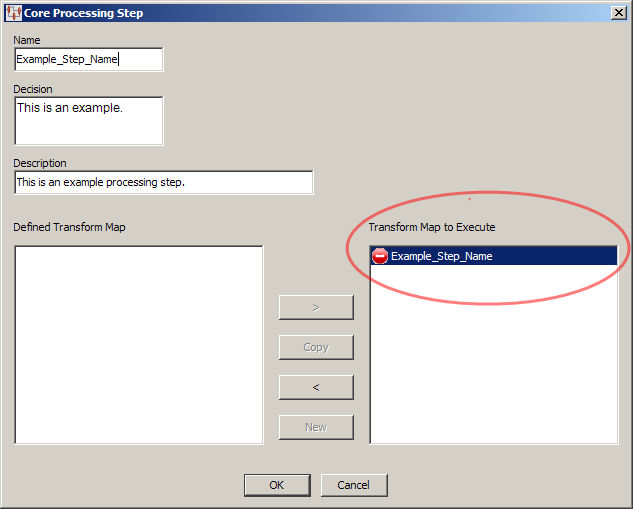
The Core Processing Step dialog is updated and the new map is listed in the Transformation Map to Execute list.
Click OK to accept the step you have defined.
This adds the new core processing step to the Graphical DSA Builder pane.
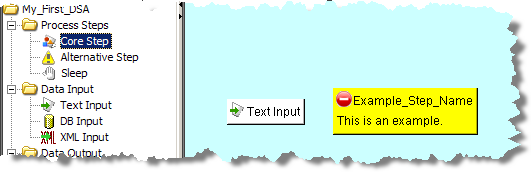
The step will have a warning icon associated with it to inform you that a Transformation Map has not yet been created for the step.
Add the input data to the core step by dragging the Input node and dropping it onto the core step.
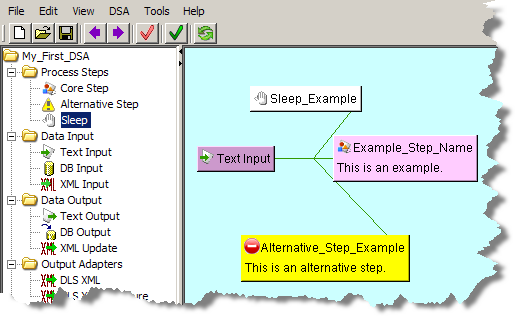
Alternative steps receive items identified as exceptions by a core step in the process. These steps are added the same way as core steps as previously described, and are then connected to core steps by dragging the alternate step onto the core step.
The Application Studio adds a route line between the two nodes. It is important that connect alternate steps to core steps prior to defining the map for the alternate step.
Note:
If you do not create an alternative step for exception data handling, the exceptions are discarded and so are not processed or output in any form.You can use a sleep (wait) step in your processing schema to tell the DSA to halt for a predetermined amount of time. The addition of these steps can help you in debugging your DSA, allow a particular step that operates slowly the time to complete, or to aid in a processing race condition.
Sleep steps are added anywhere in the processing schema to any process step as follows:
Drag a Sleep node from the Map Component Tree pane and drop it into the Graphical DSA Builder pane above and to the right of the step that you want to wait.
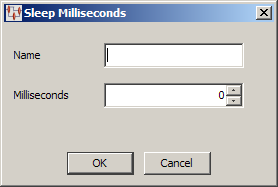
Enter a name for this sleep step. Since there is no description for the step, ensure that the name will differentiate it from any other sleep steps that may add.
Use the arrows to select or enter the sleep time. The sleep time is in milliseconds so be sure that you set the correct amount of wait time needed. For example, one minute is 60000 milliseconds.
Only the name of the step appears on it. However, the tooltip that appears when you hover over a sleep step is comprised of the name and number of milliseconds for which the step is set.
Click OK.
Drag and drop the sleep step onto the processing step you want to wait, which connects the two steps.
The first step in any DSA is to identify how data is the input type. There are three different types of data input containers used in the Application Studio: text, database, or XML. Only one type of container can be used in each DSA though the Transformation and Decision Maps that you add to the DSA can use all three types of data input.
All types of data input nodes are added to a DSA in the same manner as in the following example:
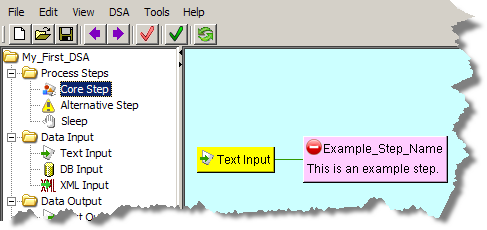
From the DSA Component Tree pane, in the Data Input folder, drag an Input node (Text, database (DB), or XML) into the Graphical DSA Builder pane as in the following example:
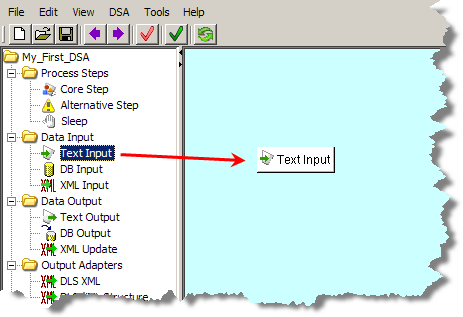
The Input node is connected to processing steps by dragging and dropping it onto the appropriate step. One Input node can be connected to numerous processing steps because it is the data source.
You can rename the text input node or change the description, by right-clicking the input node, and selecting Edit Step.
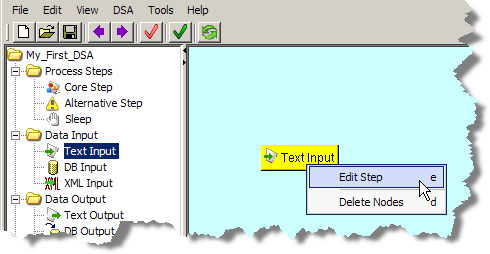
The Edit Step dialog is displayed. You can modify the text input name and the description for this input, by changing the text in the fields of the dialog, and then clicking OK.
Note:
There is no character limit for the Description field though when the DSA is loaded this description is truncated to 255 characters. While entire description is retained for the step, the truncated description is used as a reference to the step.Input nodes can be deleted in much the same manner by right-clicking a node and then selecting Delete Nodes. Use this option with care as there is no confirmation prompt, and the node is immediately removed from the DSA. If the Input node has been joined to other nodes in the DSA, all ties are severed when the node is deleted.
The final step in DSA creation is to form the data as output for use in other parts of Enterprise DQ for Product. You should create an Output node for each Processing Step, including Alternative (exception) Steps.
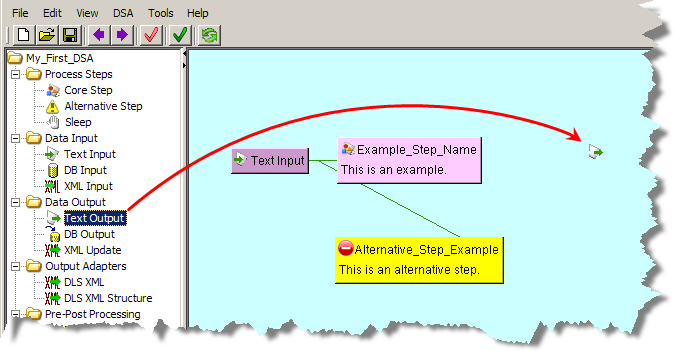
From the DSA Component Tree pane, in the Data Output folder, drag an Output node (Text, DB, or XML) into the Graphical DSA Builder pane to the left of a processing step as in the following example:
The Output Step dialog is displayed so that you can begin to build the step.
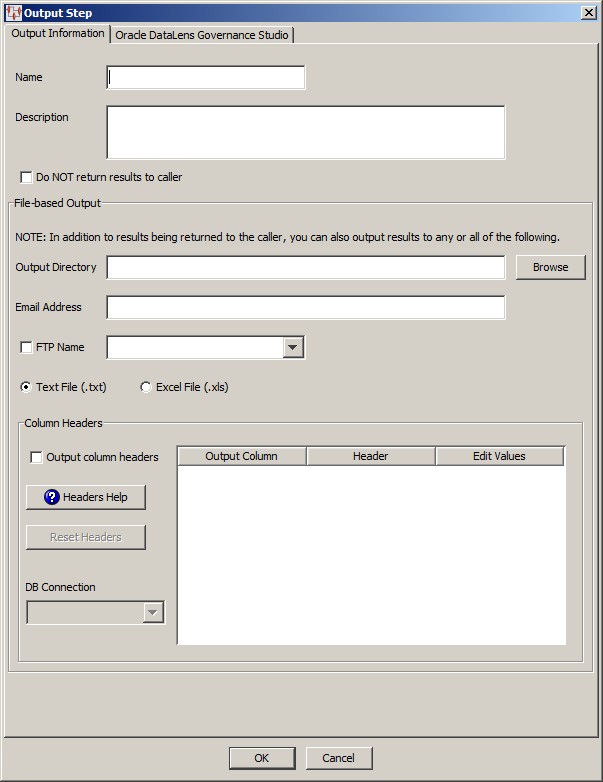
Initially, it is easiest to enter a name and description for the Output step, and click OK.
Note:
There is no character limit for the Description field though when the DSA is loaded this description is truncated to 255 characters. While entire description is retained for the step, the truncated description is used as a reference to the step.This allows you to connect a Processing Step to this Output Step by dragging the appropriate Processing Step onto the Output Step.
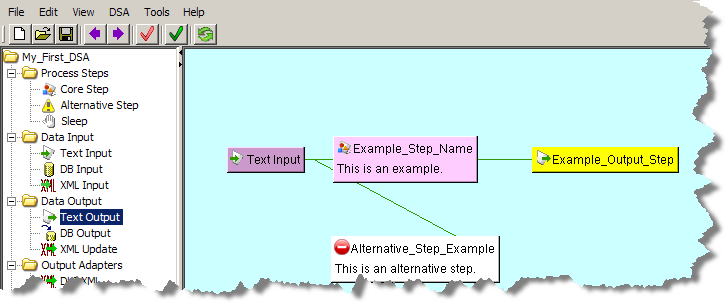
Connecting the end-to-end processing (input, processing, and output) so that the Column Headers section of the Output Step dialog is populated and ready for you to use by editing the output step as described in the following section.
You can edit an Output Step by right-clicking on it and selecting Edit Steps. The Output Step dialog is displayed so that you can edit the step.
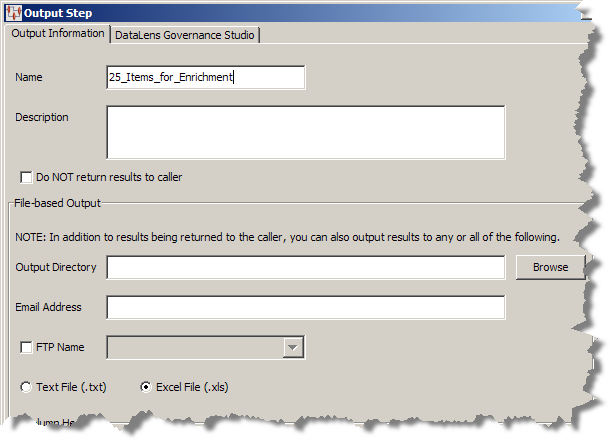
Modify the Output Information tab as follows:
Enter a description of the output step in the Description field.
Note:
There is no character limit for the Description field though when the DSA is loaded this description is truncated to 255 characters. While entire description is retained for the step, the truncated description is used as a reference to the step.Select the Do NOT return results to caller check box only if you do not want the data output of this step to be available to the Governance Studio.
Caution:
Returning the results of the step to the caller results in a job whose data you must retrieve or delete. Failure to do so can result in an Oracle DataLens Server crash once the server memory is exhausted. The memory can be exhausted from many small jobs that are not retrieved because each DSA job that is below the DSA maximum memory or chunk size set for the server is held in memory until it is retrieved or the server is restarted. For information about setting these values, see Oracle Enterprise Data Quality for Product Data Oracle DataLens Server Administration Guide.To avoid this situation, use the Job Status feature of the calling application (Governance Studio or Services for Excel) to delete or retrieve the persistent data results immediately after the job is run, particularly for those jobs that return large amounts of data.
Use of this check box deactivates the Oracle DataLens Governance Studio tab and the data output is only stored provided in the methods you select in the File-based Output section. Notice that the NOTE: changes to indicate how the data will be output.
Use the any or all of the controls in the File-based Output section so that the resulting output data from this step is conveyed the way you want:
Enter or browse to a directory to store output files.
Enter one or more email addresses to whom you want the output results sent.
If you have FTP Connections established in the Oracle DataLens Server, you can select one of these connections to receive output results.
Select one of these file types (.txt or .xls) in which to store the output results.
Use the Column Headers section as follows:
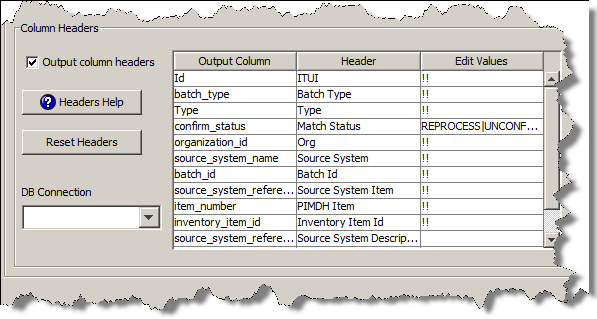
If you want the output results to contain headers to identify each column of data, select this check box. This is the default.
Select to view a brief explanation of how to use the table in the Column Header section.
Select to reset all of the entries in the Header column to their original state (the same as the Output Column).
When connected to an Input node, the Output Column and Header columns are populated with the available output selections.
You can change the names of the column headers that appear in the Header column so that they are more descriptive for the user or use the defaults. As in the preceding example, 'batch_type' and 'orig_desc' have been changed to 'Batch Type' and 'Description' respectively.
There are several ways you can configure how output columns appear in the Governance Studio as follows:
Hidden
Indicate that you do not want the column to appear in the output results by entering a hash mark, #. The output data is included in the source data though it does not appear in the user.
Read Only
A null value in this column means that the column is used for review only so it is not editable.
Editable
Indicate that you want the column to appear in the output results and allow it to receive input by entering two exclamation marks (!!). This sets the corresponding column to be edited. Additionally, you can include help text adjacent to the !! to appear to the user.
List of Values
You can add a simple list of values that are translated into a list menu to comprise the available selections for users. This list of values can contain any combination of text, space, number, and valid UTF-8 characters. The list items are delineated by a vertical bar and appear in the list menu in the exact order entered. For example, a list of matching process status may be:
REPROCESS|UNCONFIRMED|CONFIRMED NEW|IGNORE|EXCLUDE
For example, you could use this list in a Match Status output column so that it would force the user to set the data record consistently to improve consistency.
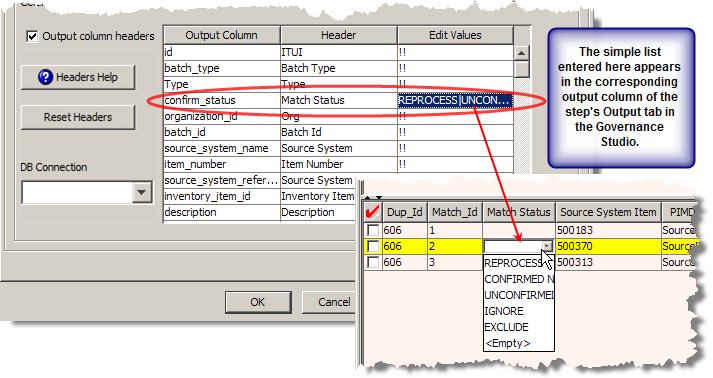
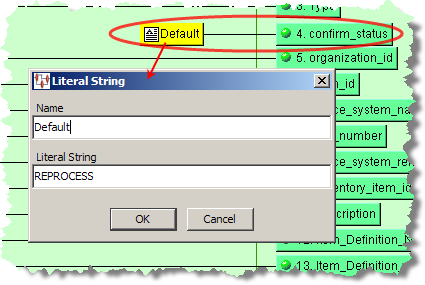
Note:
You must ensure that the first output column (the first rowin the output tab) is a unique ID column as in the preceding example by the use of 'Id'. If this is not the case, the list menu cannot be produced in Governance Studio.If you want to set a default value for a list menu, you must precede the output node with a default string value using a Literal String widget (as described in "Strings Widgets".
List from SQL Statement
Indicate that you want the column to appear in the output results and allow it to populate a list of options for the user to select from using a database by entering two caret symbols (îî) preceding a valid SQL statement. This allows you to automatically update the list by changing the database from which you are retrieving data. For example, to populate a list of manufactures that users can chose from based on the frequency they are used, you could use the following statement:
îîselect value from editvalues where id = 'mfg' order by frequency desc
Select the database connection that you want to use for this output step from the list.
Click the Oracle DataLens Governance Studio tab to view the Governance Studio output configuration options.
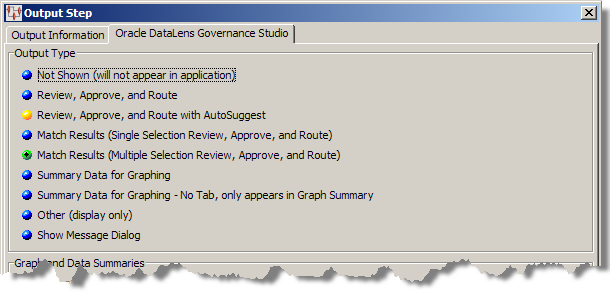
Use the Oracle DataLens Governance Studio tab as follows:
As shown in previous figure, you may choose one of the following output types to determine how data is displayed in the Governance Studio:
Results will not appear in the Governance Studio Output tabs. Use this output type for results that do not conform to Governance Studio requirements, such as database output steps.
Records the data that exactly meet match criteria are displayed. Use this type for displaying the results of a DSA template that runs a match process.
Alternatives to records meeting match criteria are displayed below a split-screen in the output spreadsheet. You must select one record from the alternatives; the records are available for downstream processing. Use this type for displaying the results of a DSA template that runs a match process.
Possible records meeting match or duplicate criteria are displayed below a split-screen in the output spreadsheet. Only a single record from the list of matched items can be selected; the record is available for downstream processing. Use this type for displaying the results of a DSA template that runs a match process.
Records meeting match or duplicate criteria are displayed below a split-screen in the output spreadsheet. Multiple records from the list of matched items can be selected; the records are available for downstream processing. Use this type for displaying the results of a DSA template that runs a match process.
Summary information is displayed in the graph; no selection of records is available with this option. The bars in the graph operate like buttons and when clicked jump to the Output tab for the data represented in the selected bar.
An individual tab is not created; the data appears in the Graph Summary tab.
Result information is displayed in a spreadsheet form that does not allow user interaction.
All informational messages, including errors and warnings, are captured and displayed to the user.
The options in this section are activated by your selections in the Output Type section and are used as follows:
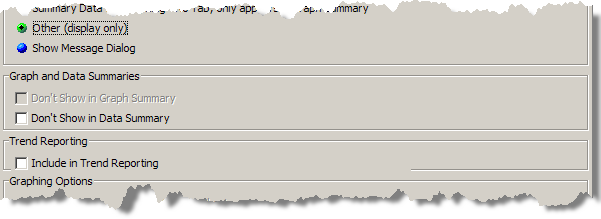
This option is active when the Summary Data for Graphing option is selected. The default is that the graph summary for the output step is included on the Graph Summary tab and selecting this option turns off that behavior so that the graph does not appear.
This option is active when either of the review or match options, or the Other option is selected. The default is that the data summary for the output step is included on the Data Summary tab and selecting this option turns off that behavior so that the data does not appear as a bar in the graph.
This section is active when any of the Output Type options are selected with the exception of the summary data options. The default is that there is no trend analysis data collected. Selecting this option turns off that behavior so that quality data is collected for use in additional DSA steps that chart the data for display.
This section of the tab is active only when one of the summary data Output Type options is selected.
There are four graphing options available for the output types that include graphs. You can mix and match between two sets of options for the graphs and create a label for the X and Y axes as follows:
Bar direction
Horizontal
Vertical bars
Bar color
Multi-color bars
Single-color bars
As shown in following figure, you may choose from the following graphing options to configure how graphs appear in the Governance Studio:
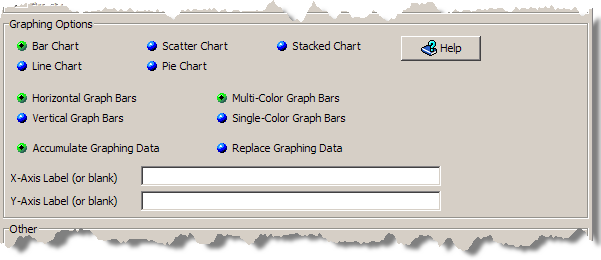
The data values across the defined output steps can be compared and displayed in the following types of charts:
A 3-D, colorized visual effect that shows the data in a bar format. The orientation of the bars is determined by the selection of Horizontal Graph Bars or Vertical Graph Bars options. The use of color in this type of chart is defined using the Multi-Color Graph Bars (a different color for each Output tab) or Single-Color Graph Bars (one color for all Output tabs.)
A line connecting the various output data points in a simplified manner.
A series of connected markers that show the data relationship.
A 3-D, colorized representation where each tab is depicted by its percentage of contribution to the total.
A 3-D, colorized representation where each tab is depicted by its percentage of contribution to the total.
The original data is retained when new data is added and all are rendered in the graphs.
All data is replaced by new data prior to rendering in a graph. The DSA is responsible for recalculating the results each time to ensure that the graph has the correct values.
You can add meaningful labels to indicate the data is graphed on the X and Y axes or you can leave it blank to use the default labeling.
Use the Help button to review information about the various graphing options.
This section of the tab is active only when one of the review or match Output Type options are selected.
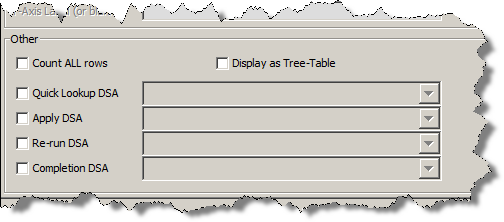
This advanced functionality is described in on "Using Secondary DSAs".
From the DSA Component Tree pane, in the Data Output folder, drag a DB Output node into the Graphical DSA Builder pane to the left of a processing step.
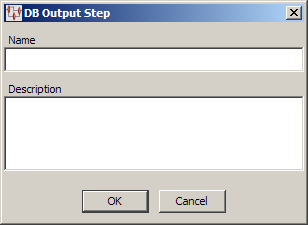
Enter a name and description for this step, and then click OK. Connect a Processing Step to this DB Output Step by dragging the appropriate Processing Step onto it.
Note:
There is no character limit for the Description field though when the DSA is loaded this description is truncated to 255 characters. While entire description is retained for the step, the truncated description is used as a reference to the step.From the DSA Component Tree pane, in the Data Output folder, drag the XML Update node into the Graphical DSA Builder pane to the left of a processing step. You connect the node by dragging a Processing Step and dropping it onto the new XML Update node. The data resulting from the connected process step is reproduced in an XML output file.
You can change the default name and description of an XML Update node by double-clicking on it and entering the new information.
Use these nodes to output XML type input data.
You can use the DSL XML node to output processed data into an XML file, which is by default stored in /tmp/ScsStepPimProductData_jobid.xml. Because only one of these nodes can exist in a DSA, the name and description are defaulted and cannot be changed.
From the DSA Component Tree pane, in the Data Output folder, drag the DSLXML node into the Graphical DSA Builder pane to the left of a processing step. You connect the node by dragging a Processing Step and dropping it onto the new DSL XML node.
The output actions for the node can be changed by double-clicking on it.
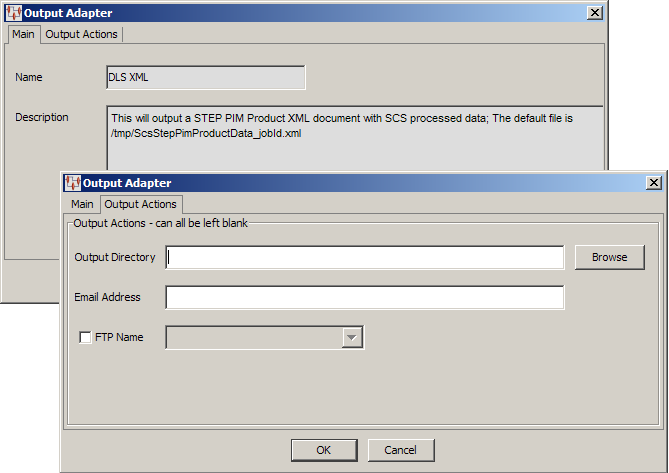
You can enter or locate the filename and path of where the data will be stored, enter an email address so that the file is emailed, or select an FTP site that is configured in your Oracle DataLens Server to store the file.
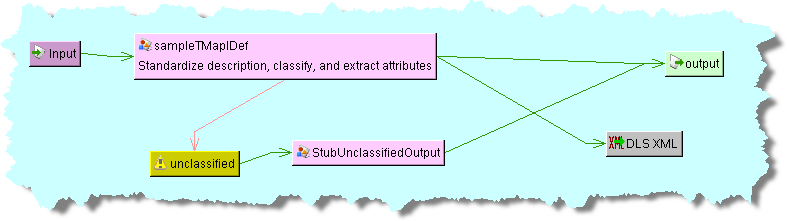
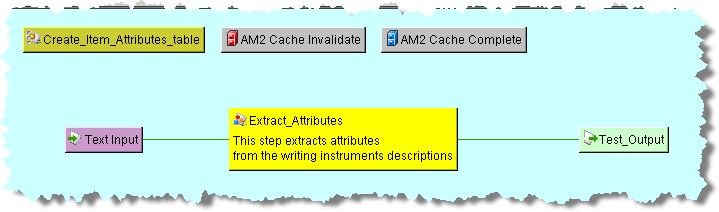
A simple DSA that processes input data to standardize the description, classify it by UNSPSC category, and extract all attributes then output the data to an XML file might look like the following:
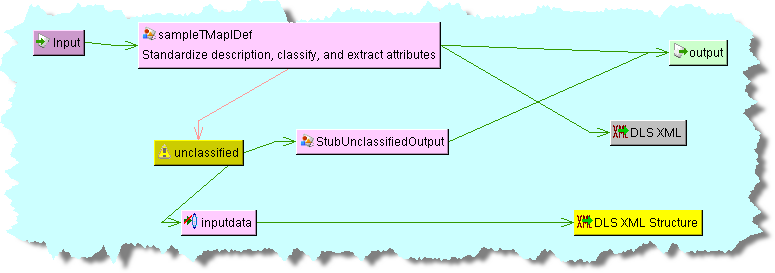
The DSL XML Structure node is used to output a report of the structure of the processed data, not the data itself, into an XML file, which is by default stored in /tmp/ScsStepPimClassificationStructure_jobid.xml. Because only one of these nodes can exist in a DSA, the name and description are defaulted and cannot be changed.
This node is used identically to the DLS XML node described in the previous section. Adding this node to the example DSA, in the previous section, to capture and report the XML data structure created in the DLS XML output node might look like the following:
You can add instructions that your DSA executes before or after all of the processing steps are executed. It is immaterial where these nodes are placed in your map as they are processed as indicated though the convention is in the top line of the DSA.
To ensure that any data manipulation that is required before processing, such as creating a temporary attribute table, Prerequisites nodes are used.
From the DSA Component Tree pane, in the Pre-Post Processing folder, drag a Prerequisites node into the Graphical DSA Builder pane to the top left of the map.
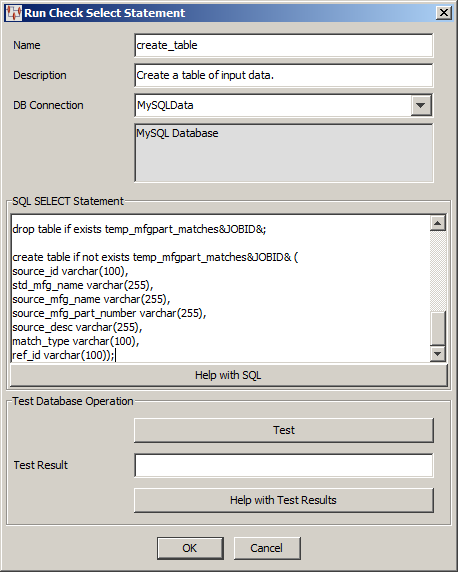
The Run Check Select Statements dialog box appears; use it as follows:
Enter a name and a brief description for the node.
Note:
There is no character limit for the Description field though when the DSA is loaded this description is truncated to 255 characters. While entire description is retained for the step, the truncated description is used as a reference to the step.You must select the type of database connection that you want to use. The list of database connections is populated based on those that you are configured in the Oracle DataLens Server. If the type of database connection is not listed, you must configure it in the Oracle DataLens Server so that it is available for selection when creating Transformation Maps.
Use this section to construct your database query with standard SQL statements and syntax. For example, to create a temporary table of data you could use the following statements:
create table if not exists temp_source&JOBID& (
interface_table_unique_id varchar(128),
batch_type varchar(128),
organization_id varchar(128),
source_system_name varchar(128),
batch_id varchar(128),
manufacturer_name varchar(255),
mfg_part_num varchar(255),
source_system_reference varchar(255),
item_number varchar(512),
inventory_item_id varchar(128),
source_system_reference_desc varchar(240),
description varchar(240),
attribute_concatenated varchar(512));
These SQL statements must be compatible with your database. Optionally, you can use a question mark (?) in the select clause. At run time, the question mark character is replaced with the transformation input data. This allows you to create a database transformation that varies with the content of the record being processed. Additionally, when database transforms are used to aggregate data fields from several different data sources, common access key information can be used across all data sources.
Select this button to view brief SQL query explanations and examples.
These fields are provided to help you test the setup of the data source connection. You can test the data source definition by clicking the Test button and reviewing the query results displayed in the Test Result field.
When the query returns more than one record, the database transformation uses only the first record returned.
If there is an error in the connection definition, an information error message appears. Click the Help with Test Results button for help in interpreting error messages.
Note:
The following message indicates that the database connection tested good and is not an error message:Please check your database now
If an error message is received and there are no results in the Test Result field, the connection is good and the query is valid, but no matching results were returned.
You can update Prerequisites nodes by double-clicking on them and modifying either the Description or the SQL statement in the Pre-Processor Update Statements dialog box that appears.
These processing nodes are used to process SQL statements either before or after the DSA processes the input data. They are constructed as the Prerequisites nodes previously described. In addition, the Post-Processing node offers the option to for the run of this step even if the DSA job fails or is cancelled.
These nodes are used in a DSA when the processing steps need to indicate that stale data exists that must be refreshed.
To add either node, from the DSA Component Tree pane, in the Pre-Post Processing folder, drag either node into the Graphical DSA Builder pane to the top left of the map. Because the DSA processes left-to-right, you should ensure that the AM2 Cache Complete node is to the right of the AM2 Cache Invalidate node as in the following example:
You can use a sleep (wait) step with your pre and post-processing steps to tell the DSA to halt for a predetermined amount of time. The sleep nodes are constructed the same way as Sleep processing nodes described in Sleep Step with the exception of how they are connected to other steps. With pre and post-processing sleep nodes, you drag and drop the sleep step onto one of the other nodes found in the same folder, which connects the two steps.
Assembling the various DSA building components into an effective DSA to process your data requires forethought in design and a clear delineation of the ultimate goal. You can build several small, discrete DSAs that accomplish one or two specific processing tasks, and then incorporate them into a large DSA to affect an end-to-end data processing schema.
The following is an example of a complex DSA that performs duplicate location, data standardization, location of missing attributes, and data clean-up:
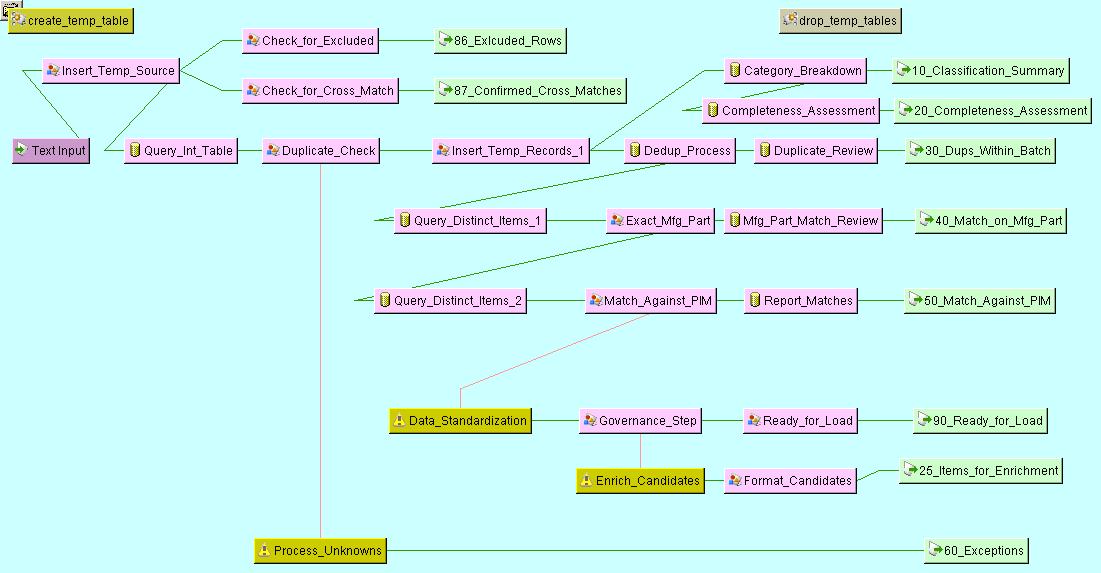
This image was produced using the Show Image option as described in "File Menu".
Tip:
The output steps in your DSA correspond to the titles of the output tabs in your Governance Studio project and appear in alphabetized order by default. The output steps in the example DSA are preceded by numbers, which when alphabetized for the output tabs to appear in this exact order. The numbers are ignored and do not appear on the tab labels. Using a numbering scheme similar to the example is an easy way to control the appearance of your output tabs in the Governance Studio.
|
Copyright © 2001, 2011, Oracle and/or its affiliates. All rights reserved. Legal Notices |
|