| Skip Navigation Links | |
| Exit Print View | |

|
Monitoring Java EE Components in Oracle Java CAPS Java CAPS Documentation |
| Skip Navigation Links | |
| Exit Print View | |

|
Monitoring Java EE Components in Oracle Java CAPS Java CAPS Documentation |
Starting the Enterprise Manager Server
To Start the Enterprise Manager Server
Logging In to Enterprise Manager
To Log In to Enterprise Manager
Adding an Application Server Domain to Enterprise Manager
To Add an Application Server Domain to Enterprise Manager
Adding an Application Server Instance to Enterprise Manager
To Perform Prerequisite Steps on the Application Server
To Add an Application Server Instance to Enterprise Manager
Using the Connectivity Map Controls
To Adjust the Position of the Connectivity Map
To Zoom In on the Connectivity Map
To Zoom Out from the Connectivity Map
To Specify an Exact Zoom Percentage
Stopping the Enterprise Manager Server
To Stop the Enterprise Manager Server
Monitoring Application Servers
Viewing Basic Information About an Application Server
To View Basic Information About an Application Server
Viewing Summary Information For an Application Server
To View Summary Information for an Application Server
Stopping Application Server Domains
To Stop an Application Server Domain
Hiding, Showing, and Removing Application Servers
To Make All of the Hidden Application Servers Reappear
To Remove an Application Server
Viewing Basic Information About a Collaboration
To View Basic Information About a Collaboration
Viewing Consumption Information For a Collaboration
To View Consumption Information For a Collaboration
Viewing Summary Information For a Collaboration
To View Summary Information For a Collaboration
Displaying Information About an Adapter
To Display Information About an Adapter
Stopping and Starting Inbound Adapters
Viewing the Application Server Log File
To View the Application Server Log File
Viewing the Message Server Log File
To View the Message Server Log File
To Change the Status of an Alert
To Delete More Than One Alert at a Time
To Delete All Alerts For the Selected Component
To Configure the Alert Table Name (Databases Other Than Derby)
To Set Up Database Access (Databases Other Than Derby)
To Run the Database Scripts (Databases Other Than Derby)
To Log In to the Configuration Agent
To Modify the Alert Notification Fields
About Enterprise Manager Topic and Queue Management
Monitoring Topics and Queues for JMS IQ Manager
Sending and Publishing Messages for JMS IQ Manager
Viewing Message Properties for JMS IQ Manager
Viewing and Editing Message Payload for JMS IQ Manager
Monitoring Java System Message Queue
Monitoring Topics and Queues for Java System Message Queue
Sending and Publishing Messages for Java System Message Queue
Viewing Message Properties for Java System Message Queue
Viewing and Editing Message Payload for Java System Message Queue
Monitoring Oracle Advanced Queueing
Monitoring Topics and Queues for Oracle Advanced Queueing
Sending and Publishing Messages for Advanced Queueing
Viewing Message Payload for Advanced Queueing
To View the Payload of Text and Byte Messages
Monitoring WebLogic Server JMS
Monitoring Topics and Queues for WebLogic Server JMS
Sending and Publishing Messages for WebLogic Server JMS
Viewing Message Properties for WebLogic Server JMS
Viewing Message Payload for WebLogic Server
To View the Payload of Text and Byte Messages
Monitoring Java Message Service Grid
Monitoring Application Servers, Collaborations, and Alerts (Command Line)
Enterprise Manager Command-Line Client Syntax
Monitoring Application Servers and Collaborations (Command Line)
Listing the Available Methods For the Runtime Service
Displaying the List of Components
Starting and Stopping Collaborations
Monitoring Alerts (Command Line)
Enterprise Manager enables you to monitor Collaborations at runtime. You can perform the following tasks:
View basic information
View consumption information
View summary information
Stop and restart Collaborations
Monitor logs and alerts
For information about monitoring logs, see Monitoring Logs. For information about monitoring alerts, see Monitoring Alerts. For basic information about Enterprise Manager, see Enterprise Manager Basics.
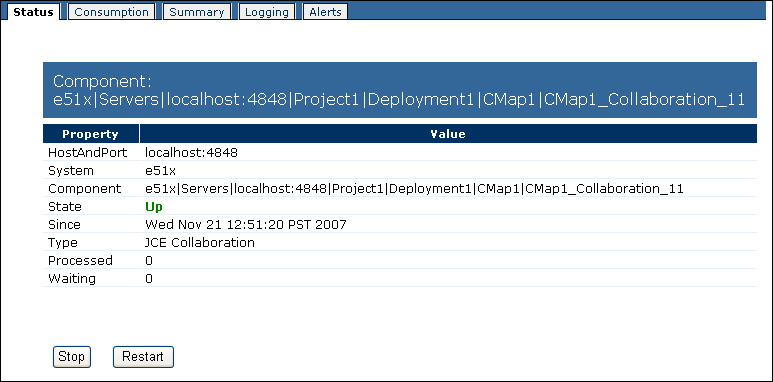
You can view basic information about a Collaboration from Enterprise Manager.

Note - If the Connectivity Map is displayed in the Details panel, you can select the Collaboration in the Connectivity Map.
The Status tab appears.
The HostAndPort row displays the computer name and administrative port on which the Collaboration is running.
The System row indicates whether the Collaboration is located in the Java EE or SRE portion of the Explorer panel.
The Component row displays the hierarchy of the Collaboration in the Explorer panel.
The State row specifies the current status of the Collaboration.
The Since row indicates when the current status began.
The Type row indicates the category of Collaboration (for example, JCE Collaboration).
If the Collaboration subscribes to a topic, then the Subscriber row lists the subscriber name used by the Collaboration.
The Processed row lists the number of messages that the Collaboration has processed.
If the input to the Collaboration is a topic or queue, then the Waiting row lists the number of messages that are waiting to be processed by the Collaboration.
You can view statistics about the consumption of messages by a Collaboration.
Note - If the Connectivity Map is displayed in the Details panel, you can select the Collaboration in the Connectivity Map.
The Waiting To Be Processed graphic lists the number of messages that are waiting to be processed by the Collaboration. This graphic appears only if the input to the Collaboration is a topic or queue.
The Processed By Collaboration graphic lists the number of messages that the Collaboration has processed.
You can view summary information for a Collaboration.
The Summary tab displays icons for the Connectivity Map components and JMS IQ Managers that are running in the domain.
You can stop and restart Collaborations from Enterprise Manager.