6 Virtualized Exadata Database Machine
This chapter describes how to manage and monitor a virtualized Oracle Exadata Database Machine with DB clusters using Oracle Virtual Machine (OVM) for x86 and Oracle Exadata Storage Servers in Exadata plug-in 12.1.0.6 and later.
The Exadata plug-in discovers, manages, and monitors virtualized Exadata Database Machine in conjunction with the Virtualization Infrastructure plug-in. For details about this plug-in, see the "Direct Monitoring of Xen Based Systems" chapter of the Oracle® Enterprise Manager Cloud Administration Guide:
http://docs.oracle.com/cd/E24628_01/doc.121/e28814/direct_monitor_cs.htm#EMCLO531
The following sections describe how to discover a virtualized Exadata Database Machine and other supported targets:
Once you have completed the discovery of a virtualized Exadata Database Machine, continue with the configuration steps outlined in Post-Discovery Configuration and Verification.
6.1 Integration with Virtualization Infrastructure Plug-in
The physical server (physical Oracle Server target), Dom0 (Virtual Platform target), and DomU (virtual Oracle Server target) are discovered and monitored by the Virtualization Infrastructure (VI) plug-in.
The Exadata discovery can work with the VI plug-in by the physical server, Dom0, and DomU are discovered using the VI plug-in before Exadata Database Machine discovery. During Exadata discovery, the discovery code looks up the existing Virtual Platform target that corresponds to the Dom0 of the compute node.
The Exadata discovery flow with VI plug-in integration includes the following checks:
-
Check whether the Exadata Database Machine is virtualized based on the configuration metric of the host target of the discovery agent.
-
Check whether the VI plug-in is deployed. If not, you will be prompted to deploy it as described in the "Direct Monitoring of Xen Based Systems" chapter of the Oracle® Enterprise Manager Cloud Administration Guide:
http://docs.oracle.com/cd/E24628_01/doc.121/e28814/direct_monitor_cs.htm#EMCLO531
6.2 Discovering Virtualized Exadata Database Machine
With virtualized Exadata, one Exadata Database Machine target will be created for each physical Database Machine instead of one DB Machine target for each DB cluster deployed through OEDA. Compute nodes, Exadata Storage Servers, InfiniBand switches, compute node ILOM, PDU, KVM, and Cisco switches targets are discovered by the Exadata plug-in.
With only the compute nodes virtualized, the physical servers, Dom0 and DomU, are monitored by the Virtualization Infrastructure (VI) plug-in. The Exadata plug-in is integrates with the VI plug-in for discovery and target management as discussed below.
The hardware targets in virtualized Exadata are discovered in almost the same way as physical Exadata (see Discovering an Exadata Database Machine) except as noted below:
-
The
Dom0of the compute nodes are discovered usingibnetdiscover. Compute node ILOM to compute node mapping and VM hierarchy are obtained from the VI plug-in. -
Exadata Storage Servers are discovered using
ibnetdiscoverinstead ofkfod. Therefore, there is no need to specify the Database Oracle Home during discovery. -
InfiniBand switches are discovered using
ibnetdiscover. -
Compute node ILOM, PDU, and Cisco switch are discovered based on the
databasemachine.xmlschematic file. -
Cluster and Database Target Discovery
-
The cluster and database target discovery is similar to the physical Exadata case (see Discovering Grid Infrastructure and RAC). The only difference is that the Enterprise Manager agents needed to be deployed on the
DomUof the Database cluster before the cluster, ASM, and database targets can be discovered using the DB plug-in.
-
-
Agent Placement
-
The primary and backup Enterprise Manager agents monitoring the Exadata hardware targets should be deployed in two dedicated
DomUthat will not be suspended or shut down, and are ideally on different physical servers to ensure high availability. -
For static virtual machine configurations, the Enterprise Manager agents that are used to monitor the Database clusters can be used to monitor the Exadata hardware.
-
To discover a virtualized Exadata Database Machine:
-
From the Setup menu, select Add Targets then Add Targets Manually.
-
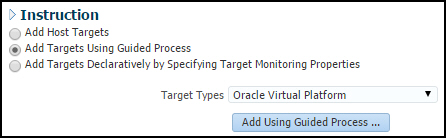
On the Add Targets Manually page, select Add Targets Using Guided Process.
-
For the Target Types drop-down menu, select Oracle Virtual Platform (Figure 6-1).
Note:
This option will be available only if the Virtualization Infrastructure (VI) plug-in has been deployed.If the plug-in is not deployed, then the Oracle Virtual Platform option will not appear. Deploy the VI plug-in as described in the "Direct Monitoring of Xen Based Systems" chapter of the Oracle® Enterprise Manager Cloud Administration Guide:
http://docs.oracle.com/cd/E24628_01/doc.121/e28814/direct_monitor_cs.htm#EMCLO531
-
Click Add Using Guided Process.
-
On the Discover Oracle Virtual Platforms page:
-
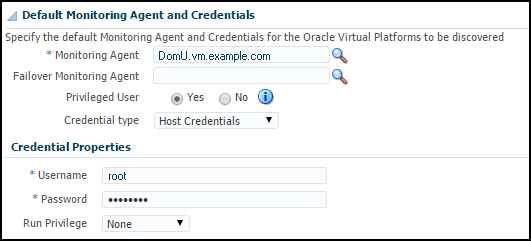
Set the Default Monitoring Agent and Credentials (Figure 6-2). Click the magnifying glass icon
 to search for the monitoring agent location. For the Credential Properties, enter
 rootfor the Username and provide the host's root password.Note:
A non-root user with sudo privilege can also be used. Refer to the VI plug-in documentation for the necessary setup steps. -
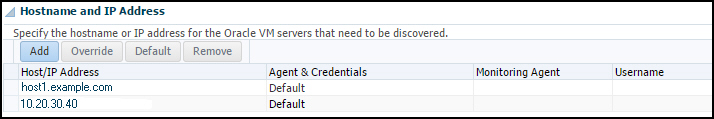
Add a Host Name or IP address. Click Add and enter the fully qualified domain name (FQDM) or IP address for the host in the pop-up window. If you have more than one, each entry must appear on a separate line.
Click Add to close the pop-up window.
-
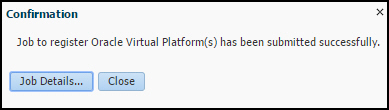
Click Submit. A job is submitted to register the Oracle Virtual Platform, which creates the virtual targets. Approximately five (5) minutes is required to complete the job. Click Job Details to check the status, or click Close to close the window.
-
-
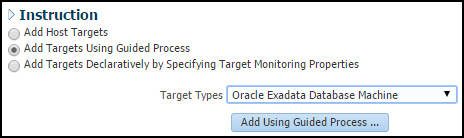
Once the job completes, then discover the Exadata Database Machine. From the Setup menu, select Add Targets then Add Targets Manually.
-
On the Add Targets Manually page, select Add Targets Using Guided Process.
-
For the Target Types drop-down menu, select Oracle Exadata Database Machine (Figure 6-5):
-
Click Add Using Guided Process.
-
On the Oracle Exadata Database Machine Discovery page, select the Discover a new Database Machine and its hardware components as targets option and click Discover Targets.
-
On the Discovery Inputs page, click the magnifying glass icon
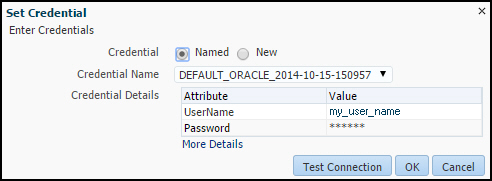
to search for an agent in a DomUthat resides in the DB Machine to be discovered. Do not search for a virtual platform (Dom0) because you cannot install an Enterprise Manager Agent inDom0. Just like the physical Exadata case, you are specifying a host on which the schematic file can be read. Usually, it will be the same host as the discovery agent. It will not be theDom0In the Schematic Files section, select a host on which the schematic file can be read, and set the host credential that can read the schematic file. Click Set Credential to set the log in and password (Figure 6-6) for the host you registered in the previous steps. Click OK.
Click Next.
-
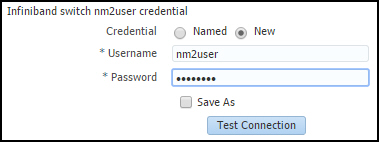
On the InfiniBand Discovery page, set the
nm2usercredential. Select the New option and enter nm2user for the Username field and provide a password as shown in Figure 6-7:Click Next.
Note:
A known issue about missing CLIENTNAME and CLIENTIP information will cause an Error pop-up message. Click OK to dismiss the pop-up and to continue with the guided discovery. -
On the Prerequisite Check page, verify the Status is successful, then click Next.
-
On the Components page, review the Exadata components that were discovered, then click Next.
-
On the Monitoring Agents page, review the names, locations, and backup locations of the Monitoring Agents. Click Next.
-
On the Agent Credential page, if the credentials are the same for all agents, then you can enter a new username and password or accept the default. Click Next.
If the credentials are different for all agents, then select the Different for all agents option and enter usernames and passwords for all hosts. Click Next.
-
On the Monitoring Credentials page, verify or enter the credentials for the following components:
-
Oracle Exadata Storage Server
-
InfiniBand Switch
-
ILOM
Click Test Connection for each component to verify the connection. If the credentials are different for each component, then provide the appropriate username and password.
Click Next.
-
-
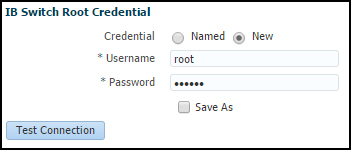
On the SNMP Subscription page, enter the SNMP Community String (default is public) value for both Oracle Exadata Storage Server and InfiniBand Switch areas. For the InfiniBand Switch, provide the root credentials (Figure 6-8). Click Next.
-
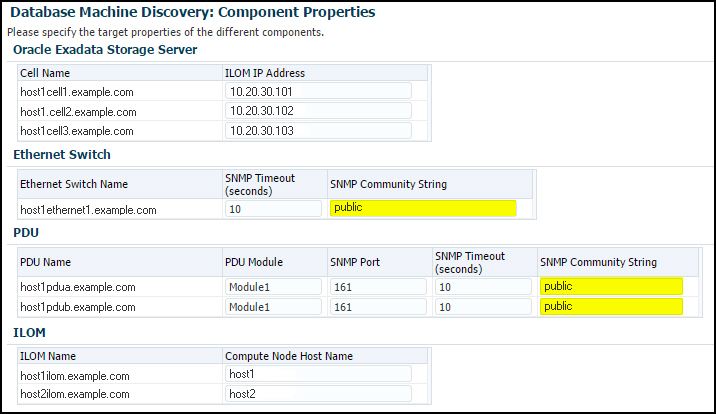
On the Component Properties page, enter public for both Ethernet and PDU components (Figure 6-9). Click Next.
-
On the Review page, review the details of the following components:
-
System Target
-
Compute Node
-
Oracle Exadata Storage Server
-
InfiniBand Switch
-
Ethernet Switch
-
Compute Node ILOM
-
KVM
-
PDU
Click Submit to promote all targets. Allow for approximately five (5) minutes to process. Once complete, all targets will now be monitored by Oracle Enterprise Manager Cloud Control.
-
6.3 Viewing Virtualized Exadata Database Machine
Once discovered, the Exadata plug-in shows the virtual machines monitored by Enterprise Manager Cloud Control 12c, as shown in Figure 6-10:
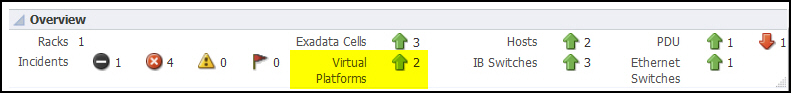
Note:
The schematic diagram in the Database Machine home page is based on the content of thedatabasemachine.xml file found during discovery. The virtual platforms (Dom0) are displayed as compute nodes in the rack in the schematic diagram.
The Database Machine Software topology diagram will not display the physical Oracle Server, virtual Oracle Server targets (DomU), and Virtual Platform target (Dom0) targets. However, it will continue to show the host targets which are running in DomU.
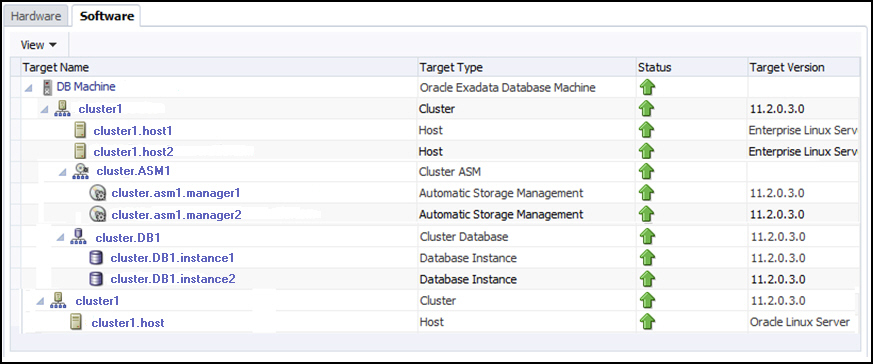
The Software tab for the Exadata Database Machine target shows all clusters, ASM, and Database targets in the whole physical Database Machine grouped by clusters as described in Figure 6-11:
6.4 Resource Utilization Graphs
The following compute resource allocation graphs are available in virtualized Exadata. These graphs are dependent on the virtual machine hierarchy and metric data from the VI plug-in:
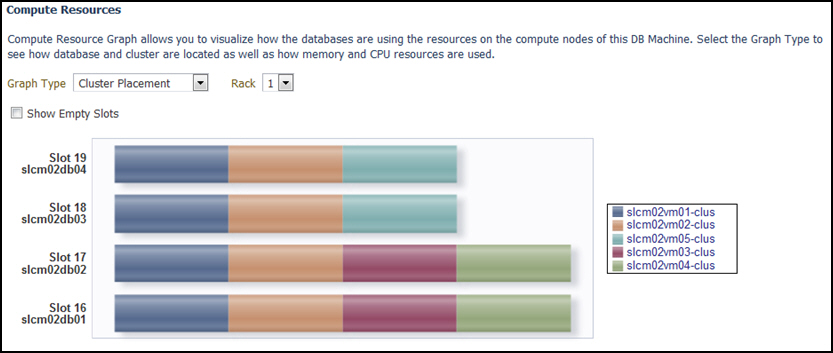
6.4.1 Cluster Placement
This graph (Figure 6-12) shows the ClusterWare cluster placement on physical servers in a particular Exadata Database Machine rack. Since this is a placement graph, the widths of the data series reflect the number of clusters on the physical server that has the most number of clusters.
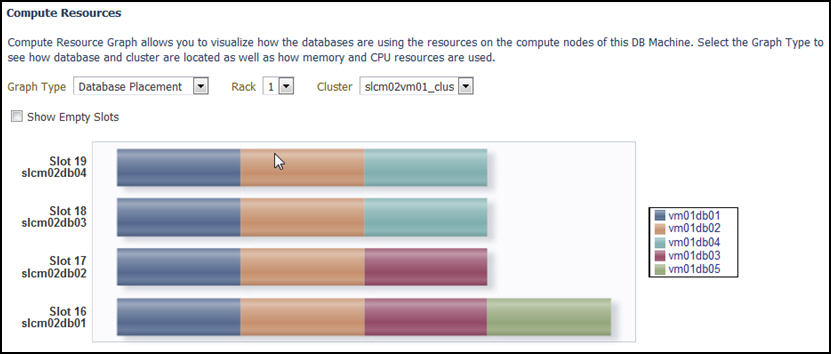
6.4.2 Database Placement
This graph (Figure 6-13) shows the database placement on physical servers in a particular Exadata Database Machine rack for a particular DB cluster. Since this is a placement graph, the widths of the data series reflect the number of DB on the physical server that has the most number of databases for a particular DB cluster.
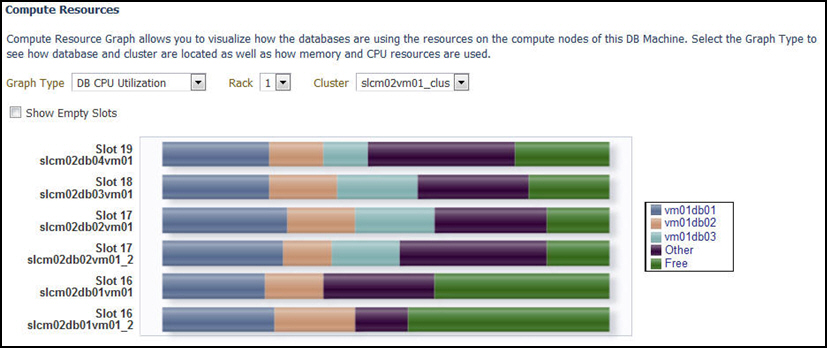
6.4.3 Database CPU Utilization
This graph (Figure 6-14) shows the database CPU utilization per database per VM host for a particular DB cluster.