
The SGD Gateway monitoring page shows information on software versions, connections, and incidents for an SGD Gateway target. See Figure 3.1, “Oracle Secure Global Desktop Gateway Monitoring Page”.
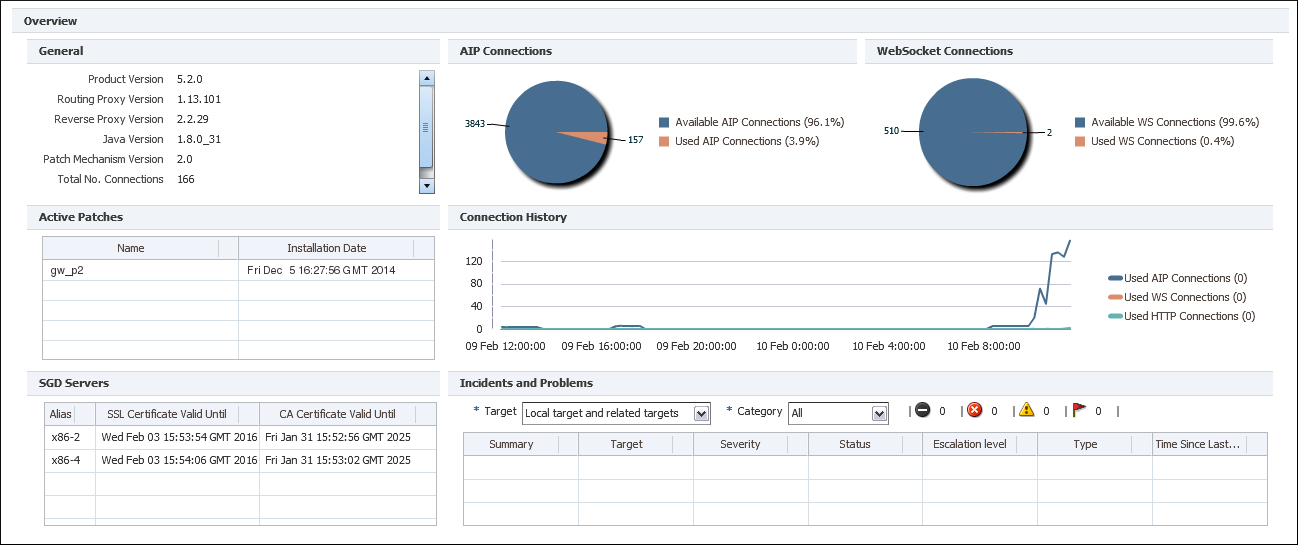
The SGD Gateway monitoring page includes a series of panels, as described in Table 3.1, “Panels on the SGD Gateway Monitoring Page”.
Table 3.1 Panels on the SGD Gateway Monitoring Page
Panel | Description |
|---|---|
General | A table that shows software version information and a summary of connection statistics for the Gateway. |
AIP Connections | A pie chart that shows the number of AIP connections for the Gateway. The percentage of used connections, compared to the maximum number of available connections, is shown. |
Websocket Connections | A pie chart that shows the number of websocket connections for the Gateway. The percentage of used connections, compared to the maximum number of available connections, is shown. |
Active Patches | A table that shows details of the SGD software patches installed on the Gateway. |
Connection History | A line chart that shows the number of AIP, HTTP, and websocket connections over the previous 24 hours. |
SGD Servers | A table that shows details of the SGD server security certificates stored in the SGD Gateway keystore. |
Incidents and Problems | The Incidents and Problems table shows system messages relating to events, incidents, and problems for the Gateway. For more information about managing incidents in Oracle Enterprise Manager, refer to the Oracle Enterprise Manager Cloud Control Administrator's Guide. |