Monitoring Oracle E-Business Suite
This chapter covers the following topics:
- Navigation and Overview
- Home Page of an Oracle E-Business Suite System Instance
- Incidents and Problems for an Oracle E-Business Suite Target
- Patch Recommendations for Oracle E-Business Suite and Technology Stack
- Compliance Standards for Oracle E-Business Suite
- Monitoring Online Patching to Detect Cutover
- Monitoring Current Activity
- Monitoring User Sessions
- Monitoring JVM Usage
- Monitoring Templates for Oracle E-Business Suite
- Enabling Service Tests and Beacons Link
- Drilling Down to Oracle Applications Manager
- Services
- Concurrent Processing Dashboard
- Oracle E-Business Suite Summary on the Exalogic Dashboard
- End-To-End Performance Monitoring with RUEI and JVMD
- Setting up End-to-End Monitoring
- Analyzing a Performance Issue
- Drilling Down from RUEI to the Plug-in
- Custom Metrics
- Custom Compliance Rules
Navigation and Overview
Once discovered, an Oracle E-Business Suite instance will appear in the Oracle E-Business Suite Instances section on the Oracle E-Business Suite Management page. Click on the name of the instance to go to the home page of that instance.
Oracle E-Business Suite System
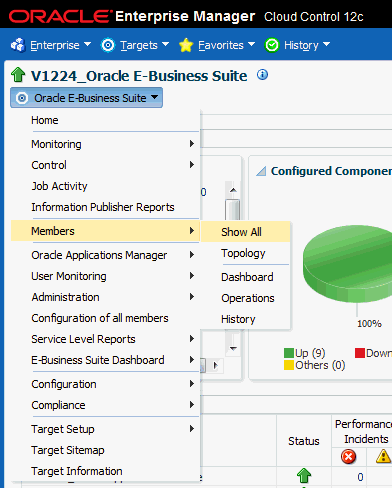
Oracle E-Business Suite is discovered as a system. The members of the system include all nodes and targets that run on each node. To see the members, click on the instance target menu (labeled "Oracle E-Business Suite") and select Members > Show All.
Topology of the Oracle E-Business Suite System
The Configuration Topology Viewer provides a visual layout of the Oracle E-Business Suite system with its child targets. To access the Configuration Topology Viewer, select Members > Topology from the instance target menu.
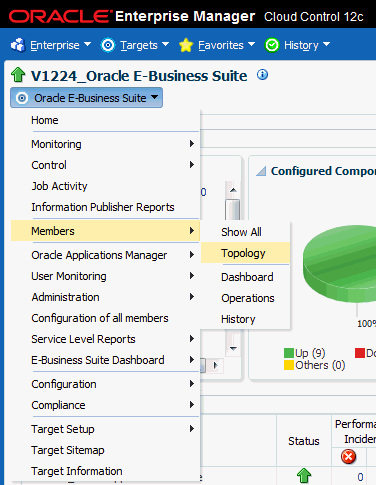
Upon service failure, the potential causes of failure as identified by root cause analysis, are highlighted in the topology view. You can view dependent relationships between services and systems from the Topology tab.
Using the topology view, you can:
-
Determine the source of a target's health problems
-
Analyze the impact of a target on other targets
-
Determine the system's structure by viewing the members of a system and their interrelationships
Metrics
Once discovered, metrics are collected for an Oracle E-Business Suite system as well as its individual members. To see the metrics collected for any target, select Monitoring > All Metrics from the instance target menu.
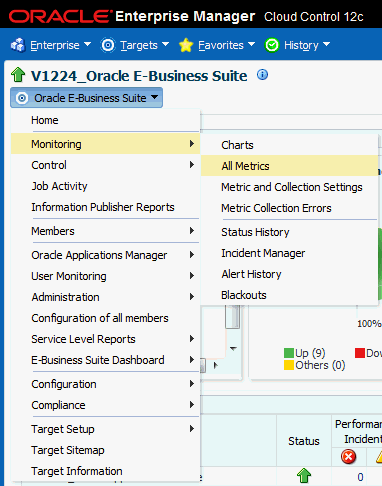
For more information on metrics, see: Oracle Application Management Pack for Oracle E-Business Suite Metric Reference Manual.
Setting Thresholds for Metrics
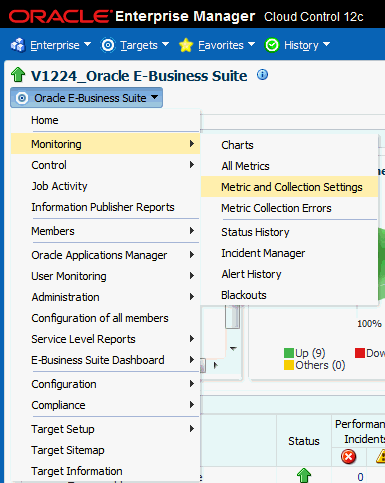
Metrics collected can be compared to predefined values to check if they are exceeding a critical threshold or a warning threshold. Incidents are generated once the threshold is exceeded. To see the thresholds defined for metrics of any target, select Monitoring > Metric and Collection Settings from the instance target menu. Here you can set the Critical/Warning thresholds used to generate incidents. You can also change the collection schedule of the metrics here.
For more information on incidents, see: Incidents for an Oracle E-Business Suite Target.
Home Page of an Oracle E-Business Suite System Instance
The home page of an Oracle E-Business Suite instance provides you with the following regions: Overview, Services, Targets Running on Nodes, Incidents and Problems, Oracle E-Business Suite Patch Recommendation, and Compliance Summary. Information about each region is provided below and in more detail in the remainder of this chapter.
Overview Region
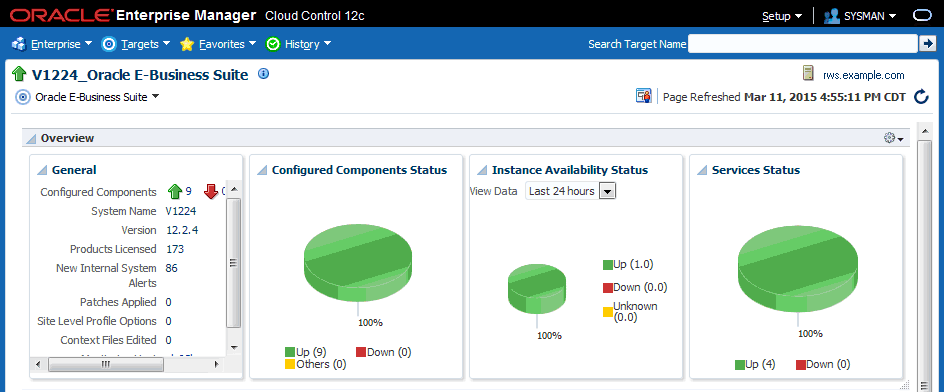
The Overview region provides general information and statuses of the Oracle E-Business Suite instance.
General Section
Details about the Oracle E-Business Suite instance in the General section are shown in the following table:
| Configured Components | The count of member targets that fall into the status categories of Up, Down, or Other. You can drill down on a status category to view the targets that currently fall into that category. |
| System Name | The name of the Oracle E-Business Suite instance. |
| Version | The version of the Oracle E-Business Suite instance. |
| Products Licensed | The number of products licensed on the Oracle E-Business Suite system. |
| New Internal System Alerts | The number of new System Alerts generated in the Oracle E-Business Suite instance. Note that these System Alerts originate from the alerting infrastructure of Oracle E-Business Suite. These are complementary to the Oracle Enterprise Manager incidents. |
| Patches Applied | The number of patches applied to the system in the last 24 hours. |
| Site Level Profile Options | The number of site level profile options that have changed on the system in the last 24 hours. |
| Context Files Edited | The number of AutoConfig context files that was changed on the system in the last 24 hours. |
| Monitoring Host | The host of the agent which is monitoring the Oracle E-Business Suite system. This will be the host where the database is running. |
Note: The New Internal System Alerts, Patches Applied, Site Level Profile Options Changed, and Context Files Edited metrics are based on information periodically summarized in the Oracle E-Business Suite database by the Oracle Applications Manager Dashboard Collection concurrent program. This program is controlled through the Preferences global link in Oracle Applications Manager. If this program has been disabled in the Oracle E-Business Suite system for any reason, then these metrics will not be updated.
Availability Status Charts
This portion of the Overview region is made up of three charts which depict the following:
-
Status of the Configured Components.
-
Historic information about the availability status of the Oracle E-Business Suite instance. You can choose to the view data from the last day, week, or month.
-
Status of the services.

Services Region
Oracle E-Business Suite and its member targets provide four major services to its customers. They are:
-
Concurrent Processing
-
Forms
-
Self-Service Pages
-
Workflow
All these services are registered with Cloud Control once the successful discovery of the Oracle E-Business Suite target is completed. The Services section on the home page of the Oracle E-Business Suite instance has the details of services.

Each service has a set of critical components without which the service cannot be provided. The following table lists the critical component of each service.
| Service | Critical components |
|---|---|
| Concurrent Processing |
|
| Workflow Service |
|
| Forms Applications Service |
|
| Self-Service Applications Service |
|
More information on services is provided later in this chapter.
Targets Running on Nodes
This section shows the targets running on each node in which the Oracle E-Business Suite is deployed. The data is shown in a hierarchical way with the host as the topmost parent. The nodes running on that host appear as the immediate children. The individual targets running on each node will appear as the child of each node. If the Oracle E-Business Suite instance features Online Patching, only run edition targets will be shown.

Tip: Use the Detach button to view the table on a separate page. This feature is useful if your table has more rows than can be shown in the default display.
Incidents and Problems for an Oracle E-Business Suite Target
Incidents and problems will be raised if any member of the Oracle E-Business Suite system is down or if any metric has exceeded its threshold. The Incidents and Problems region on the Oracle E-Business Suite instance home page gives an overview of the incidents raised for that instance. You can get the number of incidents grouped by severity. In addition, you can filter incidents based on the type of incident, such as availability, performance, security, and so on. You can drill down to the details of each issue by clicking on the Summary column which takes you to the Incident Manager. The Incident Manager page is where you can view more details of the event. You can track and manage the incident from here as well.
Patch Recommendations for Oracle E-Business Suite and Technology Stack
Oracle E-Business Suite customers must ensure Oracle recommended patches are applied to their Oracle E-Business Suite environments. These recommended patches are made available through My Oracle Support.
Patch Recommendations are provided for Oracle E-Business Suite and Technology Stack as a new feature in Release 12.1.0.4.0. Patches are recommended for three different components:
-
Oracle E-Business Suite
-
Oracle Database
-
Oracle Application Tier Technology
Patch Recommendation functionality works as follows:
-
By default, a background collection job is run daily to collect a list of recommended patches for Oracle E-Business Suite and the Technology Stack.
-
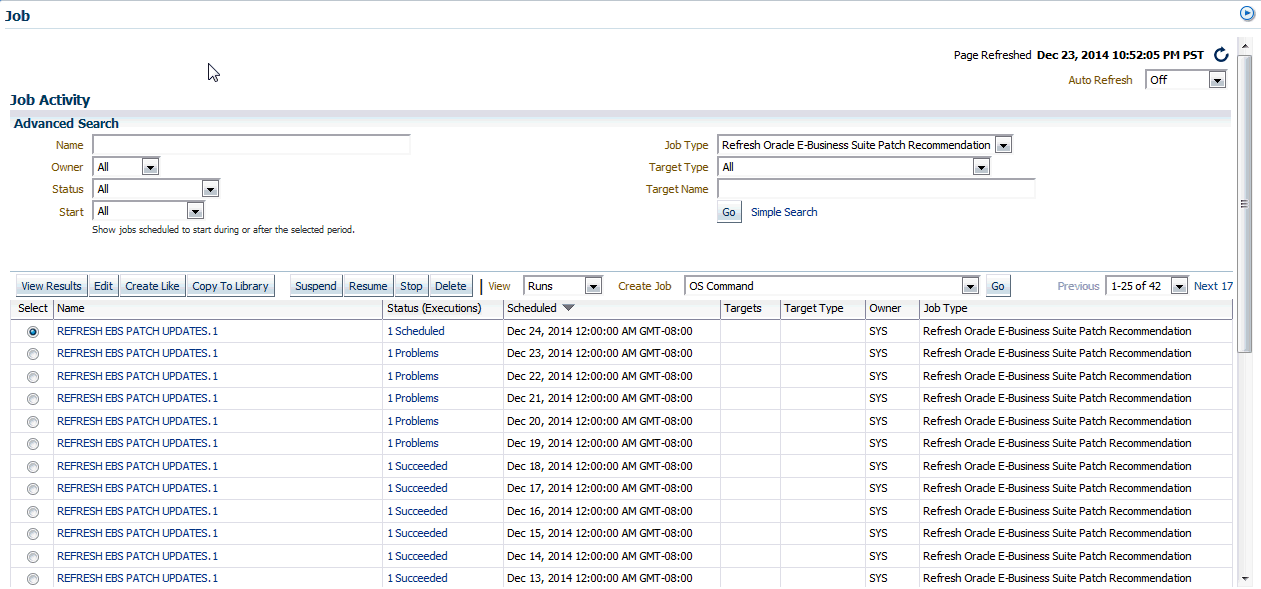
The pre-defined background job named “REFRESH EBS PATCH UPDATES.1” of job type “Refresh Oracle E-Business Suite Patch Recommendation” downloads patch information from My Oracle Support to the OMS Patch Stage Directory location.
-
This job is scheduled to run every day, although Administrators can reschedule it according to their needs.
-
-
Applied patch information is collected from the respective Oracle E-Business Suite environments.
-
A list of recommended patches are compared with already applied patches. Recommended patches which have not yet been applied are displayed.
Oracle recommends that customers enable My Oracle Support to use the Patch Recommendations functionality. However, for those customers who have security restrictions and do not prefer to enable My Oracle Support, see the below section Settings in Oracle E-Business Suite for an alternate option.
If you are enabling a My Oracle Support connection, follow the instructions in the following section, Settings to Enable Patch Recommendations.
Note: For customers upgrading from Release 12.1.0.3.0 to Release 12.1.0.4.0, in order to utilize the Patch Recommendation feature, the agents must also be upgraded to Release 12.1.0.4.0. If the agent is at Release 12.1.0.3.0, results will not be as expected.
Settings to Enable Patch Recommendations
The following settings must be set in order to enable the Patch Recommendation feature:
Settings in the OMS
-
Set the My Oracle Support credentials.
-
For information on setting preferred credentials, see Setting Credentials.
Settings in Oracle E-Business Suite
The following settings should be set in the Patch Manager section of the Preferences page:
-
Set the OMS patch stage directory to a location where patches and patch recommendation information can be downloaded and searched. The directory must be accessible from OMS.
-
To allow automatic downloading of Patch Recommendation information, ensure "Connect to My Oracle Support for Patches" is enabled.
If "Connect to My Oracle Support for Patches" is disabled due to some reason such as the connection to My Oracle Support being unavailable on the OMS instance, the Patch Recommendation feature can still be used by following the steps below:
-
Disable "Connect to My Oracle Support for Patches" from Oracle E-Business Suite Preferences.
-
Download InfoBundleR12.zip from https://updates.oracle.com/download/InfoBundleR12.zip.
-
Download patch 17353079 from My Oracle Support.
-
Copy the zip files to the OMS Patch Stage Directory Location.
-
Click on the Refresh button in the Oracle E-Business Suite & Technology Stack Patch Recommendation region. This will collect a list of recommended patches from the OMS staging directory that need to be applied to the instance.
-
Oracle E-Business Suite & Technology Stack Patch Recommendation Region
By default, you can find the Oracle E-Business Suite & Technology Stack Patch Recommendations region on the Oracle E-Business Suite instance target home page.
The bar graph in this region shows a summary of recommended patches to be applied on the specific Oracle E-Business Suite instance. Hover over each bar to see the number of recommended patches for a particular product. Click on any bar in the bar graph to drill down to the next section which provides details on the individual patches for each technology component of the Oracle E-Business Suite Technology stack.

Note: For Release 12.0 and 12.1 instances, the name of this region is "Oracle E-Business Suite Patch Recommendation."
Descriptions of the elements in this region are as follows:
-
"Patch Data Collection Job Status" - This link takes you to a detailed status page of the patch data collection job status.
-
"Last refreshed on" - This time stamp reflects the date and time when the list of recommended patch data was collected from My Oracle Support.
-
Refresh button - It is generally not required to refresh the results as the data is collected each day. However, if the "Last refreshed on" date is very old or if you want to ensure the data collection happens again, then you can click on the Refresh button to collect the latest list of recommended patches.
Clicking on the "Patch Data Collection Job Status" link takes you to the Job status page. Click on the Go button to display your search results, providing you with job activity details.
Note: Oracle E-Business Suite Application Patch Recommendations are available for Release 12.1.3 and later.
Oracle E-Business Suite Technology Stack Patch Recommendations including Database and Application Tier Patch Recommendations are available only for Oracle E-Business Suite Release 12.2 or later.
Oracle E-Business Suite Application Patch Recommendations
As mentioned previously, clicking on any bar in the graph in the Oracle E-Business Suite & Technology Stack Patch Recommendation region shows you the details of the patches to be applied on Oracle E-Business Suite and each technology component of the Oracle E-Business Suite Technology stack.
The first region of this page drills down into the Oracle E-Business suite recommended patch details.
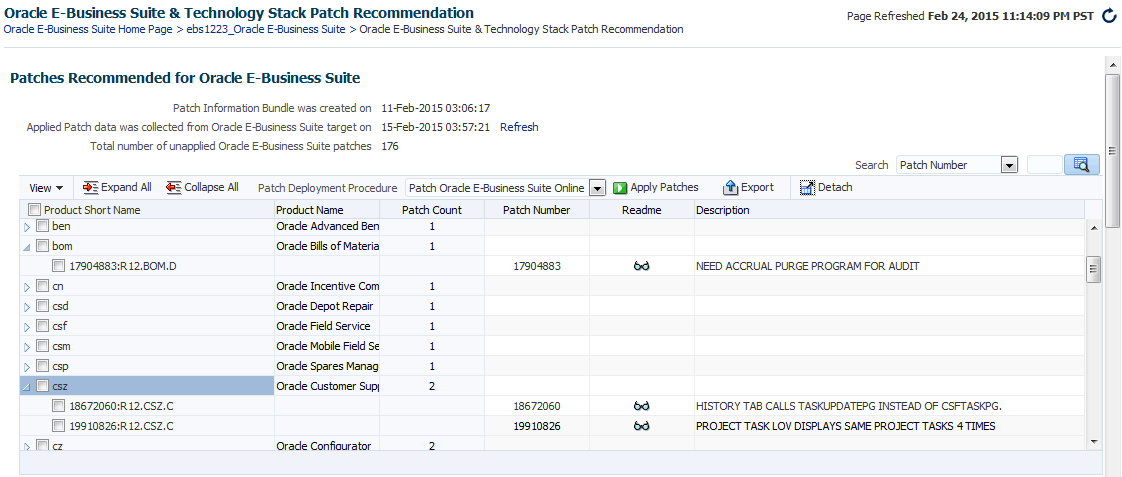
Descriptions of the elements in this region are as follows:
-
"Patch Information Bundle was created on" - The date/time stamp when Oracle created the patch information bundle. As data collection from My Oracle Support takes places on a daily basis, this date also indicates the date on which the data was last collected from My Oracle Support.
-
"Applied Patch data was collected from Oracle E-Business Suite target on" - The date and time in which the patches applied data was collect from the Oracle E-Business Suite instance. This collection job is run by the OMS agent on the Oracle E-Business Suite targets to collect applied patch information.
-
"Total number of unapplied Oracle E-Business Suite patches" - The number of recommended patches that need to be applied to this specific Oracle E-Business Suite instance.
-
Search field - Search for recommended patches for a particular product, product short name, or patch number.
-
Expand All and Collapse All buttons - Allow you to show as little or as much detail desired, based on the Product Short Name.
-
"Patch Deployment Procedure" - This drop-down list of values allows you to select the right patch deployment procedure specific to the Oracle E-Business Suite release. If you have any custom deployment procedures, that value will also be displayed in the list of values.
-
Apply Patches button - When clicked, this button will direct you to the patch interview pages of the appropriate patch interview process.
-
Export button - Use to export a list of recommended patches to an Excel file.
-
Refresh link - Collects the applied patch metrics from the target.
Patches Recommended for Oracle Database
Note: This section is relevant for Oracle E-Business Suite Release 12.2 and later.
The next section of the screen displays Oracle E-Business Suite Database patch recommendation details.

Descriptions of the elements in this region are as follows:
-
"Patch recommendation information was created on" - The date/time stamp when Oracle created the patch recommendation information. As data collection from My Oracle Support takes places on a daily basis, this date also indicates the date on which the data was last collected from My Oracle Support.
-
"Applied Patch data was collected from Oracle Database target on" - The date and time in which the patches applied data was collected from Oracle Database.
-
"Refresh" - Clicking on the "Refresh" link will force the collection of the latest patches applied on the target's Oracle home so that the recommendation can be reported on the target's current status.
-
"Total number of unapplied database patches" - The number of recommended database patches that need to be applied to this specific Oracle E-Business Suite instance.
-
Export button - Use to export a list of recommended patches to an Excel file.
-
Patch Number column - Lists the recommended patches
-
Patch Version column - Displays the version of the patch that is recommended
-
Footnote column - Provides special instructions which must be followed when applying the patch
-
Readme column - Displays the patch readme file from My Oracle Support. If MOS credentials are not set, then a "No Readme Available" message will be displayed.
-
Description column - Provides a description of the patch.
-
Refresh link - Collects the applied patch metrics from the target.
Oracle E-Business Suite Application Tier Technology Patch Recommendations
Note: This section is relevant for Oracle E-Business Suite Release 12.2 and later.
The following shows the patch recommendations for Oracle E-Business Suite Application Tier Technology components. Elements in here are similar to the ones described in previous sections.
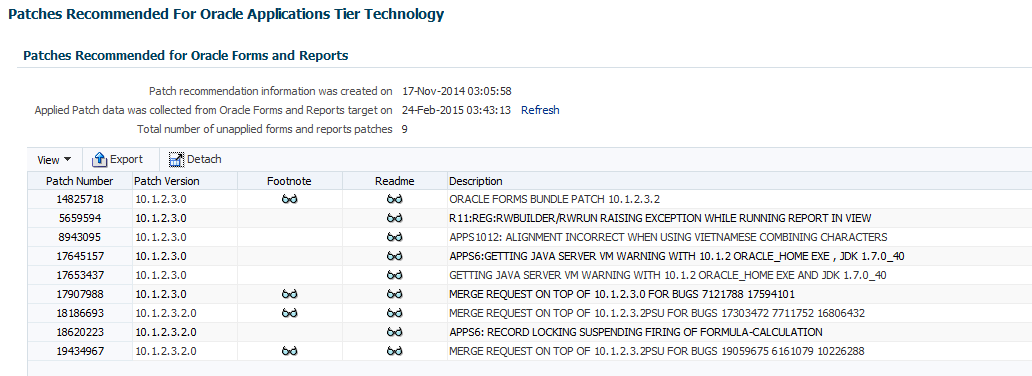


Note: Oracle Database and Oracle Application Tier Technology patches may be listed, despite already being applied. This may be due to the fact that some patches have bug fixes spawning to other patches. Apply all patches, in sequence, as listed in the table and then click the Refresh link to recollect the applied patch metrics from the target to view the correct patch recommendations.
Compliance Standards for Oracle E-Business Suite
Compliance evaluation generates a score for a target which indicates how much the target is compliant with the standard. Violation of a standard can be classified as Critical, Warning or Minor Warning.
The management pack includes a set of compliance standards for Oracle E-Business Suite security which will be associated to every Oracle E-Business Suite instance once it is discovered. Evaluation will happen periodically, which will ensure that the Oracle E-Business Suite is configured in a secure way.
The following table lists details of the compliance standards shipped along with the compliance rules associated with them.
| Compliance Standard | Rules Mapped to the Standard | Severity |
|---|---|---|
| Checks for profile validations in Oracle E-Business Suite | Checks for profile errors in Oracle E-Business Suite | Critical |
| Checks for profile validations in Oracle E-Business Suite | Checks for profile warnings in Oracle E-Business Suite | Warning |
| Checks for profile validations in Oracle E-Business Suite | Checks for profiles, missing in Oracle E-Business Suite | Critical |
| Compliance for Oracle E-Business Suite 10gR2 Database | Checks if PL/SQL optimize level set to default in Oracle E-Business Suite | Critical |
| Compliance for Oracle E-Business Suite 10gR2 Database | Checks the Database will be completely compatible with the software version 10gR2 | Critical |
| Compliance for Oracle E-Business Suite 11gR2 Database | Checks for default Database password users in Oracle E-Business Suite | Critical |
| Compliance for Oracle E-Business Suite 11gR2 Database | Checks the Database will be completely compatible with the software version 11gR2 | Critical |
| Compliance for Oracle E-Business Suite 11gR2 Database | Checks if parallel execution and Oracle RAC parameter set to recommended value for Oracle E-Business Suite | Critical |
| Compliance for Oracle E-Business Suite 12cR1 | Checks if parallel execution and Oracle RAC parameter set to recommended value for Oracle E-Business Suite | Critical |
| Compliance for Oracle E-Business Suite 12cR1 | Checks the Database will be completely compatible with the software version 12cR1 | Critical |
| Compliance for Oracle E-Business Suite 12cR1 | Checks if optimizer parameters used to turn off automatic statistics is set for Oracle E-Business Suite | Critical |
| Compliance for Oracle E-Business Suite 12cR1 | Checks for default Database password users in Oracle E-Business Suite | Critical |
| Checks for default APPL password users in Oracle E-Business Suite | Checks for default application password users in Oracle E-Business Suite | Critical |
| APPLSYSPUB unnecessary privileges check for Oracle E-Business Suite | APPLSYSPUB unnecessary privileges check for Oracle E-Business Suite | Warning |
| Server security check for Oracle E-Business Suite | Server security check for Oracle E-Business Suite | Warning |
| Checks for hashed passwords in Oracle E-Business Suite | Checks for hashed passwords in Oracle E-Business Suite | Warning |
| Checks if SSL (HTTPS) is enabled in Oracle E-Business Suite | Check if SSL (HTTPS) is enabled in Oracle E-Business Suite | Warning |
| Checks for mod security in Oracle E-Business Suite | Checks for mod security in Oracle E-Business Suite | Warning |
| Credit card encryption check in Oracle E-Business Suite | Credit card encryption check in Oracle E-Business Suite | Warning |
| Credit card encryption check in Oracle E-Business Suite | Supplement credit card encryption check in Oracle E-Business Suite | Warning |
| Credit card encryption check in Oracle E-Business Suite | Enhanced hashing in Oracle E-Business Suite | Warning |
| Compliance for Oracle E-Business Suite Database Configuration Standards | Checks if the parameter work area size policy is set to the default recommendation | Critical |
| Compliance for Oracle E-Business Suite Database Configuration Standards | Checks if the use of bitmap plans optimizer parameter is set to the default recommendation | Critical |
| Compliance for Oracle E-Business Suite Database Configuration Standards | Checks if NLS date default format is set for Oracle E-Business Suite | Critical |
| Compliance for Oracle E-Business Suite Database Configuration Standards | Checks if block size for Oracle E-Business Suite is 8K | Critical |
| Compliance for Oracle E-Business Suite Database Configuration Standards | Checks if the create columns semantics is using byte by default for Oracle E-Business Suite | Critical |
| Compliance for Oracle E-Business Suite Database Configuration Standards | Checks if the total size of the SGA is configured set to the default recommendation for Oracle E-Business Suite | Critical |
| Compliance for Oracle E-Business Suite Database Configuration Standards | Checks if version 7 dictionary accessibility support for Oracle E-Business Suite is set to False | Critical |
| Compliance for Oracle E-Business Suite Database Configuration Standards | Checks if the Cost Based Optimizer is set to FALSE for Oracle E-Business Suite | Critical |
| Compliance for Oracle E-Business Suite Database Configuration Standards | Checks if the treat LIKE predicate with bind as an equality predicate optimizer parameter is set to suggested value | Critical |
| Compliance for Oracle E-Business Suite Database Configuration Standards | Checks if the index fast full scan configuration set to the default recommendation | Critical |
| Compliance for Oracle E-Business Suite Database Configuration Standards | Checks for cursor sharing mode in Oracle E-Business Suite | Critical |
| Compliance for Oracle E-Business Suite Database Configuration Standards | Checks if the system management undo parameter is set for Oracle E-Business Suite | Critical |
| Compliance for Oracle E-Business Suite Database Configuration Standards | Checks if the cost ratio for sort elimination optimizer parameter is set to suggested value for Oracle E-Business Suite | Critical |
| Compliance for Oracle E-Business Suite Database Configuration Standards | Checks if optimizer parameters used to turn off automatic statistics is set for Oracle E-Business Suite | Critical |
| Compliance for Oracle E-Business Suite Database Configuration Standards | Checks if the database system triggers has been enabled for Oracle E-Business Suite | Critical |
| Compliance for Oracle E-Business Suite Database Configuration Standards | Checks if the Real Application Clusters parameter is set to TRUE startup in cluster | Critical |
The Compliance Standards region on the home page of the Oracle E-Business Suite instance provides details of the evaluations performed on that instance and how many violations there are. You can click on each standard to view further details of evaluations per rule. Each standard comes with a recommendation on how to fix the violations for that standard.
Note: Compliance standards will not be set for Oracle E-Business Suite instances discovered using the previous releases of the management pack. You must rediscover an instance to attach compliance standards to it.
Monitoring Online Patching to Detect Cutover
If the Oracle E-Business Suite target features online patching, false incidents will be raised for the patch edition targets being down or the whole Oracle E-Business Suite being down during cutover. To prevent this, the system keeps checking the patching activities to see if any cutover is in progress. Corrective actions are triggered once a cutover is detected. If there is any cutover in progress, the whole Oracle E-Business Suite target will be blacked out. This is true if the patching is done either from Patch Manager or Oracle E-Business Suite console. Once the cutover is complete (success or failure) the corrective actions will end the blackout of the Oracle E-Business Suite target and black out the correct patch edition.
Important Points to Note
-
The system should detect the cutover within 15 minutes, although there may be a delay depending on the load on the OMS and Agent.
-
Blackout is an asynchronous activity. Incidents may be raised even before blackout comes into effect. It is safe to ignore those incidents.
-
You will not be able to perform any management activities like cloning or package creation while corrective actions are in progress.
-
If the corrective actions fail to sync up the editions, you can do so manually. See: Administration of Oracle E-Business Suite.
-
If you upgraded the management pack from Release 12.1.0.2.0, you must rediscover your Oracle E-Business Suite Release 12.2 targets after your upgrade to attach the corrective actions.
Abandoned Nodes
During online patching, it is possible that a few nodes can get abandoned in the run edition. An incident will be raised if the system detects an abandoned node. An error message will be displayed on the home page of the corresponding Oracle E-Business Suite instance. You must either fix the node on the Oracle E-Business Suite side and perform a rediscovery or exclude the node using discovery customization and rediscover.
Monitoring Current Activity
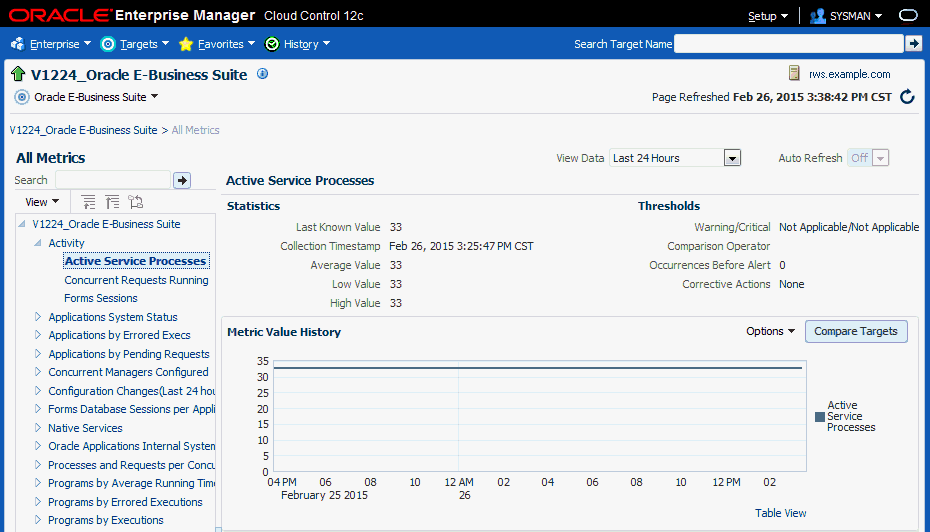
Activity metrics are collected for the Oracle E-Business Suite target. These metrics provide details of current activities going on the Oracle E-Business Suite instance. Select Monitoring > All Metrics from the instance target menu. Expand the metric named Activity. You can see the trends for service processes, concurrent processing, and Forms.
Monitoring User Sessions
When a user logs in to Oracle E-Business Suite, the system creates sessions in the database identified by a unique session ID, or SID. All of these user sessions are created using the APPS schema credential. Each database session is associated with an Oracle E-Business Suite application user. This feature enables linking the database session with the corresponding application user for monitoring and troubleshooting purposes. You will be able to pinpoint how the Oracle E-Business Suite user opened a database session and whether it is with a concurrent processing, Forms, or Self-Service application.
For information on diagnostic tests for this feature, see: Diagnostic Tests for User Monitoring.
Mandatory Settings
The following settings are mandatory:
Settings on the OMS
Set the preferred credentials of the "Oracle E-Business Suite" target type for the credential set AppsUserCredsSet. You must provide the Oracle E-Business Suite user login credentials.
For information on setting preferred credentials, see: Set Preferred Credential for Oracle E-Business Suite Application Login.
Settings on the Oracle E-Business Suite
-
For the above Oracle E-Business Suite user, assign "LCM_EM_CLIENT" responsibility.
-
Form sessions can be monitored only when the site-level profile Sign-On:Audit Level is set to 'FORM'. The internal name for this profile is 'SIGNONAUDIT:LEVEL'.
Top Sessions
This page will show four bar charts of database sessions triggered by the APPS database user.
-
Top waiting sessions: sessions waiting for a database event to trigger to proceed further.
-
Top running SQL statements.
-
Top CPU consuming sessions.
-
Top memory intense sessions.
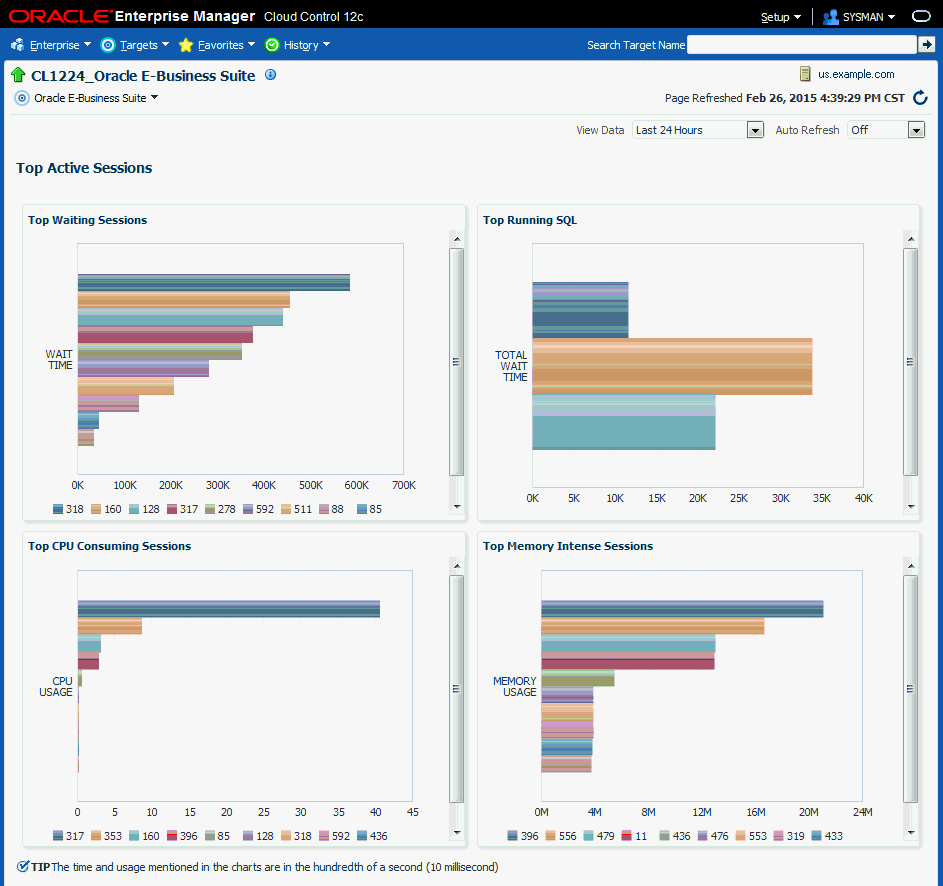
The level of detail shown in the bar graphs is controlled by properties set on the Preferences page. See: Setting Preferences.
-
Sampling Interval for User Monitoring. The sample interval default is 60 minutes (which is also the maximum interval allowed).
-
Number of Rows in tables of User Monitoring.
You can drill down from the legend to see the details of the session. If the Oracle E-Business Suite user information is available, the Oracle E-Business Suite session details is shown with further drilling down available to the database session details. If the Oracle E-Business Suite user information is not available (that is, the database sessions were triggered by a background process and not by a user), you can drill down to the database session details directly.
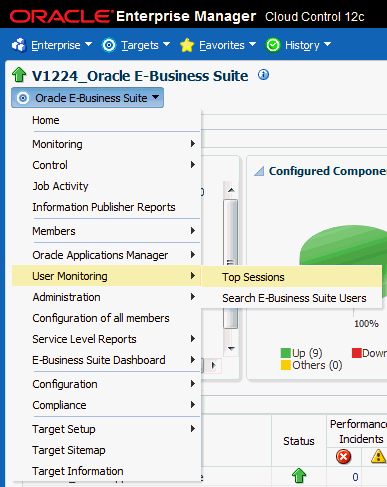
To navigate to the Top Sessions page, select User Monitoring > Top Sessions from the instance target menu.
Searching for User Sessions
You can search for Oracle E-Business Suite user sessions using:
-
Database Session ID - Provide the database sessions ID and if a match is found with a concurrent program, Form, or Oracle Application Framework page, the details will be shown with a drill-down facility to the database session details.
-
Oracle E-Business Suite user name - This search shows all active concurrent programs, Forms, and Oracle Application Framework pages accessed by the user. It will also show the associated database session ID with drill down capability.
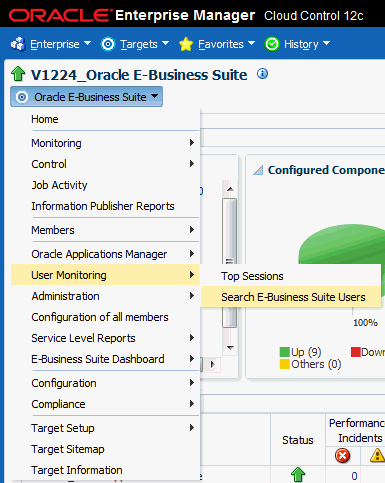
To navigate to user sessions search, select User Monitoring > Search E-Business Suite User from the instance target menu.
Monitoring JVM Usage
Note: This feature is not supported for Oracle E-Business Suite Release 12.2 in this release. Users wanting to monitor Oracle E-Business Suite Release 12.2 and later should consider using the Oracle WebLogic Server Management Pack Enterprise Edition, which provides JVM monitoring and JVMD.
Starting from Release 12.1.0.3.0, this feature is disabled by default. You must enable it by following the setup steps below.
You can monitor JVM usage parameters specific to Oracle E-Business Suite Release 12.1. You can review the following parameters for each of the oacore J2EE containers in which a given Oracle E-Business Suite instance is deployed.
-
Application Module pool - Provides information about all active and leaked application modules.
-
Locked AOLJ Connections - Provides information about all locked and leaked AOL/J connections utilized by applications.
-
Cache Components - Provides information about the cache component utilization by Oracle Application Framework.
Setup Steps
For Release 12 systems, ensure that you have set up the monitoring configuration for each "oacore" OC4J target as follows:
-
In the Targets Running on Nodes section in the Oracle E-Business Suite instance home page, click on the "oacore" OC4J target. This will take you to the home page of the target.
-
On the home page of the oacore OC4J target, select Target Setup > Monitoring Configuration in the instance target menu.
-
Enter the OC4J administrator username and password for the "oacore" OC4J in the "Username for Basic authorization" and the "Password for Basic authorization" fields, respectively.
Note: The OC4J administrator username by default is "oc4jadmin" and is specified in the system-jazn-data.xml file under the $INST_TOP/ora/10.1.3/j2ee/oacore/config directory. The oc4jadmin password by default is set to a randomized value during installation and will need to be reset as in the following example:
In the $INST_TOP/ora/10.1.3/j2ee/oacore/config/system-jazn-data.xml file, set the value of the "credentials" element for oc4jadmin user to your chosen password preceded by a ! character. For example:
<user>
<name>oc4jadmin</name>
<display-name>OC4J Administrator</display-name>
<description>OC4J Administrator</description>
<credentials>![new password]</credentials>
</user>
After saving system-jazn-data.xml, restart the oacore OC4J. This step encrypts the updated password in system-jazn-data.xml.
-
Click OK to save the information.
For both Release 11i and Release 12, ensure that the Application Server passwords are also set, as Oracle Enterprise Manager expects these passwords to be set for metrics collection for the JVM targets.
Command to enable the metric collection
./emcli modify_collection_schedule -force
-targetType="oracle_apps_jvm"
-targetNames="<targetName1>,<targetName2>"
-collectionName="LockedAOLJConn"
-collectionStatus="Enabled" -preview=N -freqType="Minute"
-freqValue="1"
./emcli modify_collection_schedule -force
-targetType="oracle_apps_jvm"
-targetNames="<targetName1>,<targetName2>"
-collectionName="AMPoolCount"
-collectionStatus="Enabled" -preview=N -freqType="Minute"
-freqValue="1"
./emcli modify_collection_schedule -force
-targetType="oracle_apps_jvm"
-targetNames="<targetName1>,<targetName2>"
-collectionName="CachedObjects"
-collectionStatus="Enabled" -preview=N -freqType="Minute"
-freqValue="1"
Command to disable the metric collection
emcli modify_collection_schedule
-targetType="oracle_apps_jvm"
-targetNames="<targetName1>,<targetName2>"
-collectionName="LockedAOLJConn"
-collectionStatus="Disabled" -preview=N emcli modify_collection_schedule
-targetType="oracle_apps_jvm"
-targetNames="<targetName1>,<targetName2>"
-collectionName="AMPoolCount"
-collectionStatus="Disabled" -preview=N emcli modify_collection_schedule
-targetType="oracle_apps_jvm"
-targetNames="<targetName1>,<targetName2>"
-collectionName="CachedObjects"
-collectionStatus="Disabled" -preview=N
To find out the oracle_apps_jvm target names associated with an Oracle E-Business Suite instance, go to the All Targets page and search for <ebs_instance_name>%oacore_jvm_1_apps.
Note: It is important to set the oc4j admin username and password at the EBS as per the mandatory setups mentioned above. If you enable this metric without doing that, it can result in the flooding of metric collection errors at the OMS repository.
Monitoring Templates for Oracle E-Business Suite
Monitoring templates let you standardize monitoring settings across your Oracle E-Business Suite environments by allowing you to specify the monitoring settings once and apply those to your monitored targets. You can save, edit, and apply these templates across one or more targets. A monitoring template is specified for a particular target type and can only be applied to targets of the same type. For example, you can define one monitoring template for Oracle E-Business Suite test instances and another monitoring template for Oracle E-Business Suite production instances. For more descriptions of Oracle Certified Templates and Oracle Provided Templates please see the latest Oracle Enterprise Manager Cloud Control Administrator's Guide.
Note: Currently, Oracle delivered templates may not have many out-of-box metric values. However, you can set these metric values by observing the trend in your own environment over a period of time. You can view some of the trend information by examining Average value, Low value, and High value statistics for each metric that you are monitoring using the template.
Managing Out-of-Box Monitoring Templates for Targets for Oracle E-Business Suite
Navigate to monitoring templates using the path Enterprise (menu) > Monitoring > Monitoring Templates.
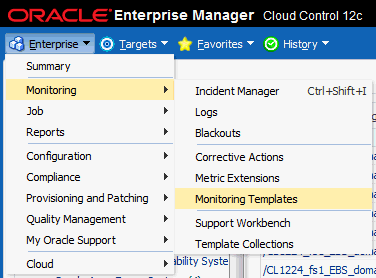
Users must have the required privilege(s) to manage monitoring templates. The privilege(s) for the view/edit/create like/delete functions for managing out-of-box monitoring templates for the management pack are the same as that for all out-of-box monitoring templates. See: Oracle Enterprise Manager Cloud Control Administrator's Guide for more information.
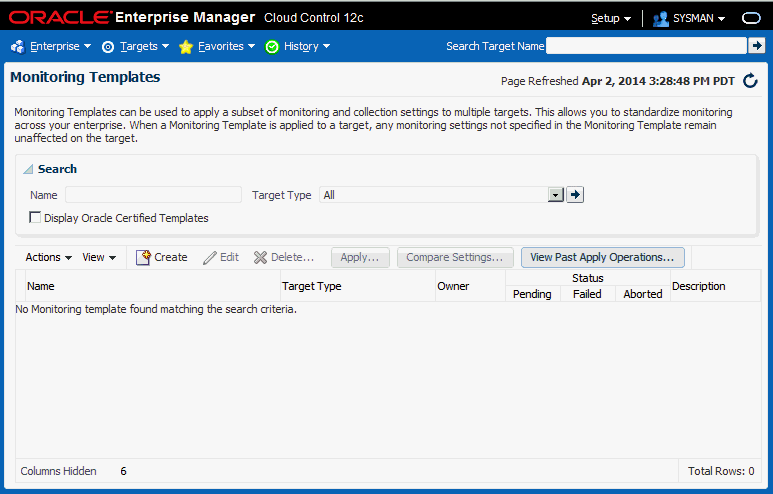
Viewing Out-of-Box Monitoring Templates
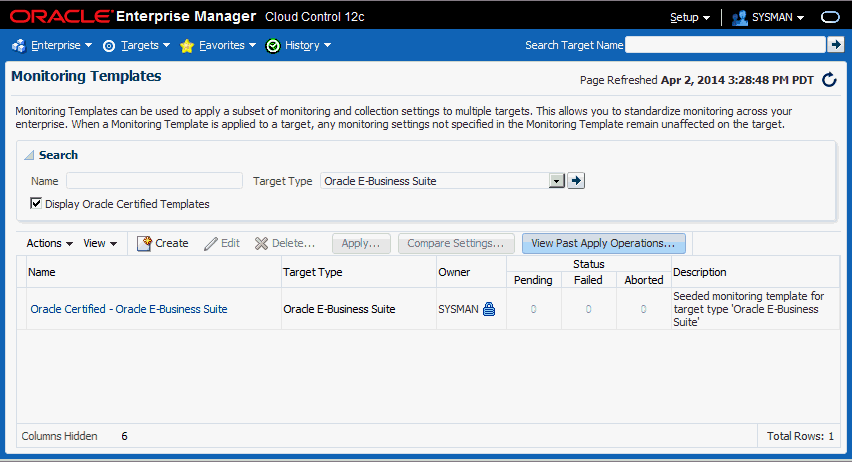
To view out-of-box monitoring templates, select the “Display Oracle Certified Templates” check box and search for templates. All Oracle-certified templates are displayed.
Default Listing of the Monitoring Templates
Out-of-box monitoring templates are called ‘Oracle Certified Templates.’ By default, the Oracle Certified Templates are not displayed.
Find Out-of-Box Monitoring Templates for Oracle Application Management Pack for Oracle E-Business Suite
Search for out-of-box monitoring templates for management pack targets by selecting the "Display Oracle Certified Templates" check box and selecting the Target Type in the drop-down list. Alternatively, you can simply search for the target name.
Currently, out-of-box monitoring templates are supported for the following targets:
-
Oracle E-Business Suite
-
Oracle Concurrent Manager
-
Concurrent Processing Service
-
Oracle Workflow Agent Listener
-
Oracle Workflow Background Engine
-
Oracle Workflow Notification Mailer
-
Workflow Service
-
Oracle Applications JVM Usage
-
Self Service Application Service
-
Forms Based Applications Service
Note: This is only applicable for 12.1.x. Since the Forms service targets metrics that are promoted in 12.2 are different, monitoring templates shipped in this release are not applicable for 12.2.
Editing Out-of-Box Monitoring Templates
Editing an out-of-box monitoring template is not permitted in all Enterprise Manager versions. Please check Oracle Enterprise Manager Cloud Control Administrator's Guide for more information.
In addition, the Edit option is enabled only if the user has the required privilege to edit a monitoring template through Enterprise Manager. Management pack templates follow the same restrictions as all out-of-box monitoring templates.
The Monitoring Templates home page lists all viewable templates. To display out-of-box templates, search using the criterion ‘Oracle Certified Templates’.
To edit a template:
-
From the Enterprise menu, select Monitoring, and then Monitoring Templates.
-
Choose the desired out-of-box monitoring template from the table.
-
Click Edit.
-
Once you have finished making changes, click OK.
Copying an Out-of-Box Monitoring Template
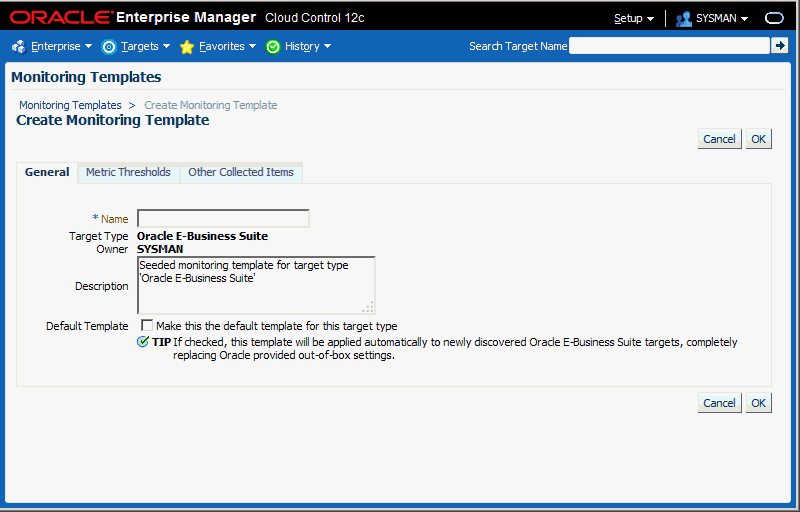
To create a template based on an existing template, select the template, go to Actions, and select Create Like.
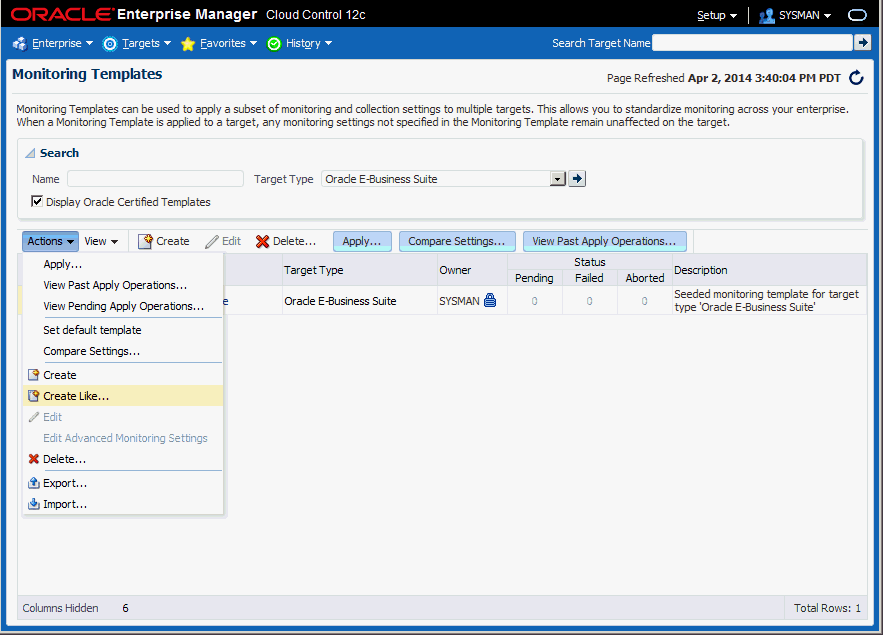
Enter the inputs for ‘General’, ‘Metric Thresholds’, and ‘Other Collected Items’ and click OK.
Deleting an Out-of-Box Monitoring Templates
Out-of-box monitoring templates cannot be deleted.
Applying a monitoring template to an Oracle E-Business Suite target
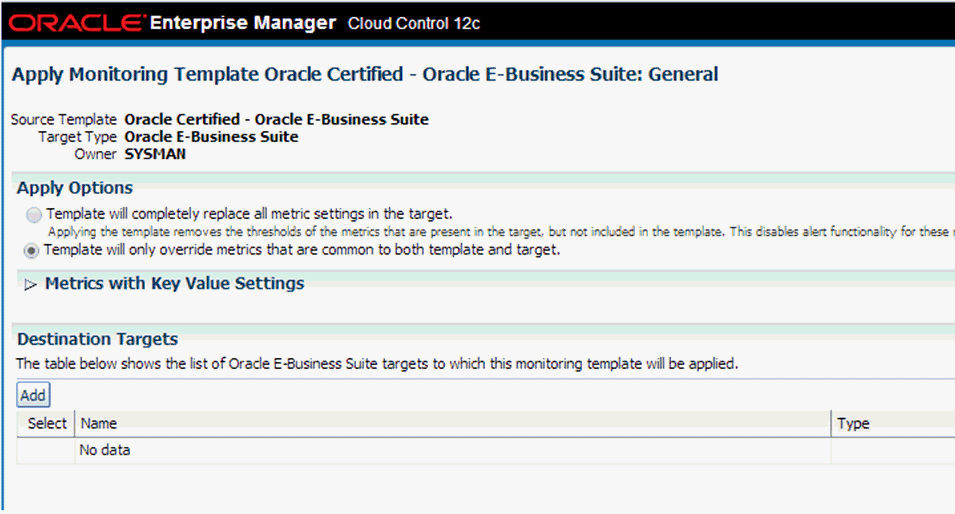
An out-of-box monitoring template can be applied to a management pack target based on the target type. To apply a template, you must have at least Manage Target Metrics target privileges on the destination target(s).
-
From the Enterprise menu, select Monitoring and then Monitoring Templates.
-
Select the desired template from the table.
-
Click Apply.
-
Select the desired apply options and the target(s) to which you want the templates applied. See Oracle Enterprise Manager Cloud Control Administrator’s Guide for more information.
-
Click OK.
Other Features of Monitoring Templates
All other features of out-of-box monitoring templates such as ‘Compare Settings’ and ‘View Past Apply Operations’ are valid for out-of-box monitoring templates in the management pack.
Defining or modifying the threshold values in the out-of-box monitoring templates
Currently, the Oracle Application Management Pack for Oracle E-Business Suite supplies the out-of-box monitoring templates with default values. To define the threshold values in out-of-box monitoring templates, the following steps are involved:
-
Observe the trend of the metrics for the targets.
-
Determine the threshold values based on observation.
-
Modify the threshold values by editing the template.
-
Apply the modified template to the target.
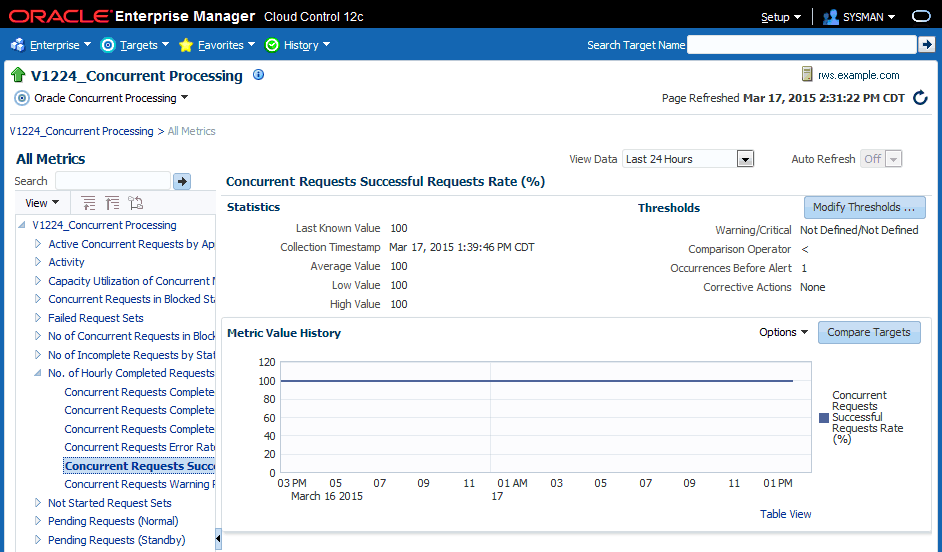
To check the trend of the metrics for the target, on the target's home page target menu (labeled "Oracle Concurrent Manager"), navigate to Monitoring > All Metrics. Select any metric, and check ‘Metric Value History’. Change the ‘View Data’ period based on the time of analysis.
Enabling Service Tests and Beacons Link
Administrators can define service tests for Oracle E-Business Suite services and can also define their own ATS transactions to determine the health of an application (for example, whether the application is rendering the correct pages and functional flows are intact). All Oracle E-Business Suite service targets support the Service Test Types of ATS and HTTPPING. For more information on service tests, service test types, beacons, and Oracle Application Test Suite (OATS), see the section "Configuring and Using Services" in the Oracle Enterprise Manager Cloud Control Administrator's Guide.
The following services have the 'Service Tests and Beacons' link enabled:
-
oracle_apps_svc_cp (Concurrent Processing Service)
-
oracle_apps_svc_ebs (Oracle Applications Service)
-
oracle_apps_svc_forms (Forms Based Applications Service)
-
oracle_apps_svc_ssa (Self-Service Applications Service)
-
oracle_apps_svc_wf (Workflow Service)
The basic steps to create such a test are as follows:
-
Navigate to the Service target home page.
-
Select the Service link.
-
Click on the Monitoring Configurations tab.
-
Select the Service Tests and Beacons link.
-
Select ‘Test Type’ as ‘ATS Transaction’ and click Add.
-
Enter an appropriate name.
-
Click the Upload button and select the OATS script zip file.
-
Add a Beacon to monitor the Service Test. The Enterprise Manager Management Beacon default is available.
-
Enable the Service Test.
-
Click OK.
For more detailed information, see the Creating an ATS Service Test section of the Oracle Enterprise Manager Cloud Control Administrator's Guide.
Seeded ATS Test Transaction for Self-Service Applications Service
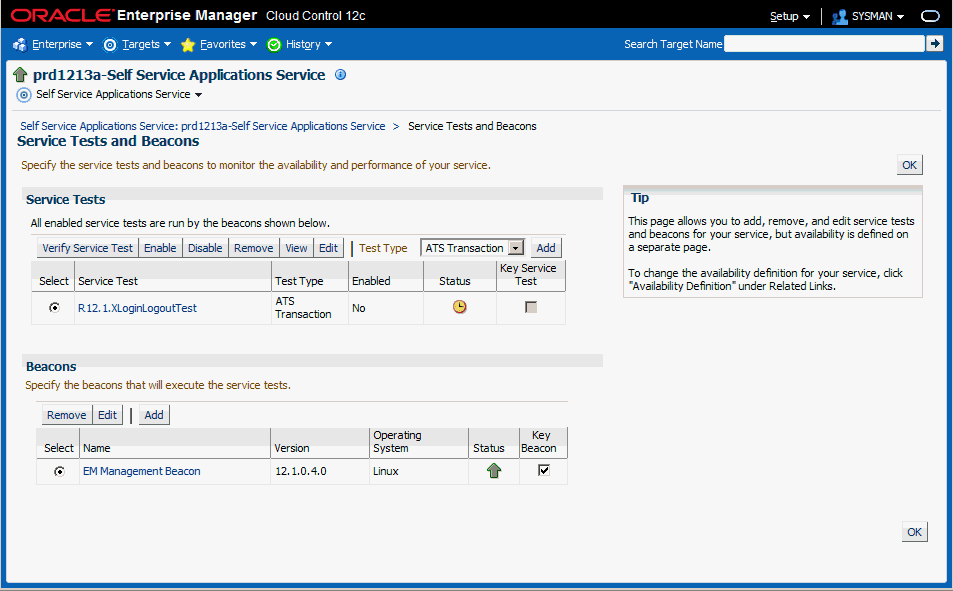
A sample ATS test script is shipped out of the box for a login/logout test against Oracle E-Business Suite 12.1.x instances. This script will only work if the 12.1.x instance is not SSL configured. This ATS test transaction is configured during the discovery time of the 12.1.3 Oracle E-Business Suite instance against ‘Self-Service Applications Service.’ An end user needs to enable the ATS transaction and edit it with a correct Oracle E-Business Suite username and password.
-
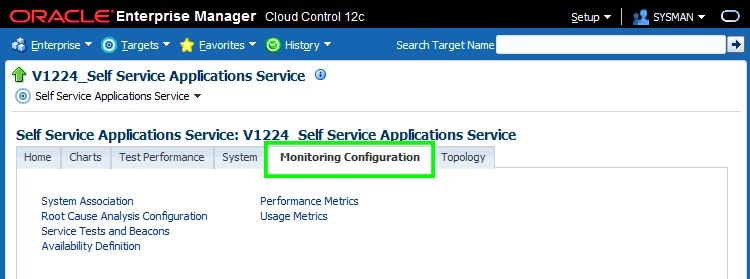
Click on the Monitoring Configuration tab from the Self-Service Applications Service home page.
-
Click on the 'Service Tests and Beacons' link.
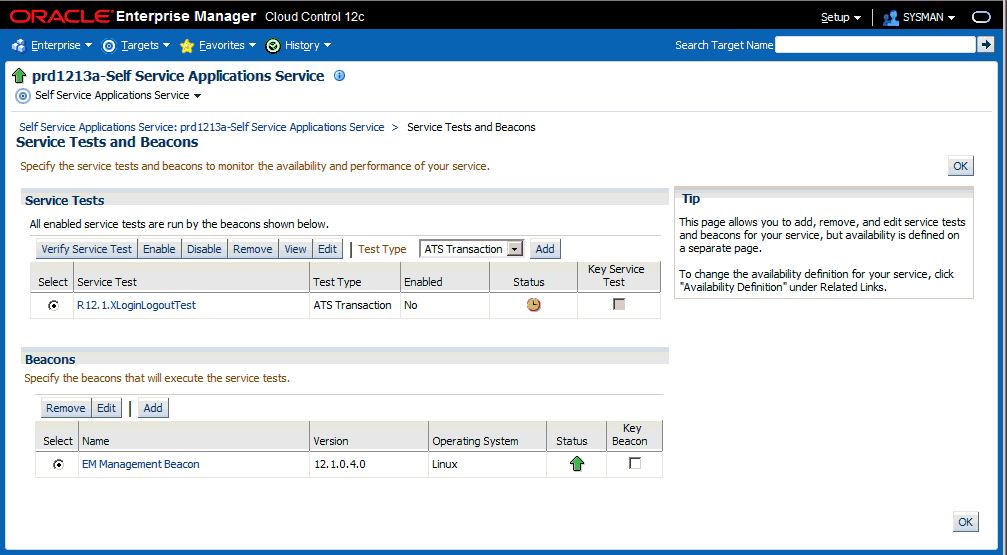
-
The default ATS service test is disabled. First mark the default beacon, ‘EM Management Beacon’ as ‘Key Beacon’ in the Beacons region. Then click on the Enable button for the Service Test.
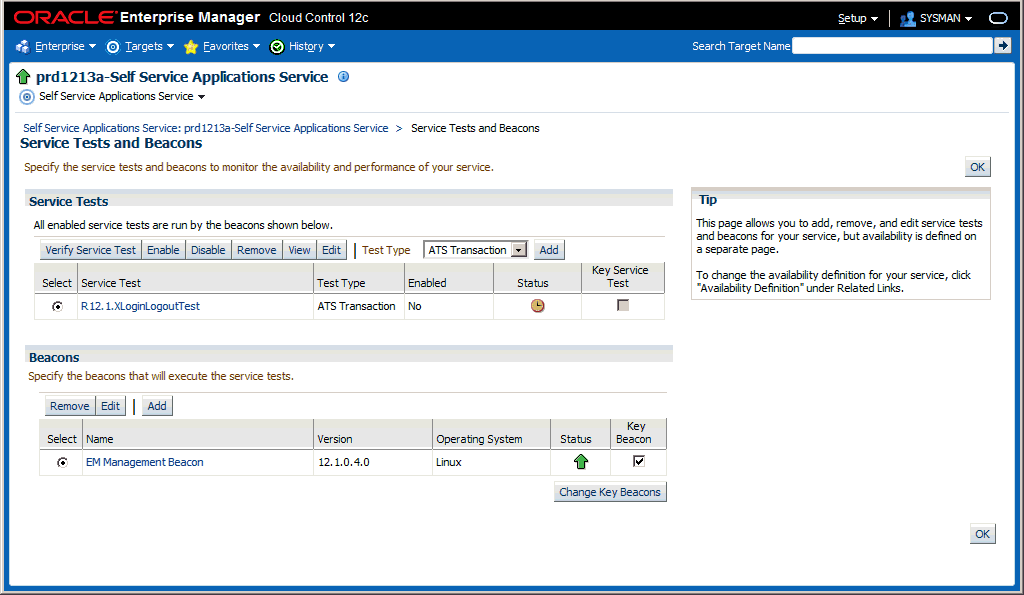
-
Click on Edit.
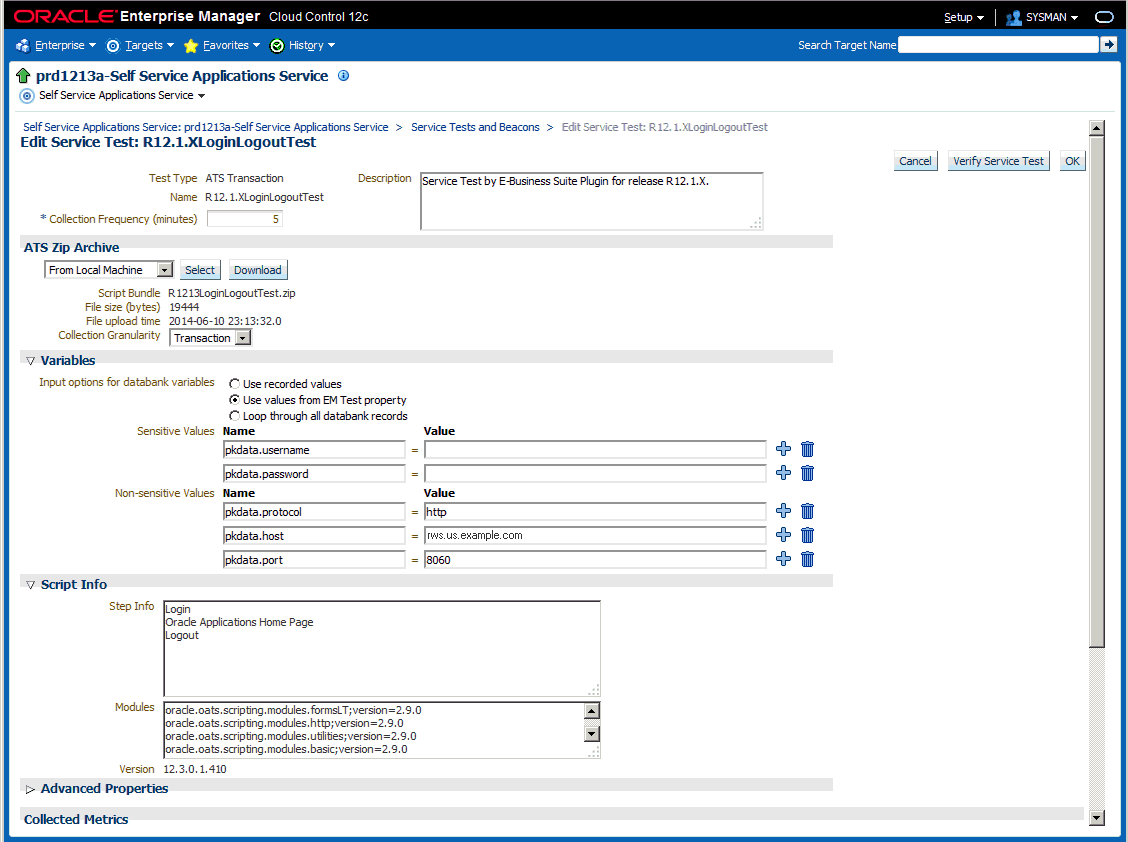
-
Enter the Oracle E-Business Suite applications username and password under Variables, Sensitive Values. Click OK.
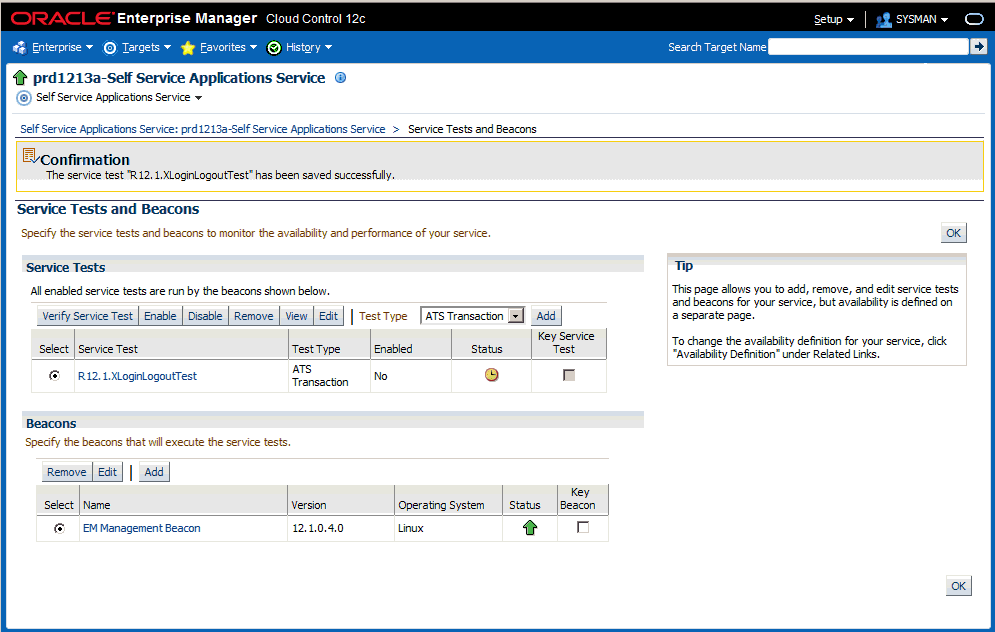
-
Again, click the OK button from the Service Tests and Beacons home page to ensure that the changes are saved.
-
You can verify service test as follows:
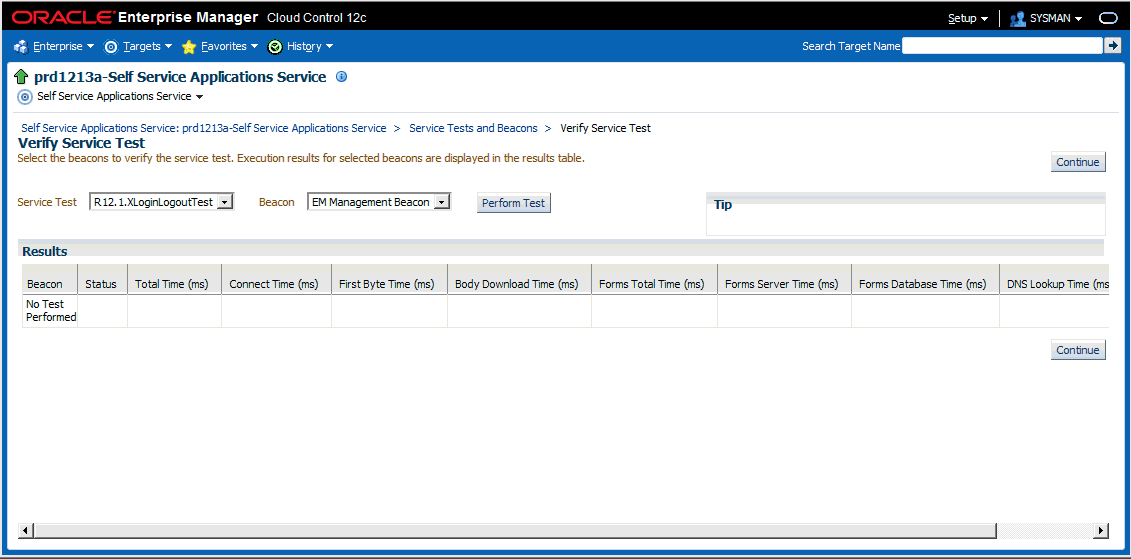
Click the Verify Service Test button in the Service Tests region.
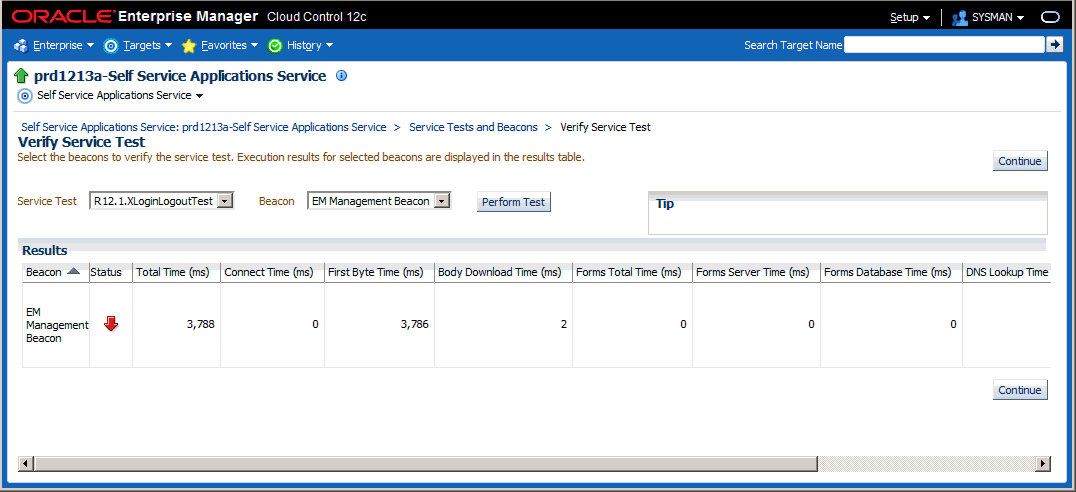
Click the Perform Test button.
Execution results are displayed in the results table.
-
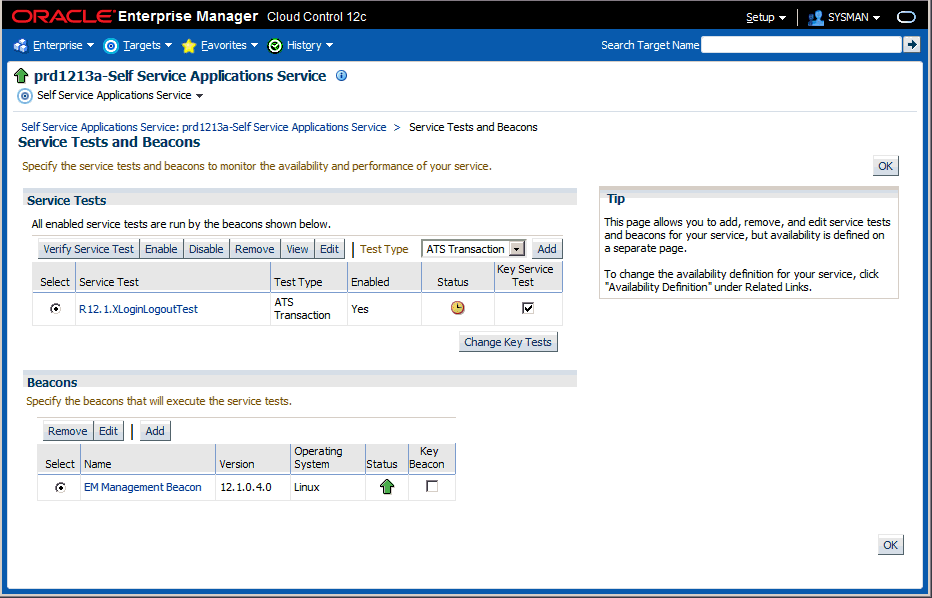
You need to mark this service as ‘Key Service Test’ so that it starts contributing to the availability.
Select the Key Service Test check box and click the Change Key Tests button.
For more details see the chapter "Configuring and Using Services" in the Oracle Enterprise Manager Cloud Control Administrator's Guide.
Drilling Down to Oracle Applications Manager
You can drill down to the Oracle Application Manager of each Oracle E-Business Suite instance from Oracle E-Business Suite plug-in. Select Oracle Applications Manager from the instance target menu.
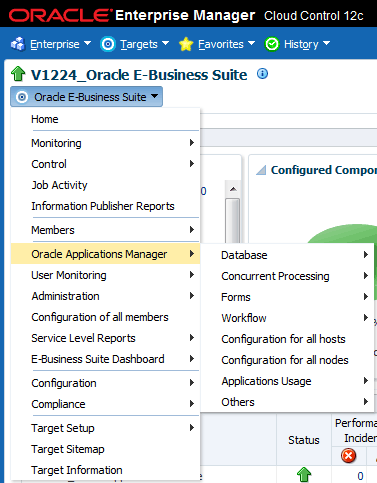
You can access the following sections and its subsections in Oracle Applications Manager:
-
Database
-
Concurrent Processing
-
Forms
-
Workflow
-
Configuration of all hosts
-
Configuration of all nodes
-
Applications Usage
-
Others
Services
Performance of Services
The metrics collected from a service's critical components are used to evaluate the performance of each service. The following table lists the performance metrics for each service.
| Service | Metric | Description |
|---|---|---|
| Concurrent Processing Service | Concurrent Requests Success Rate | Successfully completed requests per hour |
| Concurrent Processing Service | Concurrent Requests Error Rate | Failed requests per hour |
| Forms Service | Forms Response Time | Average response time of forms in milliseconds |
| Forms Service | Forms Requests per Second | Average of number of requests processed by the Forms server per second |
| Forms Service | HTTP Server Request Throughput | Average of number of requests processed by the HTTP server per second |
| Workflow Service | Pending Agent Listener Events | Count of pending agent listener events |
| Workflow Service | Pending Mailer Notification Events | Count of pending mailer notification events |
| Workflow Service | Pending Mailer Notifications | Count of pending mailer notifications |
| Self-Service Applications Service | OACore requests per second | Average of number of requests processed by the oacore server per second |
| Self-Service Applications Service | HTTP Server Request Throughput | Average of number of requests processed by the HTTP server per second |
Usage by Services
The metrics collected from a service's critical components are used to evaluate the resources used by each service. The following table lists the usage metrics for each service.
| Service | Metric | Description |
|---|---|---|
| Concurrent Processing Service | Running Requests per Hour | Number of requests running per hour |
| Concurrent Processing Service | Active Service Processes | Number of active services running per hour |
| Forms Service | Forms server CPU usage | Percentage of CPU used by the Forms server |
| Forms Service | HTTP server CPU usage | Percentage of CPU used by the HTTP server |
| Forms Service (Socket Mode) | Total Memory Utilization | Percentage of the total memory used by the Forms process |
| Forms Service (Socket Mode) | Total CPU Utilization | Percentage of CPU used by the Forms process |
| Forms Service (Socket Mode) | Number of Forms Processes | Total number of Forms processes that are running |
| Workflow Service | Background Engine Deferred Items | Number of items deferred by the background engine yet to be processed |
| Self-Service Applications Service | OACore CPU usage | Percentage of CPU used by the oacore server |
| Self-Service Applications Service | HTTP server CPU usage | Percentage of CPU used by the HTTP server |
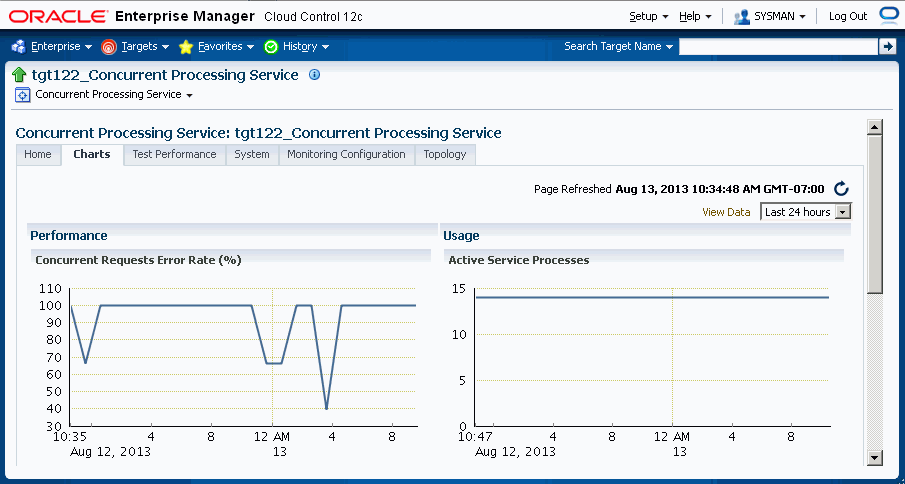
Charts for services
To see charts based on the above performance and usage metrics, go to the home page of each service and click on the Charts tab.
Incidents for Services
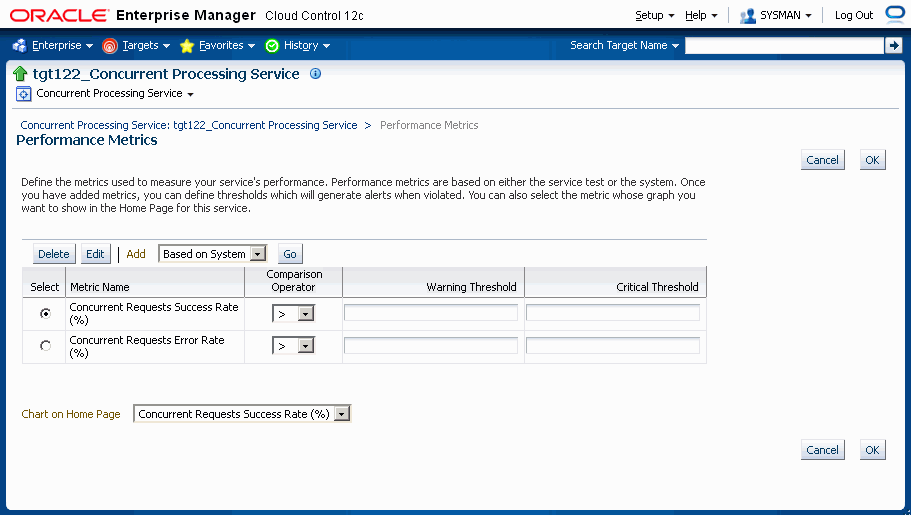
You can set thresholds for tracking the performance and usage of services. Incidents are generated once the metrics exceed the threshold. To set the threshold, go to the home page of the service and click on the tab Monitoring Configuration. Click on the link "Performance Metrics" or "Usage Metrics". You can set the warning and critical threshold for performance and usage metrics on the respective pages.
The Services section on the Oracle E-Business Suite home page provides the details described in the following table:
| Column | Description |
|---|---|
| System | The Oracle E-Business Suite system whose members are providing the service. |
| Performance Incidents | Number of performance incidents which are classified as Critical or Warning. You can drill down from here to get the details of the incidents by clicking on the number. |
| Usage Incidents | Number of usage incidents which are classified as Critical or Warning. You can drill down from here to get the details of the incidents by clicking on the number. |
| Key Components Status | The status of the key components. The service will be shown as "down" if any of the key components is down. You can drill down from here by clicking on the number. |
| Key Components Incidents | Incidents (Critical and Warning) raised against key components of the service. You can drill down from here by clicking on the number. |
Services Dashboard
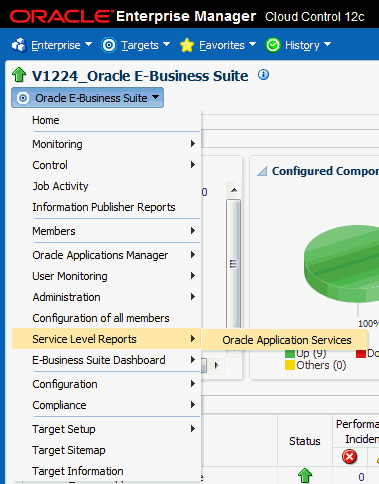
Extending the service dashboard feature provided by Cloud Control, Oracle E-Business Suite also has a dashboard which provides a brief summary of all service-related information. You can access it by selecting Service Level Reports > Oracle Application Services from the instance target menu.
Concurrent Processing Dashboard
The Concurrent Processing Dashboard provides you with details in concurrent processing in your Oracle E-Business Suite system. The dashboard gives you a complete picture of concurrent processing on your system, both current activities as well as usage statistics.
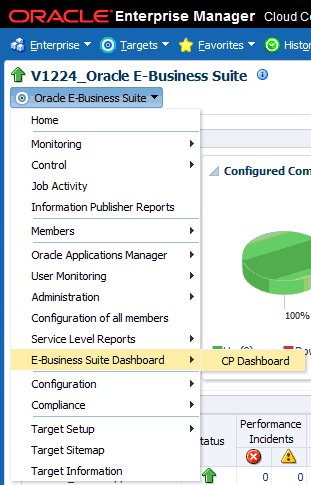
To navigate to the Concurrent Processing Dashboard, select E-Business Suite Dashboard > CP Dashboard from the instance target menu.
Discovery of Concurrent Processing Targets
When you discover an Oracle E-Business Suite instance, the concurrent processing-related targets are discovered. This includes the Apps Listener, Internal Concurrent Manager, Output Post Processor, Internal Monitor, Service Manager, and Conflict Resolution Manager. The Oracle Application Management Pack for Oracle E-Business Suite supports the monitoring of parallel concurrent processing.
There is a provision to discover all concurrent managers during discovery of the Oracle E-Business Suite instance, although it is disabled by default. If needed, you can enable it by customizing the discovery. See the section Customization at the Instance Level in Customizing Discovery.
Note: Discovery of core managers and all concurrent managers are new features introduced in Release 12.1.0.4.0. This feature will not work if the agent is not at the same release level as the OMS.
Overview Tab
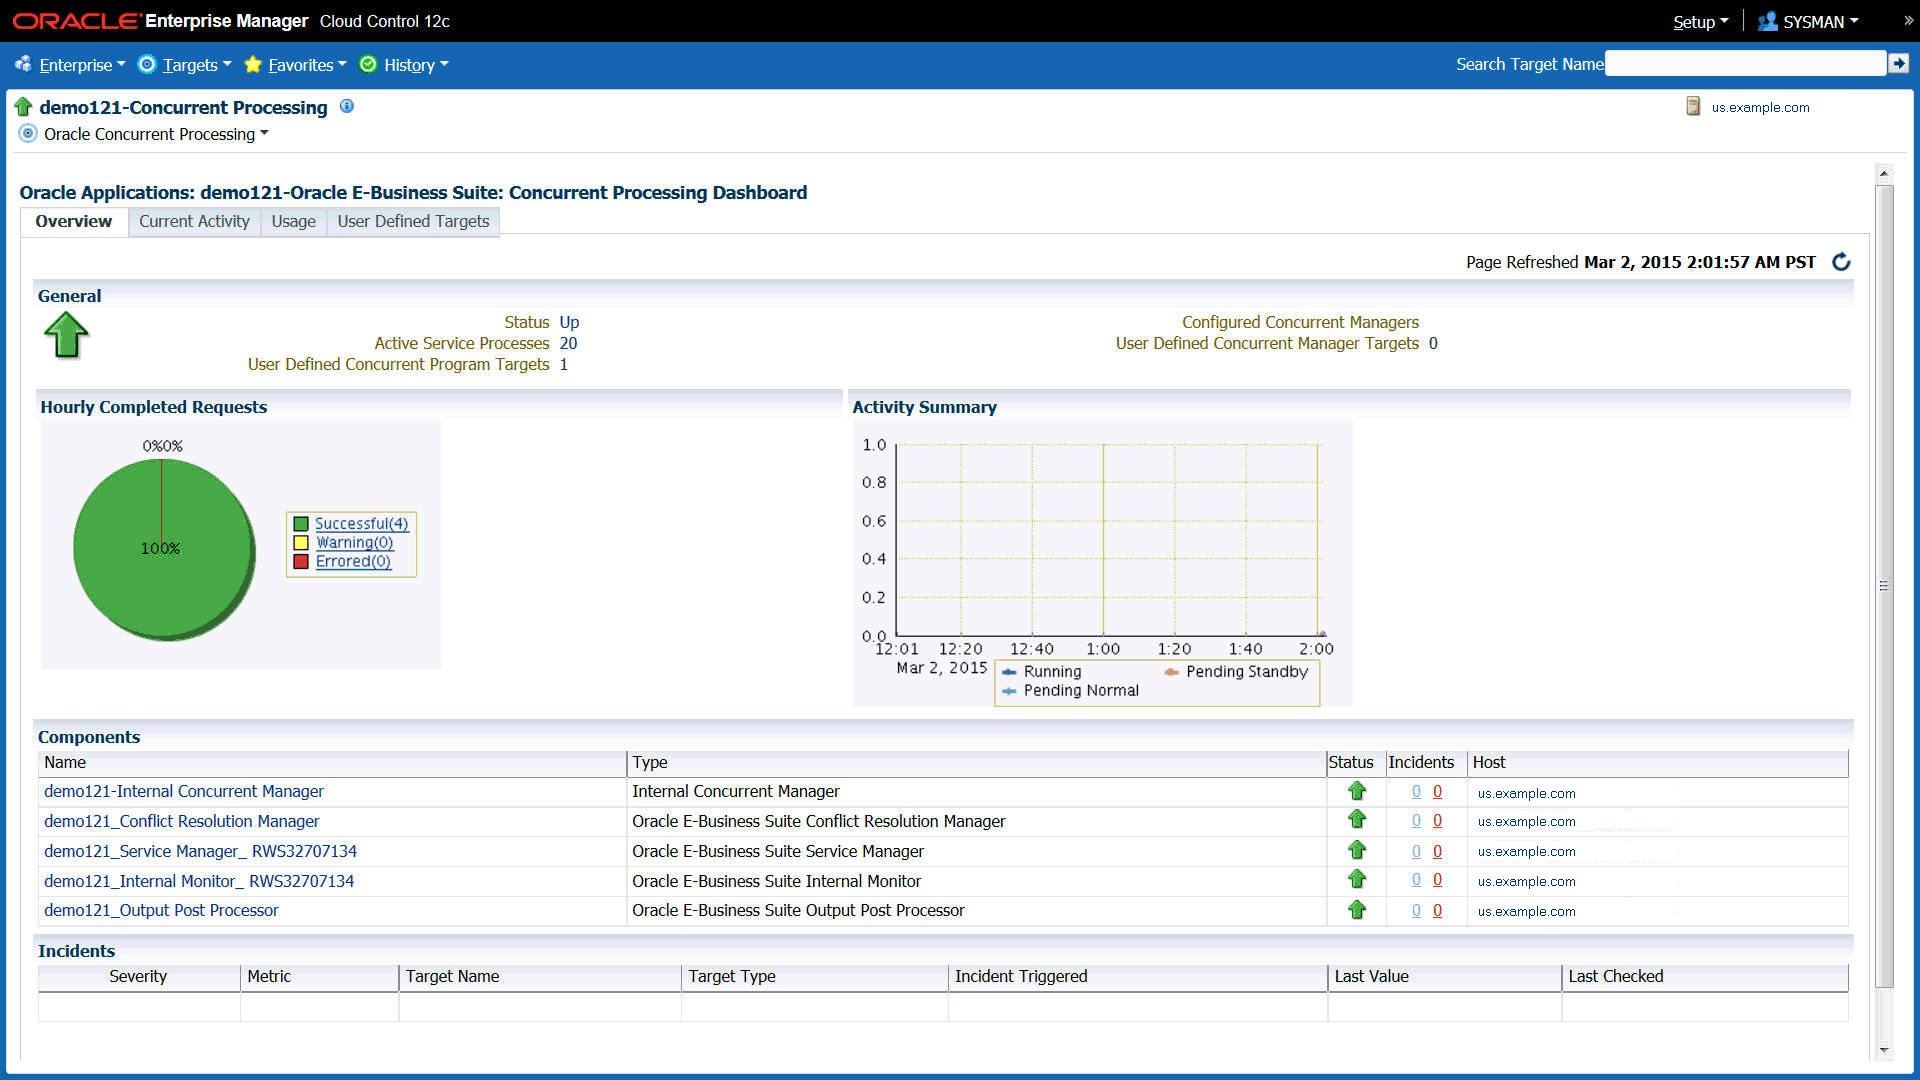
The Overview tab provides a summary of the concurrent processing infrastructure.
The General region includes details on the status of the concurrent processing service:
-
Status - The status is linked to the Concurrent Processing Service home page.
-
Active Service Processes - Number of active service processes.
-
User-Defined Concurrent Program Targets - Shows the total number of user-defined programs that are being monitored.
-
Configured Concurrent Managers - The number of configured concurrent managers.
-
User Defined Concurrent Manager Targets - Shows the total number of user-defined managers that are being monitored.
The Hourly Completed Requests region shows a pie chart for requests by status (Successful, Warning, and Errored).
The Activity Summary graph illustrates active requests in the following statuses:
-
Pending Normal
-
Pending Standby
-
Running
The Components region lists components of the Concurrent Processing service. The table shows the following for each component:
-
Name
-
Type
-
Status
-
Incidents
-
Host

The Incidents region lists any incidents that were triggered recently, with the following information for each:
-
Severity
-
Metric
-
Target Name
-
Target Type
-
Incident Triggered
-
Last Value
-
Last Checked
Current Activity Tab
The Current Activity tab gives details of the concurrent processing that is taking place at any point in time.
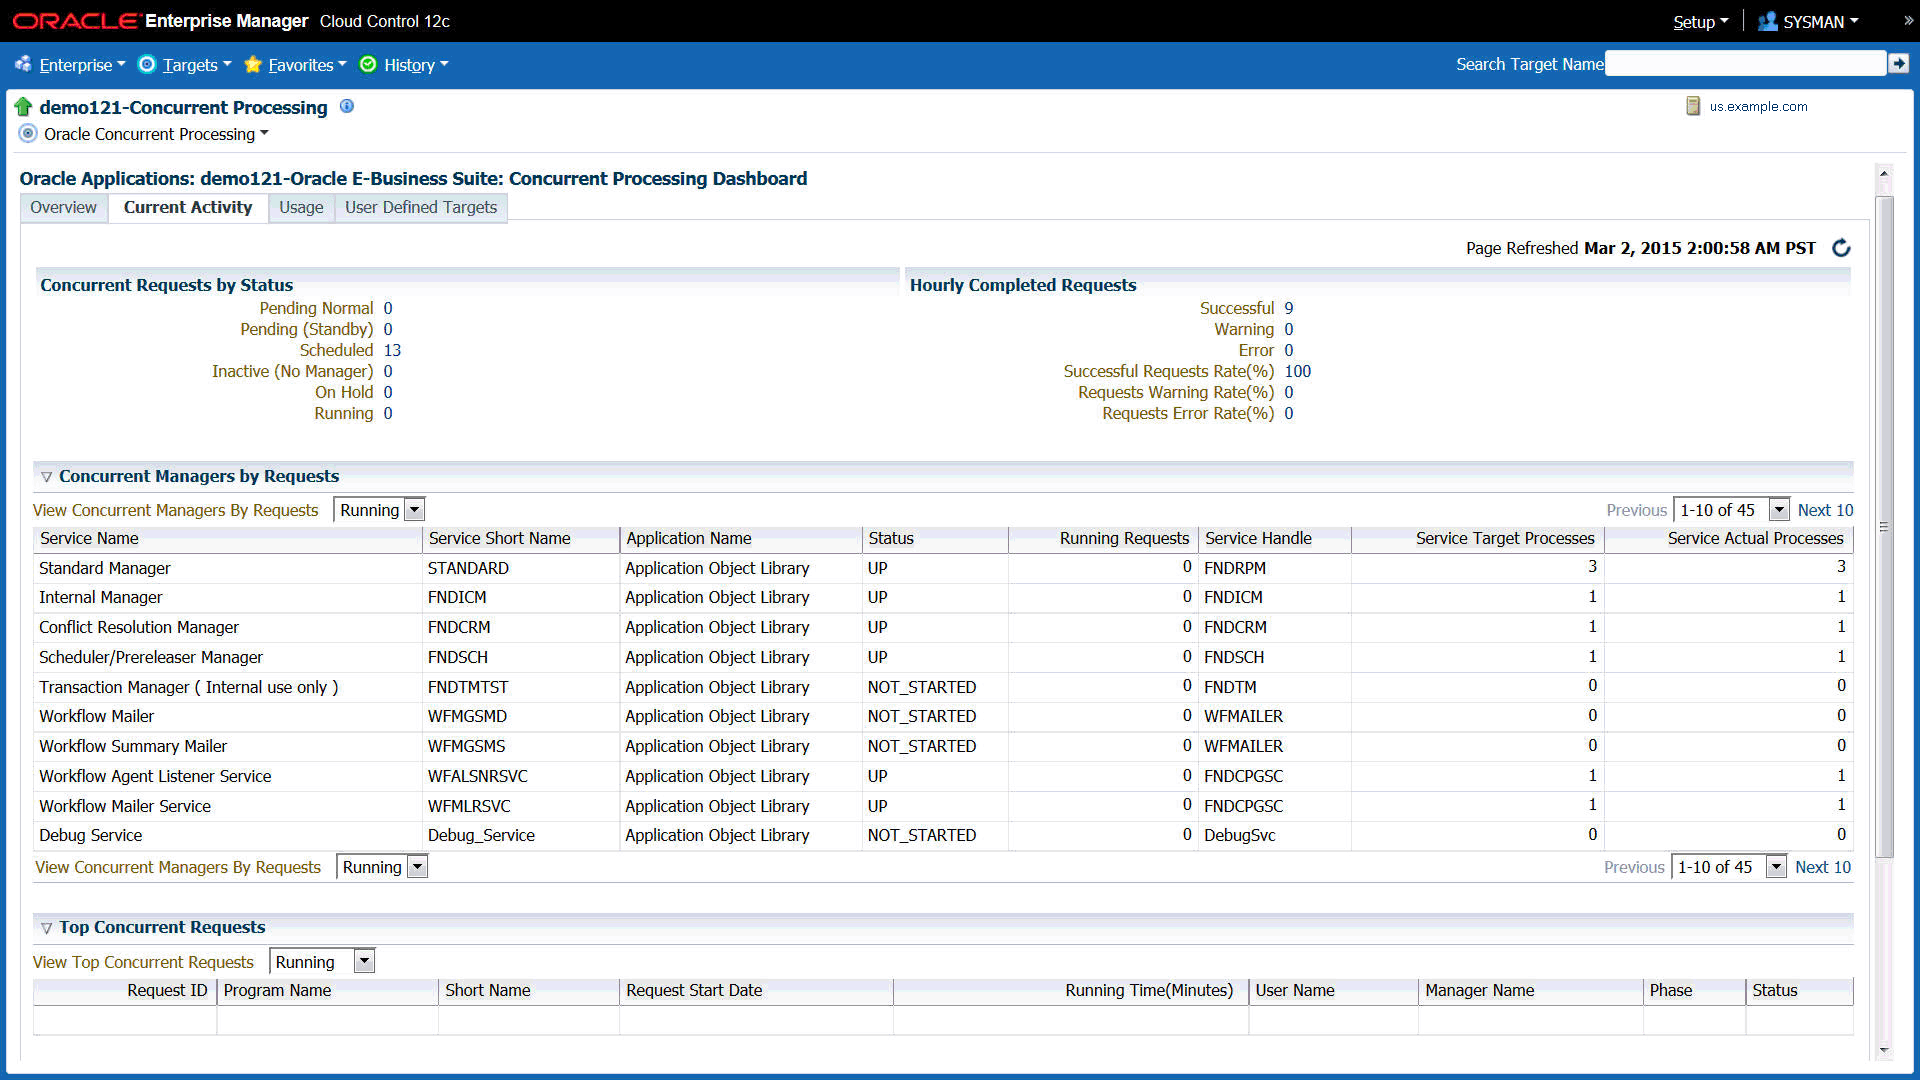
The Concurrent Requests by Status region lists the number of requests for each status:
-
Pending Normal
-
Pending (Standby)
-
Scheduled
-
Inactive (No Manager)
-
On Hold
-
Running
Click on the number for a status to find out more about the metric trend.
The Hourly Completed Requests region lists statistics for requests that have completed in the past hour, including:
-
Successful
-
Warning
-
Error
-
Successful Requests Rate (%)
-
Requests Warning Rate (%)
-
Requests Error Rate (%)
Click on the number for each statistic to find out more details.
The Concurrent Managers by Requests lists all concurrent managers, in order of the number of requests it has in the specified status, either Running or Pending.
With "Running" selected, the following is shown for each concurrent manager:
-
Service Name
-
Service Short Name
-
Application Name
-
Status
-
Running Requests
-
Service Handle
-
Service Target Processes
-
Service Actual Processes
With "Pending" selected, the following is shown for each concurrent manager:
-
Service Name
-
Service Short Name
-
Application Name
-
Status
-
Normal Pending Requests
-
Standby Pending Requests
-
Service Handle
-
Service Target Processes
-
Service Actual Processes
The Top Concurrent Requests region shows the top ten (10) requests for the specified status of Running, Pending, or Scheduled.
-
Running - These are sorted by running time in descending order.
-
Pending - These are sorted by running time in descending order.
-
Scheduled - These are sorted by their scheduled start time.
The Top Applications region lists the top ten (10) applications for running requests or pending requests, as specified.
The Top Users region lists the top ten (10) users by number of running or pending requests, as specified.
Usage Tab
The Usage tab provides a summary of how the concurrent programs and managers have been utilized over a period of time.
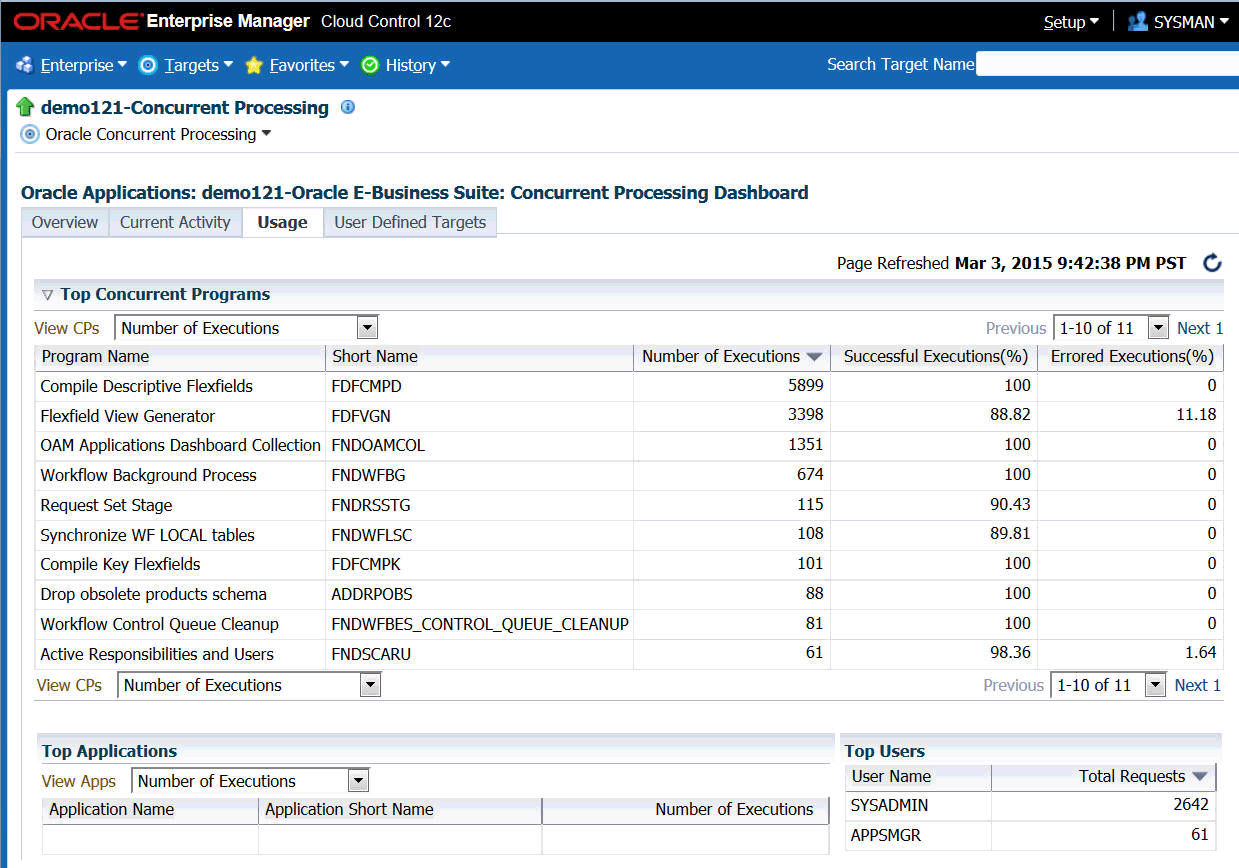
The top ten (10) concurrent requests for the following categories are listed:
-
Number of executions - For this category, the total number of executions, the percentage (%) of successful executions, and the percentage (%) of errored executions are shown.
-
Number of failed executions - The number of executions, percentage (%) of failed executions, and percentage (%) of errored executions are shown.
-
Average run time in minutes - The number of executions, average running time (minutes), and total running time (minutes) are shown.
-
Total run time in minutes - The top ten (10) programs with the highest maximum running time are shown. For each program listed, the number of executions, total running time (minutes) and percentage (%) of successful executions are shown.
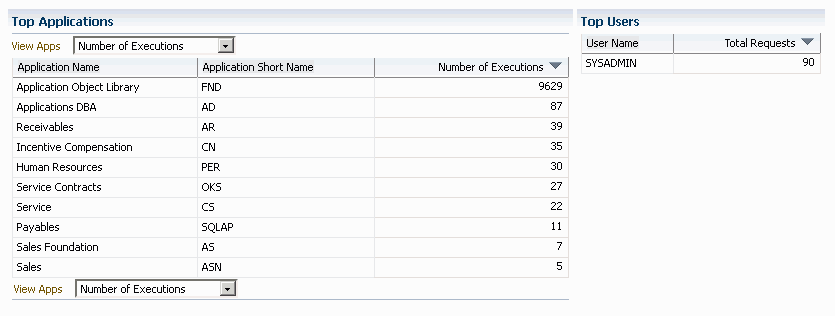
The top ten (10) applications for the following categories are listed:
-
Number of Executions
-
Number of Failed Executions
The top ten (10) users by total number of requests are also listed, in descending order of number of requests.
User Defined Targets Tab
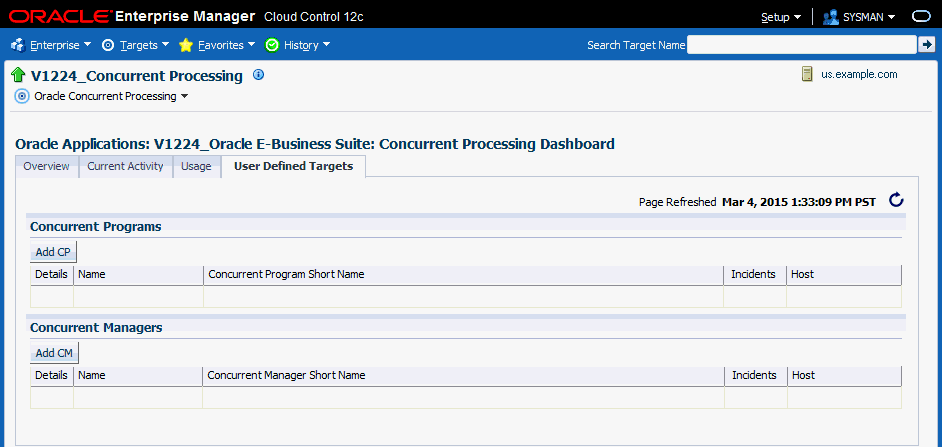
The User Defined Targets tab displays the details of the concurrent programs and managers being monitored. Use this tab to get information about the added concurrent programs and managers as well as to add more custom targets.
Adding a Concurrent Program Target
You can add a concurrent program custom target so that the system will collect metrics on activity and usage for the concurrent program.
-
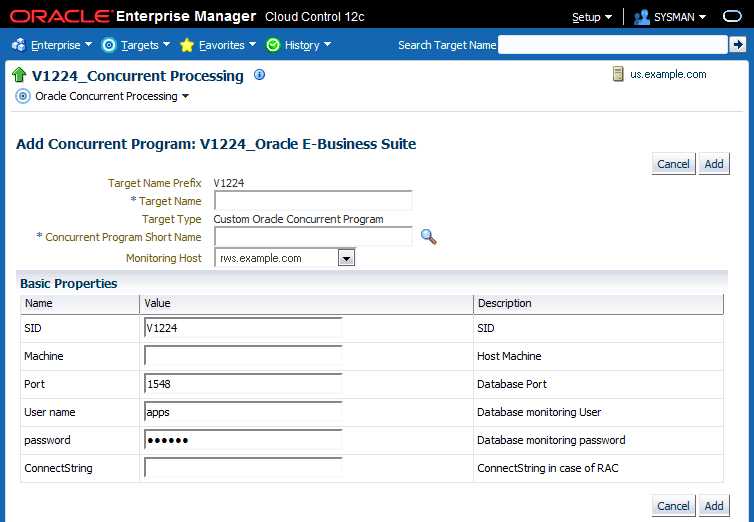
To add a concurrent program custom target, navigate to the Concurrent Processing Dashboard, select the User Defined Targets tab, and click Add CP under Concurrent Programs.
-
For your new target, define the following:
-
Target Name Prefix - This value is determined by the system based on the instance name and cannot be updated.
-
Target Name - Enter in a target name "suffix". The actual target name will be composed of the Target Name Prefix (above) and the value of this field.
-
Target Type - The system automatically provides the value "Custom Oracle Concurrent Program".
-
Concurrent Program Short Name - Use the LOV icon to search for and select the program short name. In searching for the program name you can search by concurrent program short name, concurrent program name, or application.
-
Monitoring Host
For the Basic Properties region, values for the following should default in. These values are used as credentials by the target for metrics collection:
-
SID
-
Machine
-
Port
-
(Database) User name
-
(Database) Password
-
ConnectString
-
-
When you are done, click Add to add the target.
Adding a Concurrent Manager Target
If you have decided not to discover all concurrent managers during discovery, you can add an individual concurrent manager custom target so that the system will collect metrics on activity and usage for requests run by the concurrent manager.
-
To add a concurrent manager custom target, navigate from the Concurrent Processing Dashboard to the User Defined Targets tab and click Add CM under Concurrent Manager.
-
For your new target, define the following:
-
Target Name Prefix - This value is determined by the system based on the instance name and cannot be updated.
-
Target Name - Enter in a target name "suffix". The actual target name will be composed of the Target Name Prefix (above) and the value of this field.
-
Target Type - The system automatically provides the value "Custom Oracle Concurrent Manager".
-
Concurrent Manager Short Name - Use the LOV icon to search for and select the concurrent manager short name. In searching for the manager name you can search by concurrent manager short name, concurrent manager name, or application.
-
Monitoring Host
For the Basic Properties region, values for the following should default in. These values are used as credentials by the target for metrics collection:
-
SID
-
Machine
-
Port
-
(Database) User name
-
(Database) Password
-
ConnectString

-
-
When you are done, click Add to add the target.
Configuration of Concurrent Processing
To view the concurrent processing configuration, go to the Concurrent Processing Dashboard. From the "Oracle Concurrent Processing" target menu, select Configuration > Last Collected.
Configuration data collected includes:
-
General settings
-
Specialization rules for concurrent managers
-
Work shift for concurrent managers
-
Profile options
Monitoring Concurrent Processing
Metrics are collected to monitor the concurrent processing. These metrics are collected at three levels:
-
The first level is on all concurrent processing in the instance, which covers all concurrent managers and programs.
-
The second level is at the individual concurrent manager level.
-
The third level is at the individual program level.
To see metrics for all concurrent processing in your instance, choose Monitoring > All Metrics from the instance target menu in the Concurrent Processing Dashboard.
To see metrics for a concurrent manager or concurrent program, go the User Defined tab and click on the name of the target to go to its home page. From the target menu on the home page, choose Monitoring > All Metrics.
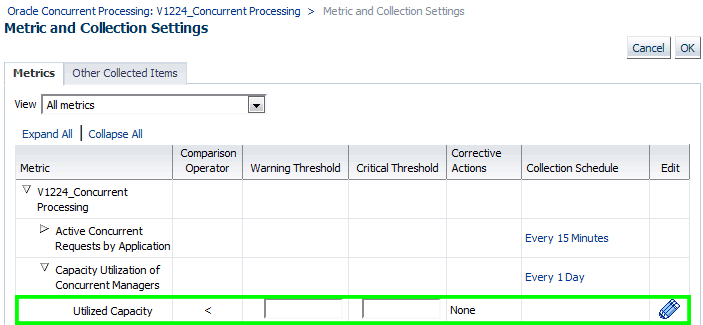
Monitoring Capacity Utilization of Concurrent Managers
Every concurrent manager has a maximum number of processes that can be active at a given point of time. The metric Capacity Utilization of Concurrent Managers tracks this. It collects the utilized capacity as a percentage of maximum allowed. You can set an alert if the usage falls below a certain percentage. The metric is available for all concurrent processing in your instance and for individual managers.
Monitoring Running Requests Based on Time
The Running Requests metric, known as Long Running Requests in previous releases, is available for all concurrent processing, an individual concurrent manager and individual concurrent program and allows you to monitor requests that are running at a given time. You can set a threshold to receive alerts if the running time exceeds a predefined value.

Monitoring Long Running Requests as a Percentage of Average Runtime
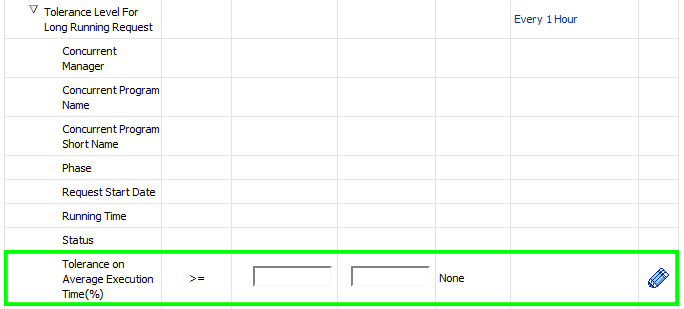
You can raise an alert if the running time exceeds a certain percentage of the average running time of previous requests. The metric Tolerance Level For Long Running Request can be used to set this alert. The metric is available for all concurrent processing, the individual concurrent manager, and individual concurrent program.
Monitoring Pending Requests Based on Time
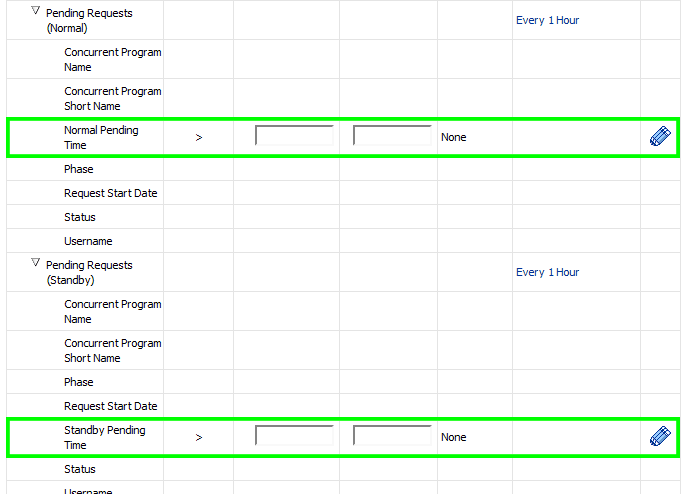
Requests that are pending can be monitored based on time. In former releases of the management pack, these metrics were referred to as Long Pending Requests. In 12.1.0.4.0, these metrics are called Pending Requests, categorized as either Normal or Standby. You can set alerts if the pending time exceeds a predefined threshold. The metric is available for all concurrent processing, the individual concurrent manager, and individual concurrent program.
Monitoring the Number of In-Progress Requests by Status
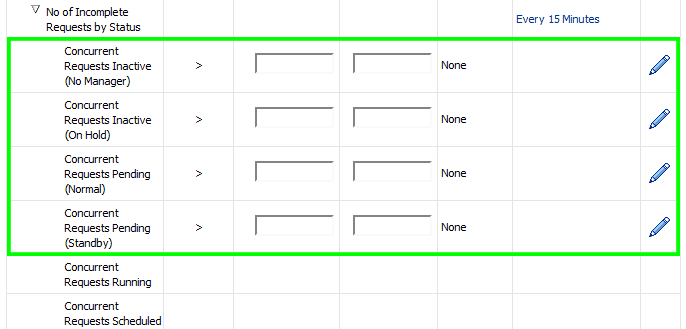
The metric No. of Incomplete Requests by Status, formerly Concurrent Requests by Status in previous releases, can be used to set an alert if the number of inactive or pending requests exceeds a predefined limit. The metric is available for all concurrent processing and the individual concurrent program.
Monitoring the Number of Completed Requests by Status
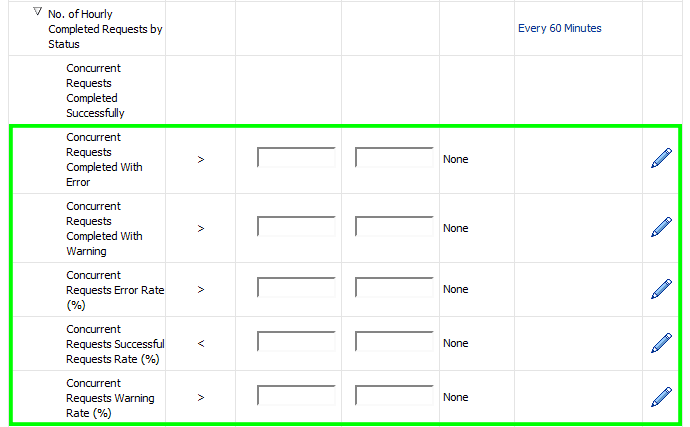
Formerly known as Hourly Completed Requests in previous releases, the metric No. of Hourly Completed Requests by Status can be used to monitor and raise an alert if the number of requests completed (absolute and percentage) with warning or error exceeds a predefined limit. You can also raise an alert if the success rate falls below a predefined percentage. The metric is available for all concurrent processing and the individual concurrent program.
Monitoring Blocked Concurrent Requests by Time
You can raise an alert if a concurrent request is in blocked state due to a database lock. The metric Concurrent Requests in Blocked State can be used to set up this alert. The metric is available for all concurrent processing, the individual concurrent manager, and individual concurrent program.

Monitoring the Number of Blocked Requests
You can raise an alert if the number of requests in blocked state due to database locks exceeds a predefined number. The metric No. of Concurrent Requests in Blocked State can be used to set this alert. The metric is available for all concurrent processing, the individual concurrent manager, and individual concurrent program.

Monitoring Specialization Rules
Specialization Rules can be defined for concurrent managers to define what kind of requests a manager can process. Both inclusion and exclusion rules can be defined. There have been cases where the number of such rules defined were large and caused performance issues. The metric No. of Include and Exclude Specialization Rules allows you to raise alerts if the number of such rules exceeds a predefined limit. This metric is available only for the concurrent manager target.

Monitoring Schedule of Requests
If a concurrent program is not scheduled as a best practice recommendation, you can raise an alert. The metric Monitor Schedule for Requests can be used to raise this alert. You can specify the expected interval in days, months, hours or minutes. When specifying the interval, only one unit of measurement can be used at a time (for example, you cannot specify a combination of hours and minutes). This metric is available only for the concurrent program target.

Monitoring Unscheduled Requests
If it is mandatory for a concurrent program to be scheduled periodically and if it is not scheduled, you can raise an alert. The metric Unscheduled Requests can be used to raise this alert. This metric is available only for the concurrent program target. You must enter the value as 0 for the alert to be raised.

Monitoring Request Sets
The option to monitor requests set metrics is available only for concurrent processing in your instance.
Monitoring Running Request Sets
You can raise an alert if a request set is running for more than a predefined time. The metric Running Request Sets can be used to set this alert.

Monitoring a Request Set for Failure
You can raise an alert if a specific request set fails. The metric Failed Request Sets can be used to raise this alert.

Monitoring Request Sets That Have Not Started
You can raise an alert if a request set does not start as expected. The metric Not Started Request Sets can be used to set this alert.

Monitoring Request Sets That Are Not Scheduled
You can raise an alert if a request set is not scheduled. The metric Unscheduled Request Sets can be used to raise this alert.

Monitoring Conflict Resolution Manager
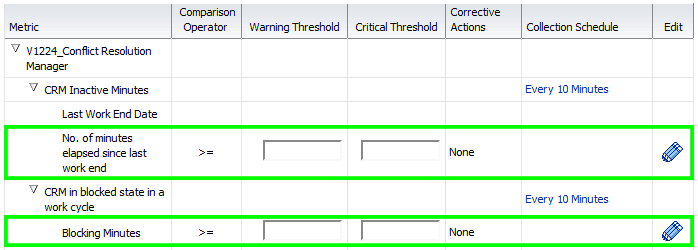
Metrics are collected to check the health of the Conflict Resolution Manager (CRM). You can raise an alert if:
-
CRM is in an inactive state for a certain period of time
-
CRM is in a blocked stated for a certain period of time
You can go to the home page of the Conflict Resolution Manager target by clicking on its name from the Components region in the Overview tab of the Concurrent Processing Dashboard.
Monitoring Output Post Processor
Metrics are collected to check the health of the output post processor. Alerts will be raised if:
-
Output post processor hangs
-
If any request gets no response error
-
If any request times out
You can go to the home page of the Output Post Processor target by clicking on its name from the Components region in the Overview tab of the Concurrent Processing Dashboard.

Oracle E-Business Suite Summary on the Exalogic Dashboard
You can add an Oracle E-Business Suite Summary region for instances running on Exalogic machines to enable monitoring for these instances.
This region contains:
-
A pie graph for consolidated status of Oracle E-Business Suite targets.
-
A summary table that shows name of the Oracle E-Business Suite instance, status, incidents, configured components, service, compliance violations.
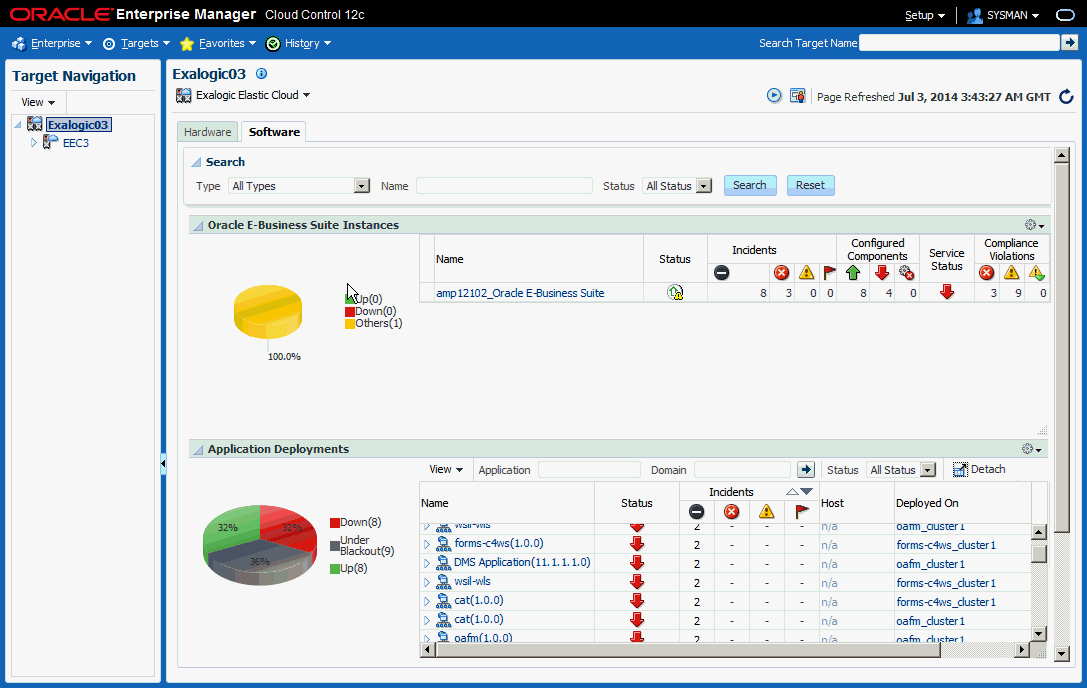
To add an Oracle E-Business Suite summary region on the Exalogic dashboard, perform the following steps:
-
Click on the global menu Targets > Exalogic. The landing page with all the discovered Exalogic instances should be displayed.
-
Click on any instance. The Exalogic dashboard should be displayed.
-
Click on the personalization page icon. The page should become editable.
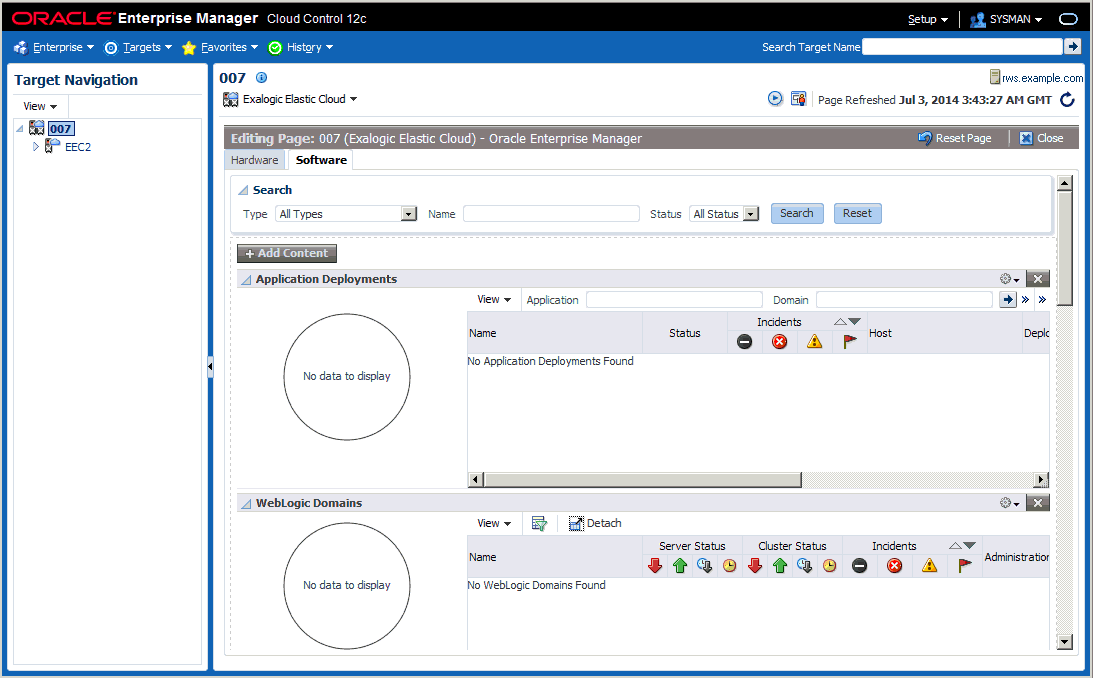
-
Click on the Add Content button for a list of available regions. Click the Add icon for Oracle E-Business Suite Instances to add the region.
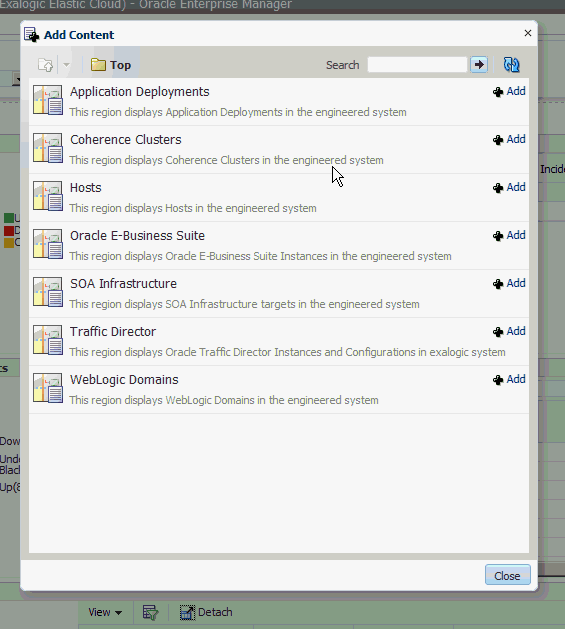
-
Click Close to exit the editable page.
To remove the Oracle E-Business Suite summary region from the Exalogic dashboard, click on the personalization page icon and the page should become editable. Click on the cross icon (X) on the top right side of the region to remove the Oracle E-Business Suite summary region.
To change the location of the Oracle E-Business Suite summary region, click on the View Action Menu icon on the top right side of the region and click Move Up/Move Down to rearrange the region on the Exalogic dashboard.
End-To-End Performance Monitoring with RUEI and JVMD
The management pack now integrates seamlessly with Real User Experience Insight (RUEI) and Java Virtual Machine Diagnostics (JVMD) for monitoring performance of transactions. RUEI understands how users are interacting with your product. Using the measurements that RUEI collects, you can assess the effectiveness of user interface design, the responsiveness of web servers and the internet, and the success of user operations. JVMD looks at the finest details of code execution and to identify problems like race conditions, blocked threads, and memory leaks. To learn more about RUEI and JVMD, see Part VI - Monitoring Application Performance of Oracle Enterprise Manager Cloud Control Getting Started with Oracle Fusion Middleware Management Plug-in.
Supported Oracle E-Business Suite Versions
This feature works only for Oracle E-Business Suite Release 12.2 and above, where the middle tier is deployed on the WebLogic Server.
Prerequisites
-
Discover the Oracle E-Business Suite instance - To perform end-to-end monitoring first discover the Oracle E-Business Suite instance in the management pack
-
Install Java Virtual Machine Diagnostics - Deploy the JVMD Manager (JVM Diagnostics Engine) in Enterprise Manager. For information, see "Installing JVM Diagnostics" in Oracle Enterprise Manager Cloud Control Basic Installation Guide
-
Deploy JVMD Agent on the WLS server of the Oracle E-Business Suite instance - For information, see "Installing JVM Diagnostics" in Oracle Enterprise Manager Cloud Control Basic Installation Guide.
-
Register the Oracle E-Business Suite Database with JVMD - After the JVMD agent is deployed on the respective Oracle E-Business Suite application server, and once it is ready to diagnose JVM issues, then you need to register the database of the relevant Oracle E-Business Suite with the JVMD engine. This step is required in order to navigate to the database diagnostics page from JVMD pages.
-
Navigate to Setup > Middleware Management > Application Performance Management.
-
Select the row JVM Diagnostics Engines and click on Configure.
-
Click on the Register Databases tab.
-
Click on Add Database Instance, and select the respective Oracle E-Business Suite database instance and click on Select.
-
-
Install Real User Experience Insight - For information, see the Oracle Real User Experience Insight Installation Guide.
Setting up End-to-End Monitoring
Configure Oracle E-Business Suite in RUEI
Real User Experience Insight can be configured to support drilling down to JVM Diagnostics. For example, if a page is taking too much time to load, RUEI will detect it. You can then drill down from RUEI to JVMD and find out the root cause of why the page is hanging.
-
Log in to RUEI.
-
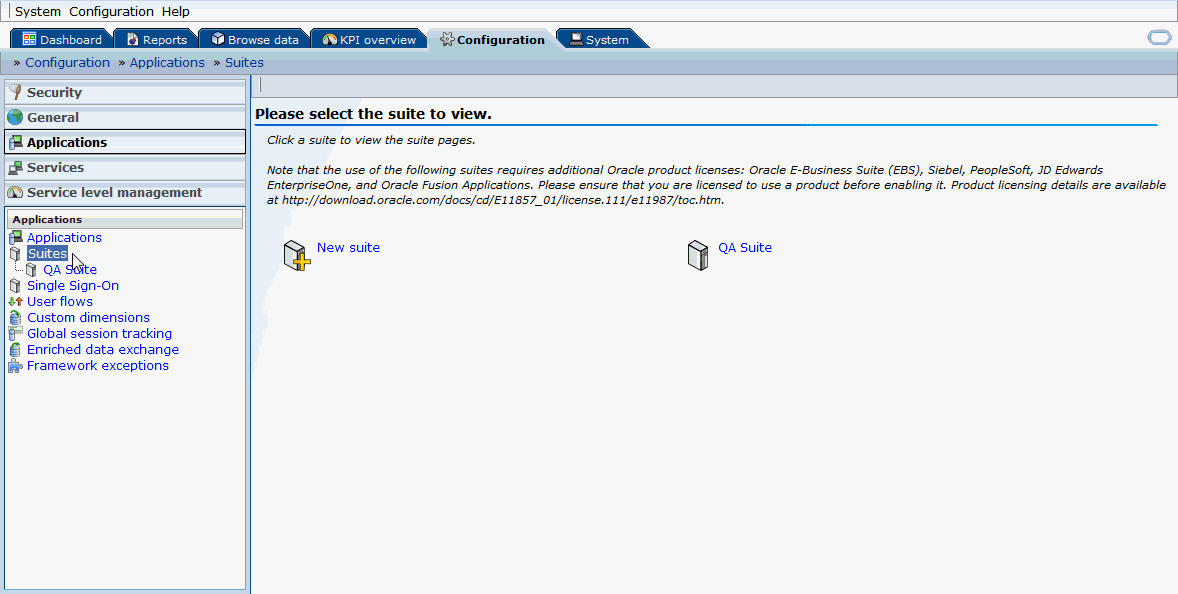
Navigate to Configuration > Applications > Suites.
-
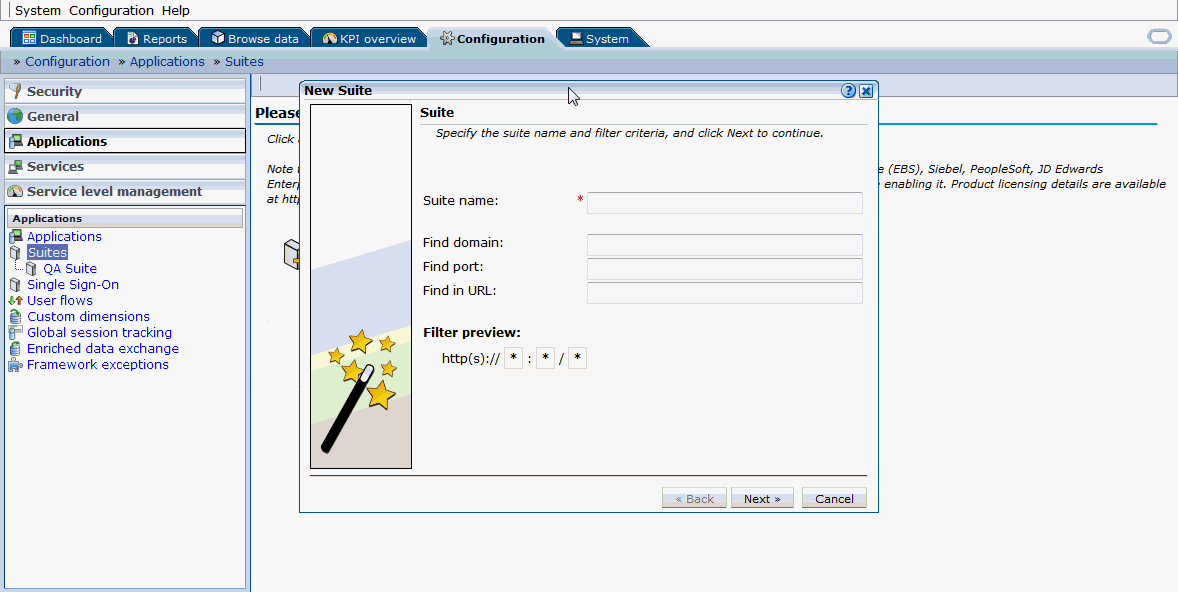
Click on New Suite. A "New Suite" window opens.
-
Enter a suite name. This is the name that can be used to uniquely identify an Oracle E-Business Suite in RUEI. Provide any name that uniquely defines the Oracle E-Business Suite instance being configured.
-
Provide the domain name and port of the Oracle E-Business Suite applications URL in the Find Domain and Find Port fields. For instance, if http://domain.abc.com:8080/AppsLogin is your Oracle E-Business Suite applications URL, "domain.abc.com" will be the domain field value and 8080 will be the port field value.
-
Enter '*' in the Find in URL field. This entry means that any request to the Oracle E-Business Suite applications URL will be monitored. Alternatively, you can provide some patterns so that only those URLs that match the given pattern will be monitored. Click Next.
-
Enter "E-Business Suite" as the Suite Type and click Finish. The newly-created suite appears on the page.
-
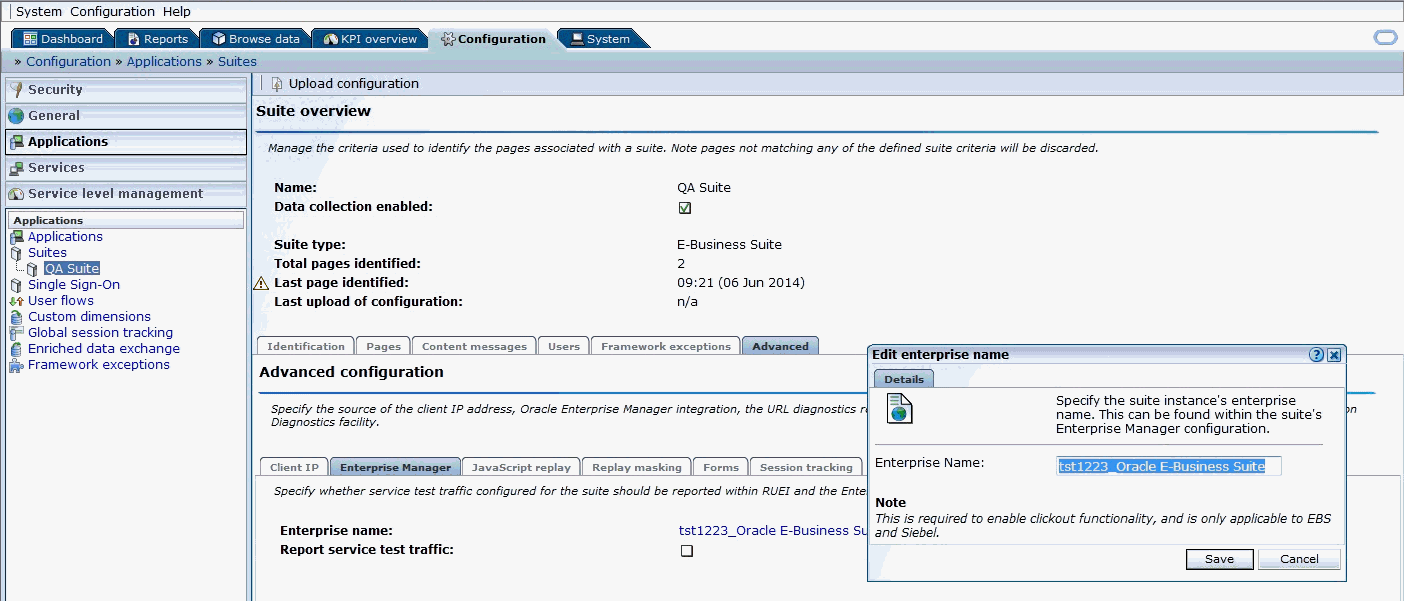
Click on the created suite name.
-
Click on the Advanced tab.
-
Click on the Enterprise Manager subtab.
-
Click on 'n/a' for Enterprise name. In the name field, provide the name of the Oracle E-Business Suite instance that is discovered in Enterprise Manager where you want to drill down to JVMD or the Oracle E-Business Suite search user sessions pages. For example, "tst1223_Oracle E-Business Suite".
Configure Protocols
-
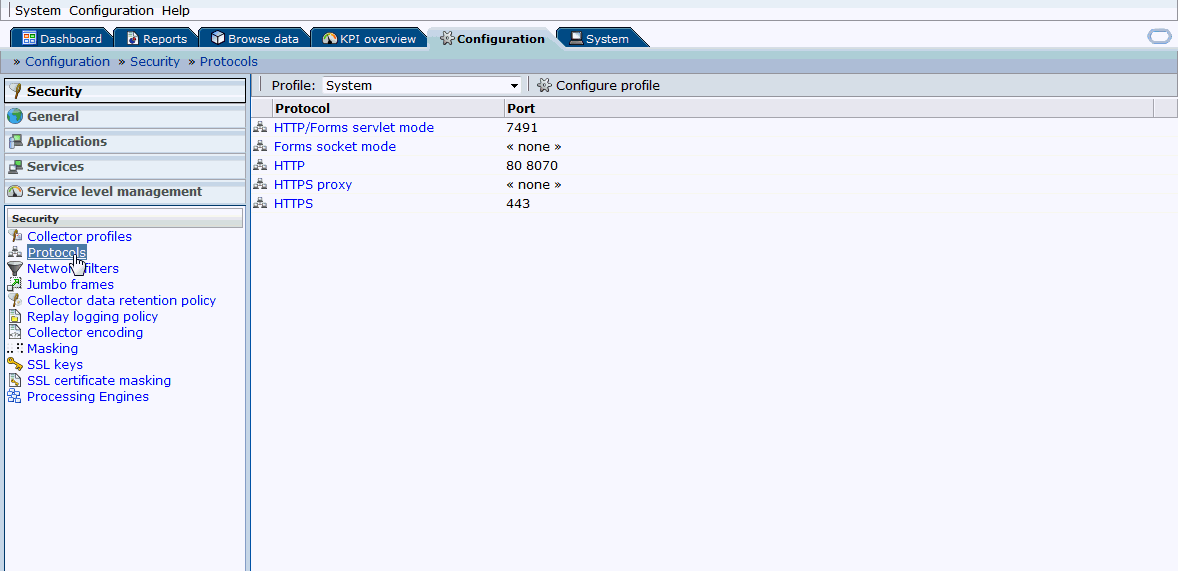
Navigate to Configuration > Security > Protocols.
-
Based on the Oracle E-Business Suite instance protocol (http/https), click on the respective protocol and provide/add the respective port on which Oracle E-Business Suite is up and running. You can also provide the port on which forms are running in the respective protocols.
Configure Link for RUEI to EM
In diagnosing an issue in RUEI, it is possible to drill down to JVM Diagnostics in Enterprise Manager, if the EM instance is linked to RUEI. Use these steps to link RUEI to EM:
-
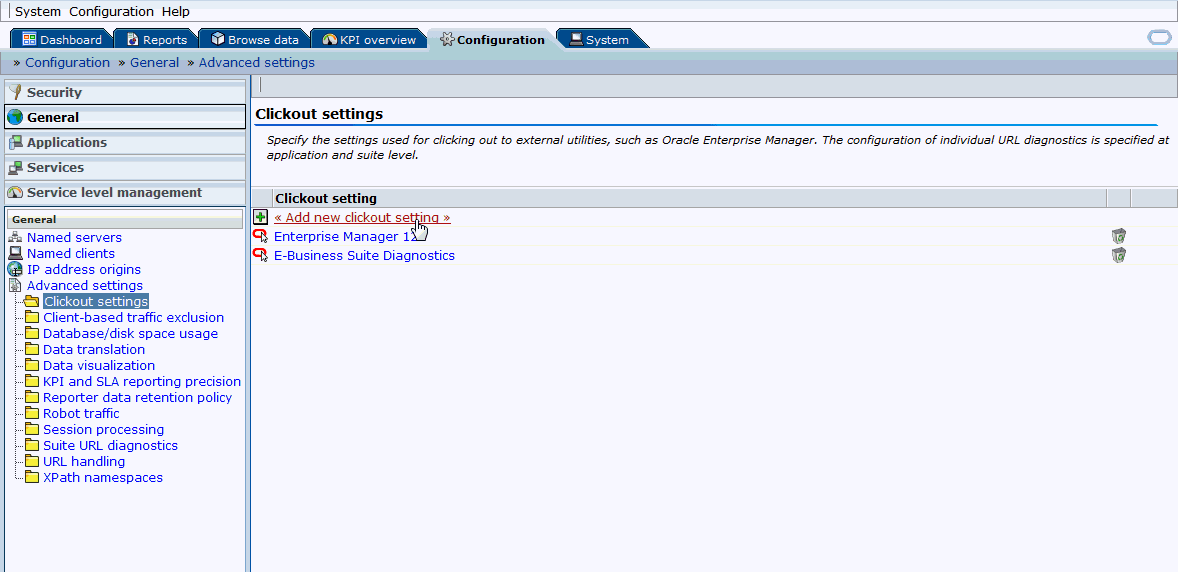
Click on Configuration > General > Advanced Settings > Clickout Settings. Click on Add new clickout setting.
-
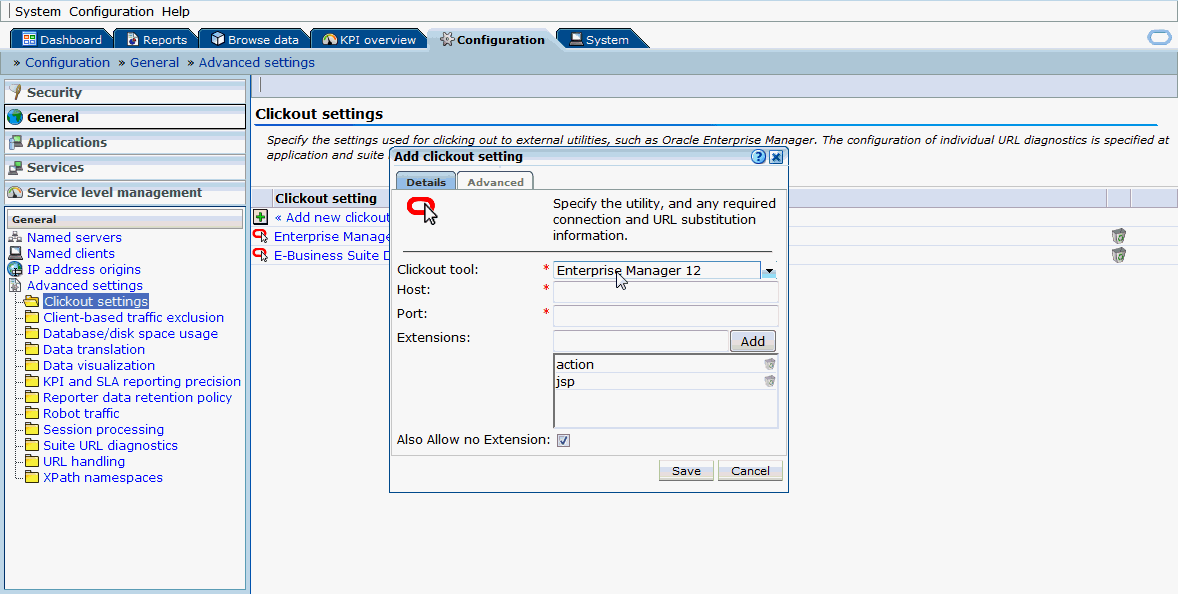
Select the version of Enterprise Manager in the clickout tool list.
-
Provide host and port values of the Enterprise Manager instance.
-
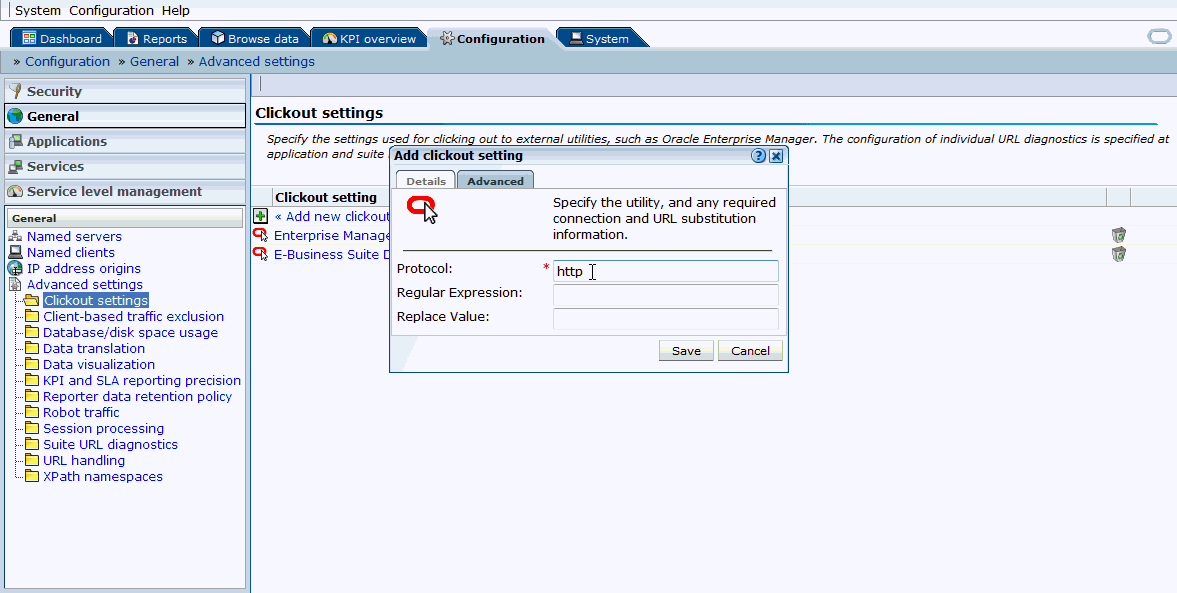
Click on Advanced. Provide the protocol (http/https).
-
Click on Save.
-
After linking, you should be able to see the link "Inspect in Enterprise Manager" when right-mouse-clicking on any session activity in the Browse data tab.
Analyzing a Performance Issue
-
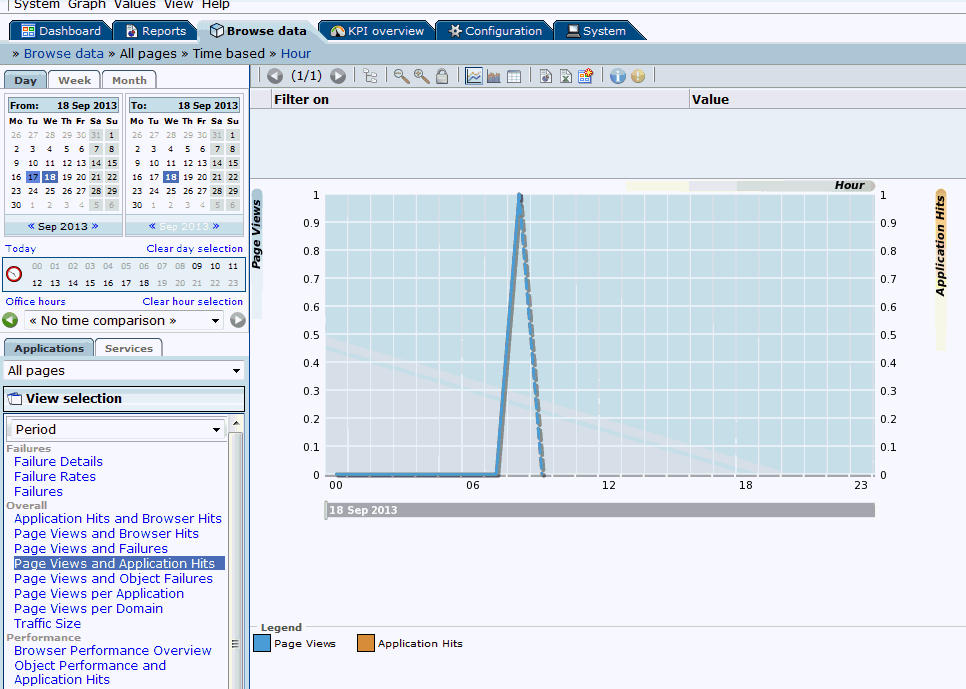
Log in to RUEI screen and click on Browse data tab.
-
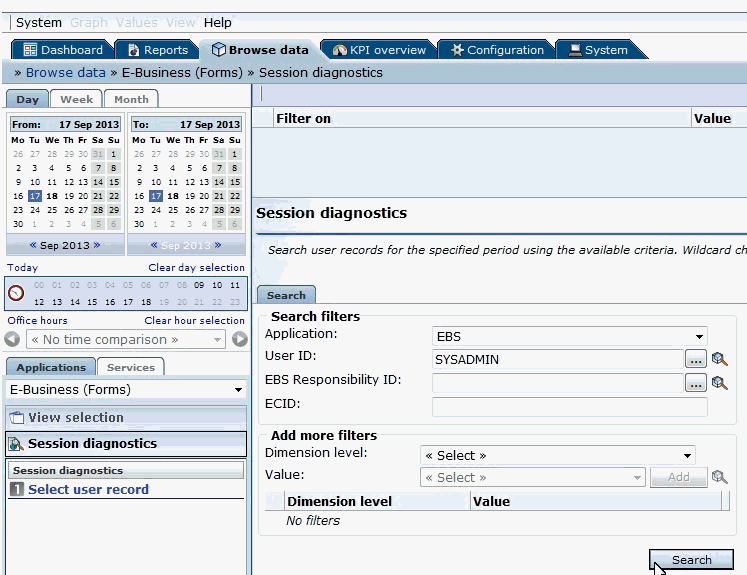
Select the date on the left hand side to filter the data accordingly. Select E-Business (Forms) from the drop-down list below Applications tab.
-
Click on the Session Diagnostics tab below the list mentioned in the above step.
-
Select the EBS suite name configured in section "Configure Oracle E-Business Suite in RUEI" from the Application drop down. If you are trying to search for sessions of a specific user ID, EBS responsibility ID, or ECID, select the values accordingly from the respective drop down fields. Not all values need to be selected for each drop-down list to perform the search.
-
Click on Search.
-
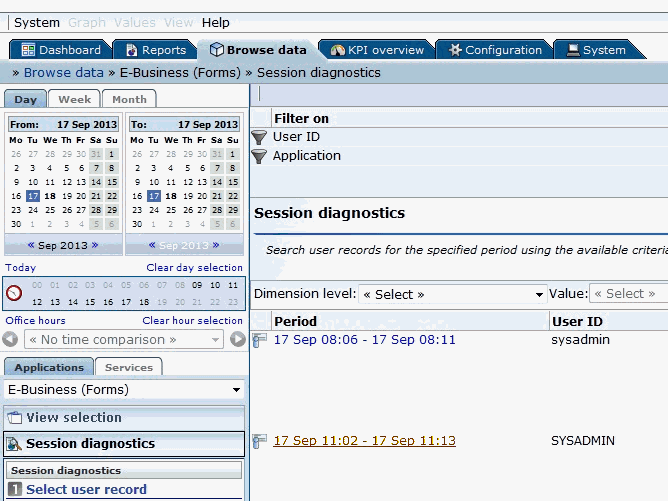
Click on a session link.
-
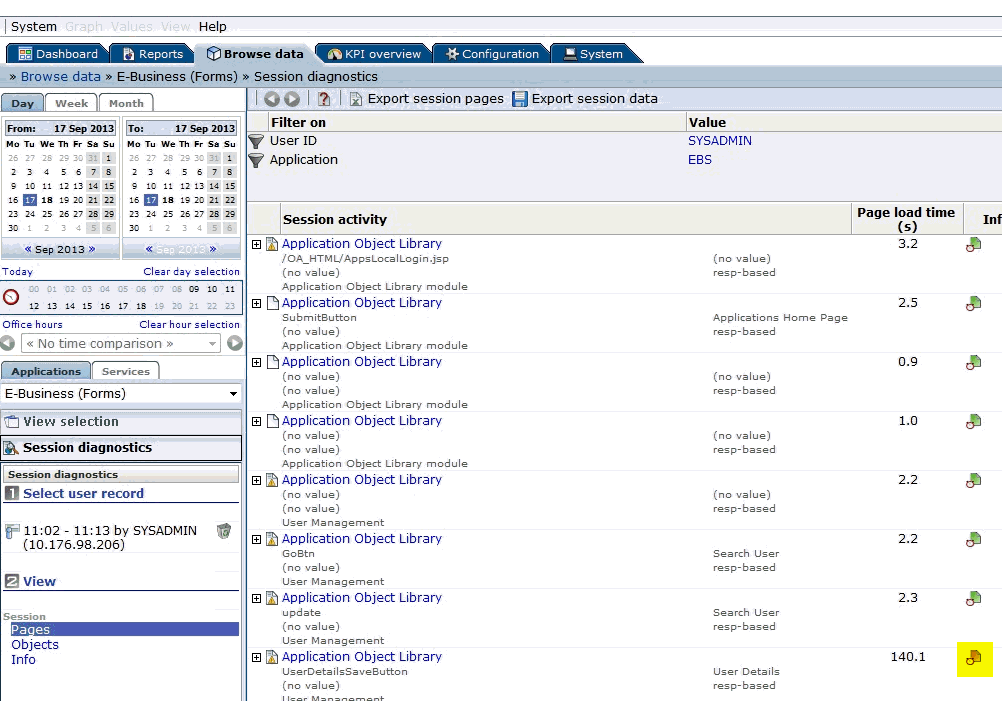
Multiple session activities are displayed. Check the Info column. A red-colored icon identifies that the session activity ended with some error or is hanging.
-
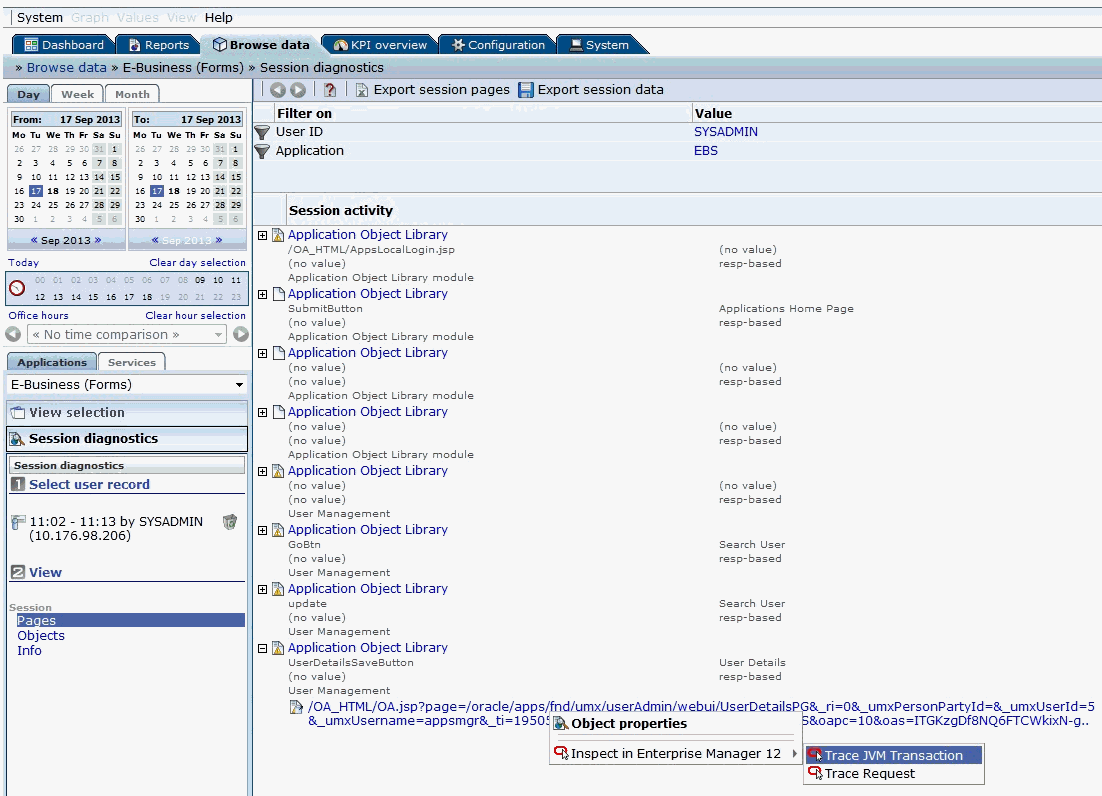
Right click on that session activity, click on Inspect in EM 12C > Trace JVM request.
-
This will take you to the EM screen where after logging in, you will be taken to JVMD screen directly based on the failed session activity's ECID.
Drilling Down from RUEI to the Plug-in
You can drill down to the Oracle E-Business Suite Plug-in from RUEI to monitor user sessions.
Configure link for RUEI to drill down to the plug-in
-
Navigate to Configuration > General > Advanced Settings > Clickout Settings.
Click on Add New Clickout Setting.
-
Select E-Business Suite Diagnostics in the click out tool list.
-
Provide host and port values of the Enterprise Manager instance.
-
Click on Advanced and provide the protocol (http/https).
-
Click on Save.
-
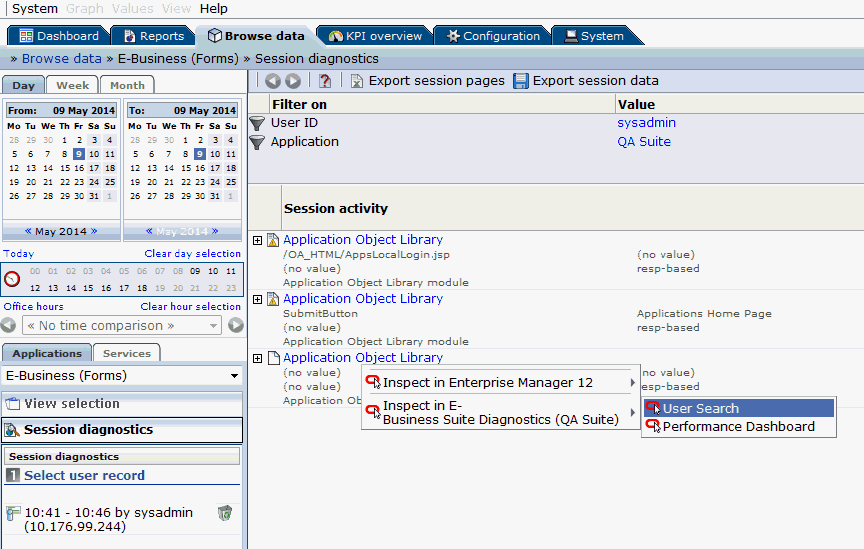
After creating this link, you should be able to see the link "Inspect in EBS Diagnostics" when you right-click any session activity in the Browse data tab.
Monitoring User Sessions by drilling down from RUEI
Once the "Inspect in EBS Diagnostics" link is available, select the child menu User Search to drill down to the management pack. You will see the active sessions of the Oracle E-Business Suite user like Concurrent Processing (CP), Forms, and Oracle Application Framework (OAF) sessions. You can drill down to each session to get the details.
Custom Metrics
You can create custom metrics in case it is not covered by the metrics shipped out of the box.
-
Navigate to Enterprise > Monitoring > Metric Extensions.
-
Click Create > Metric Extension.
-
Select Applicable to as Oracle E-Business Suite.
-
Select Adapter as SQL.
-
Define the query. Define columns in next step.
-
Add any target and test. Query will hit this EBS target.
-
Submit.
-
Select the metric you created, Actions > Save As Deployable Draft.
-
Select the metric you created, Actions > Publish Metric Extension.
-
Select the metric you created, Actions > Deploy to Targets.
-
Select any target and deploy.
For more details, see "Using Metric Extensions" in Oracle Enterprise Manager Cloud Control Administrator's Guide.
Custom Compliance Rules
Follow these steps to create custom compliance rules.
-
Navigate to Enterprise > Compliance > Library.
-
Create > Repository Rule.
-
In Applicable to, select Oracle E-Business Suite.
-
Define Query, violation condition and other details.
-
Make sure that query has target_guid as the first column.
-
Click Test and Submit.
-
Now you can map this rule to a custom standard and then the custom standard to a custom framework.
Please note that System defined compliance objects are non-editable. You cannot map any compliance object to any System defined compliance object. However, you can use Create Like to create a copy of a System defined object and then edit that.
-
You can always edit a custom compliance object and map rule to standard, standard to framework.
For more details, see "Managing Compliance" in Oracle Enterprise Manager Lifecycle Management Administrator's Guide.