6 Siebel Performance Diagnostics
This chapter provides procedures for the following topics:
Features of Siebel Diagnostics
Siebel Performance Diagnostics provide the following features:
-
Server Performance Analysis — Enables you to diagnose and identify Siebel Server performance issues, one server at a time, by providing access to response time, CPU usage, and memory data for selected server components. You can create and generate reports for analysis.
-
User Performance Analysis — Enables you to diagnose and identify user session performance issues for requests that a specific user initiates.
You can create and generate reports for server and user performance for analysis.
Types of Diagnostic Reports
You can create a Server Performance report or User Performance report to analyze the performance of the server and components, and of individual users.
A Server Performance report enables you to analyze the performance of one or all Siebel components of a server, and provides information of requests in terms of response time, CPU time, and memory consumption for each request. A User Performance report enables you to analyze the performance for sessions of a specific user, provides details on the response time, and permits drill-downs into individual user requests.
A scenario for each report is provided below, which helps you understand when you want to create and analyze reports.
Server Performance Report Scenario
Consider a situation where the general performance of the entire application is slow. To remedy this, the administrator must first enable SARM for all the components running on a given server. Next, the administrator logs in to Enterprise Manager and uses the Diagnostics Reports page to analyze the collected SARM data on this server and/or components to identify the performance bottleneck.
User Performance Report Scenario
Consider a situation where users report performance issues with their application sessions. To remedy this situation, the administrator must first enable SARM for the component. Next, the administrator logs in to Enterprise Manager and uses the Diagnostics Reports page to analyze the collected SARM data for a particular user to identify the performance bottleneck.
Prerequisites for Diagnostic Reports
To monitor Siebel performance, you need to manually enable Siebel Application Response Measurement (SARM). For information on enabling SARM manually, refer to the prerequisites section in Chapter 2.
You then have to configure the SARM logging parameters and enable SARM for individual Siebel components from the Diagnostic Configuration page in Enterprise Manager. Refer to Table 6-1 for descriptions of the parameters for SARM configuration and diagnostic report generation.
Note:
Ensure that the preferred credentials for the host target, and the Server Manager credentials for all the Siebel Servers that are a part of the Enterprise are set.To set the preferred host credentials, follow these steps:
-
From the Setup menu, select Security, then select Preferred Credentials.
-
On the Preferred Credentials page, select Host for Target Type, then click Manage Preferred Credentials.
-
On the Host Preferred Credentials page, in the Default Preferred Credentials section, select the credential set from the table, then click Set. Select the required named credential, or create a new named credential. Click Save.
To set the Server Manager credentials, follow these steps:
-
From the Setup menu, select Security, then select Preferred Credentials.
-
On the Preferred Credentials page, select Siebel Server for Target Type, then click Manage Preferred Credentials.
-
On the Siebel Server Preferred Credentials page, in the Default Preferred Credentials section, select the credential set from the table, then click Set. Select the required named credential, or create a new named credential. Click Save.
| Parameter | Description |
|---|---|
|
Logging Level |
Displays the level of logging information required for SARM configuration. The values are: 1 — Select this level for general performance monitoring. At this level, SARM collects information such as process and component boundaries, third-party software calls, database measurements, workflow execution, and script performance. 2 — Select this level for problem diagnostics. This level captures the information at level 1 as well as detailed information such as steps of workflow execution, construction of large objects, reading of large files, and crossing significant architectural areas. |
|
logdir |
When creating the Siebel Diagnostics Performance Report in Enterprise Manager, the *.sarm files are located in the logdir location. If the Siebel logdir parameter is null, the log location defaults to: <SIEBEL_ROOT>/siebsrvr/log If this is not the valid location, and for example, the following location is desired ... <SIEBEL_ROOT>/siebsrvr/enterprises/<enterprise_name>/<siebel_server_name>/log ... either define the logdir parameter at the Siebel side or update the Monitoring Configuration at the Siebel Server Home Page > Related Links - Monitoring Configuration filesystem:logdir parameter. |
|
File Max Number |
Indicates the maximum number of SARM files maintained for each Siebel component. When all files are full (that is, all files reach the size specified as File Size), the file that was created first is removed and is replaced by a new file. The range must be between 1 and 256. The default value is 4. |
|
Buffer Size (KB) |
Indicates the memory available to cache SARM data by the Siebel processes (that is, the internal buffer to be used by the SARM logger). The default buffer size is 5,000,000 bytes. Note: Increasing the buffer size increases memory consumption, but may decrease I/O activity, as buffer flushes are minimized. |
|
File Size (KB) |
Indicates the maximum size of an individual SARM file. Upon reaching the specified file size, SARM creates a new file and starts storing data in the new file. The default size is 15,000,000 bytes (15 MB), and there is no upper limit to the file size. |
|
Interval (min) |
Specifies the maximum amount of time, in minutes, between writing the SARM buffer to the disk. For environments with minimal activity, this parameter determines the frequency to write files to the disk. The value should be between 1 and 30 (minutes). The default value is 3. |
Note:
The configuration of the SARM parameters depends on the diagnostic requirements. The more disk space made available for SARM logging (determined by File Max Count and File Size), the further back in time you can generate data for your reports.After setting the SARM parameters, you can enable the diagnostic configuration for Siebel components by selecting the Enable SARM option in the Enable/Disable section of the Diagnostic Configuration page.
Creating Diagnostic Reports
Diagnostic reports help you analyze how user requests have been processed, and also analyze how servers have performed requests. You can create Server Performance and User Performance reports.A Server Performance report enables you to analyze the performance of a server and provides information of requests in terms of response time and CPU usage time for each request. While creating such a report, you can select the Siebel Server for which you want the performance report.A User Performance report enables you to analyze the performance of a user and provides details on the response time for various requests by the user.To create a User Performance report or Server Performance Report:
-
From the Targets menu, select Siebel.
-
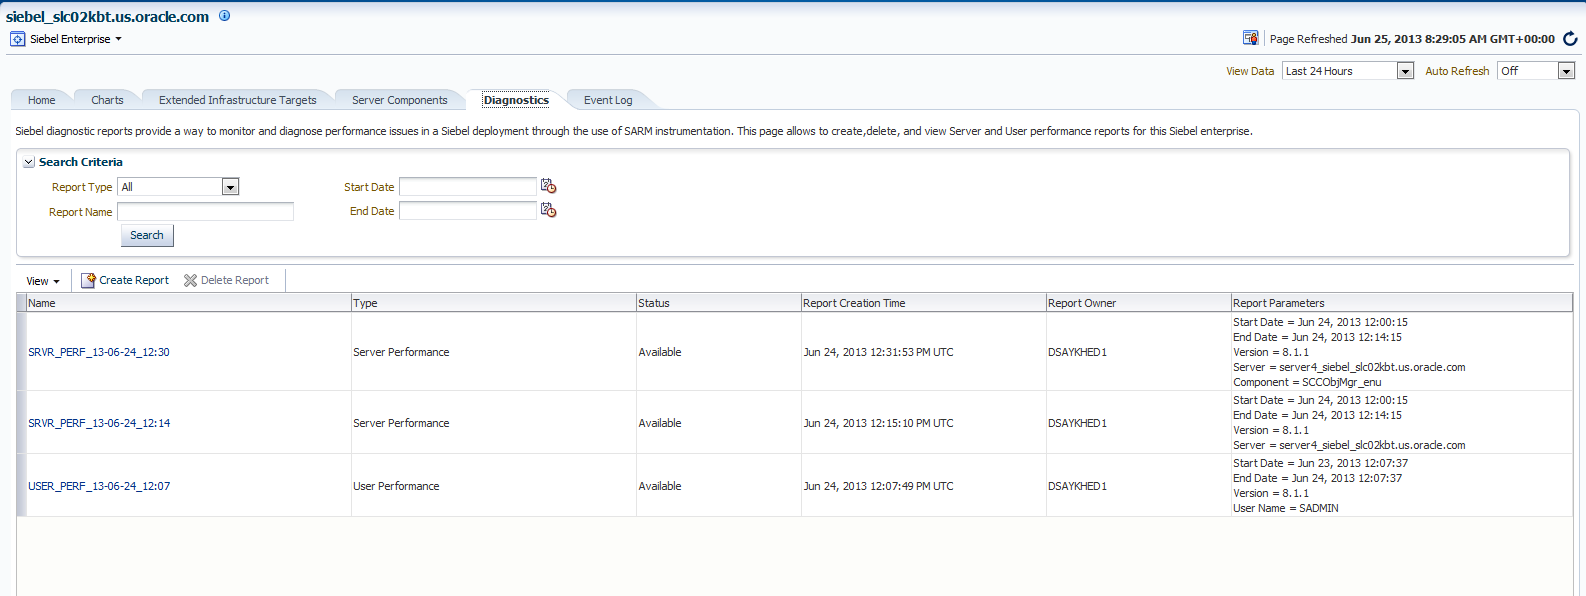
From the Siebel Enterprise Home page, click the Diagnostics tab.
Figure 6-1 displays the Diagnostics Reports Page.
-
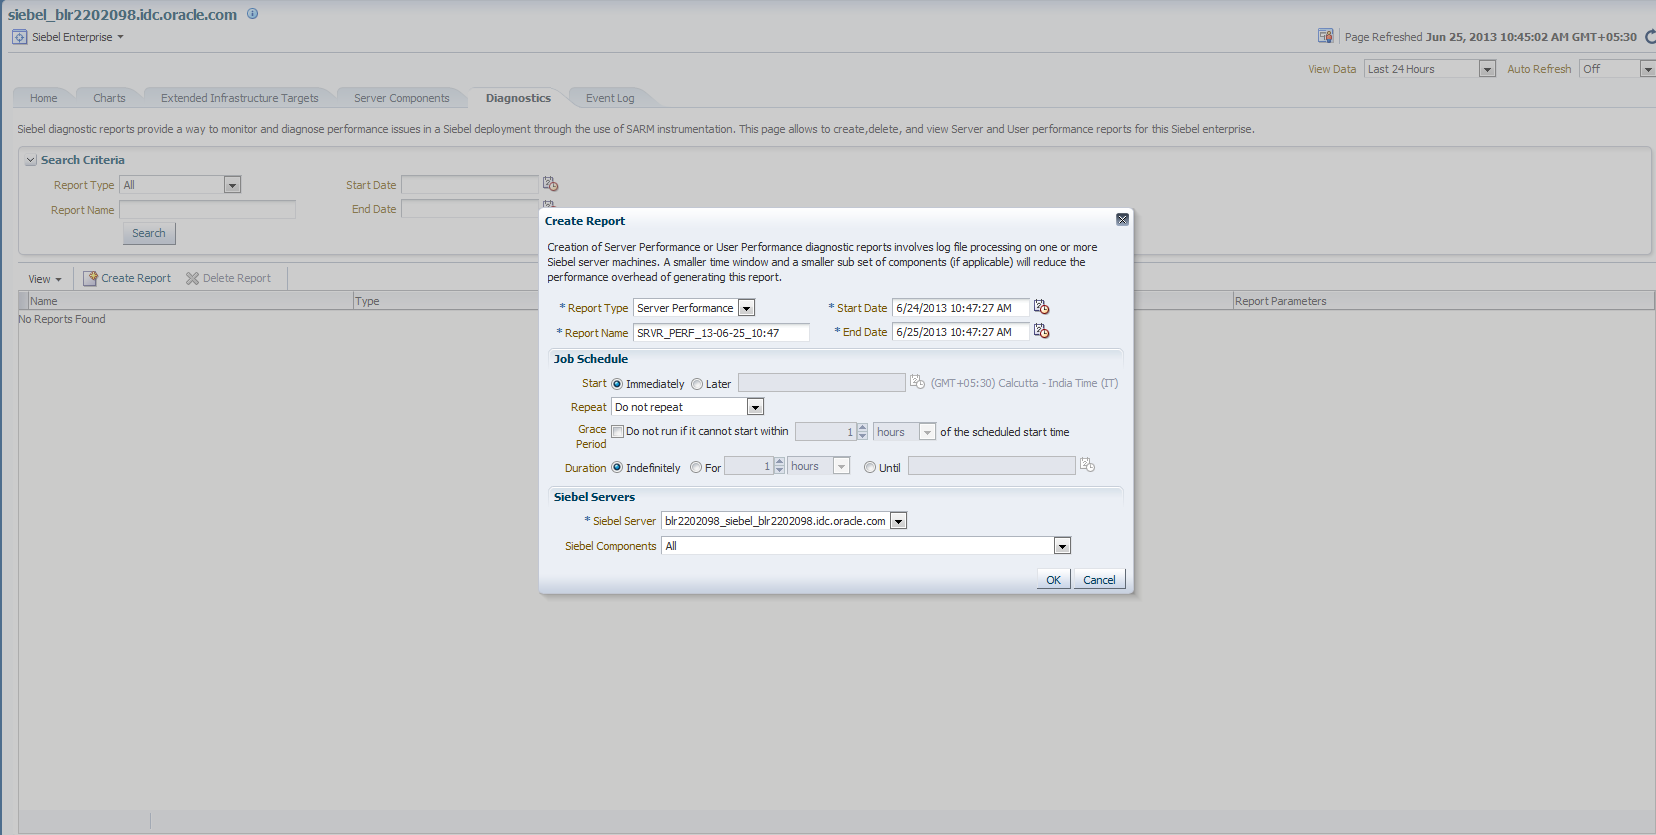
Click Create Report.
Clicking on Create Report opens the Create Report Wizard. Figure 6-2 displays the Create Report wizard, which enables you to create a Server Performance or User Performance report.
-
Select the report type, Server Performance Report or User Performance Report, specify values for the fields, and click OK.
There is also the option of scheduling reports for a later time or later date.
Viewing Server Performance Reports
Server Performance reports enable you to analyze different servers and server components, one server at a time. The following sections describe how to use Server Performance reports to monitor, analyze, and diagnose server and server component data.
Server Performance Report <Report Name> Page
To view this page (shown in Figure 6-3), from the Diagnostics Reports page, click the name of the Server Performance report you want to view.
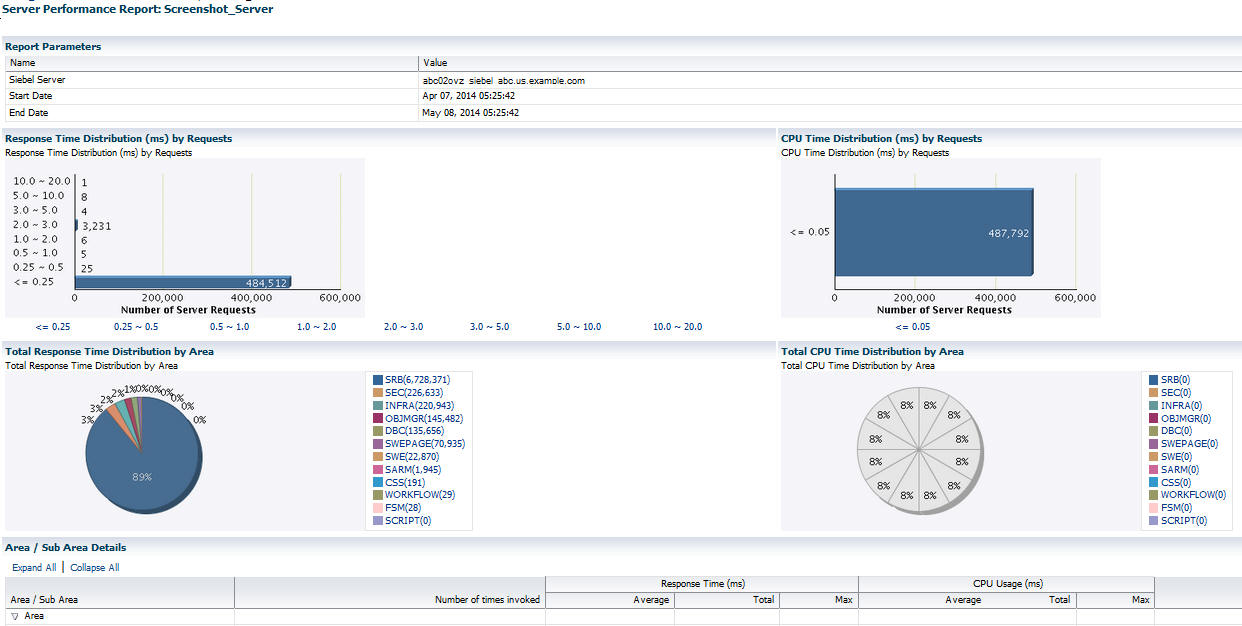
This page contains the following information:
-
Report Parameters — Displays report parameters for the server and the value for each.
-
SARM Response Time — Displays the response time to process requests measured through the Siebel Application Response Measurement (SARM) facility. SARM is a mechanism for capturing performance data of Siebel Applications at key locations within the Siebel Server infrastructure. Refer to the System Monitoring and Diagnostic Guide included in the Siebel documentation for details.
This chart helps you understand the response time to process requests by the Siebel server. The information is displayed in a histogram. Basically, the chart displays buckets in a time range and displays the requests processed for each bucket. You can click the bucket to drill down and view more details from the Server Performance <Report Name> <Bucket> page.
Note:
When you click one of the two most expensive buckets (that is, the buckets with the most expensive requests in terms of Response Time or CPU Time consumption), the page is displayed instantly as the data is pre-fetched. When you click other buckets, the same page is displayed, but only after the job to retrieve SARM data from the log files is completed. -
CPU Time — Displays the CPU time consumed by requests measured through the SARM network. This helps you understand the CPU time consumed to process requests by the Siebel server. The information is displayed in a histogram. The chart displays buckets in a time range and displays the requests processed for each bucket. You can click the bucket to drill down and view more details from the Server Performance - <Report Name> <Bucket> page.
-
Area / Sub Area Distribution — Displays performance details for areas or sub-areas of the Siebel server. SARM functions based on points or areas where performance information is generated; for example, the start and end of each database operation. Area specifies the broad area or software layer where a request is processed. For example:
-
DBC (Database Connector): This database layer tracks the percentage of time for requests in database processing.
-
INFRA (Infrastructure Area): This infrastructure area handles all functions related to networking, memory management, and so on.
-
SWE (Siebel Web Engine): This area is active when actual Web pages are built; for example, during assembly of HTML output.
-
OBJMGR (Object Manager): This layer handles object relational mapping, and is where most of the actual application code is executed.
-
SARM: This is the performance diagnostics area.
Also, each of these areas has certain sub-areas; for example, DBC_EXECUTE,
DBC_FETCH, and others in the DBC area that permit tracking of performance data at a higher level of granularity. -
Server Performance Report <Report Name> <Bucket> Page
To view this page (shown in Figure 6-4), from the Server Performance Report <Report Name> Page, click a bucket in the SARM Response Time or CPU Time page.
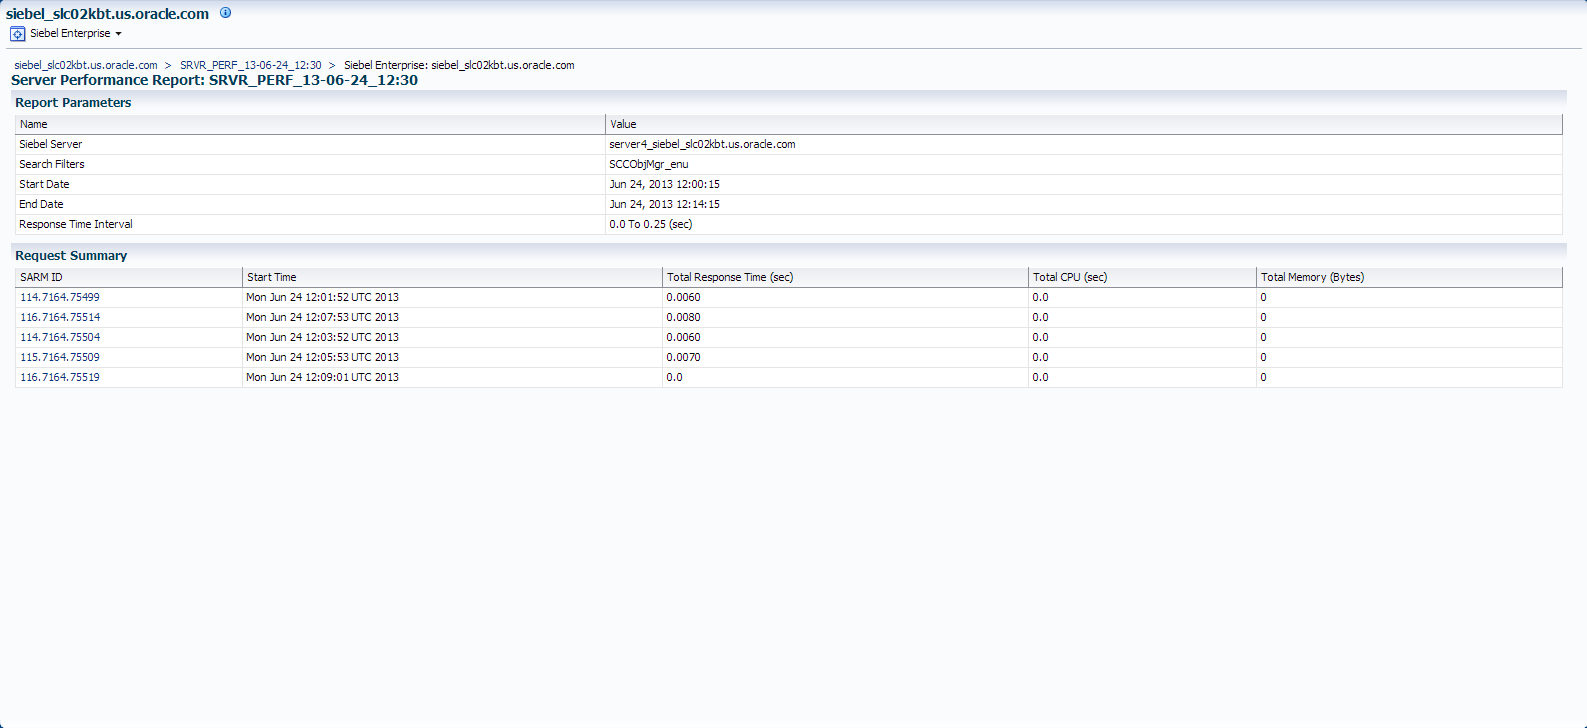
This page contains the following information:
-
Report Parameters — Displays the report parameters for the server and the value for each.
-
Request Summary — Displays the summary of requests the Siebel server processes as measured by the Siebel Application Response Measurement (SARM) network. Click SARM ID in this page to drill down and view details of the percentage of resource consumed in each of the layers involved in processing a request. Enterprise Manager displays the Server Performance Report <Report Name> <Request ID > page.
Server Performance Report <Report Name> <Request ID> Page
To view this page (shown in Figure 6-5), click SARM ID in the Request Summary section of the Server Performance Report <Report Name> <Bucket> page. You can use this page to view details about SARM requests serviced by the server.
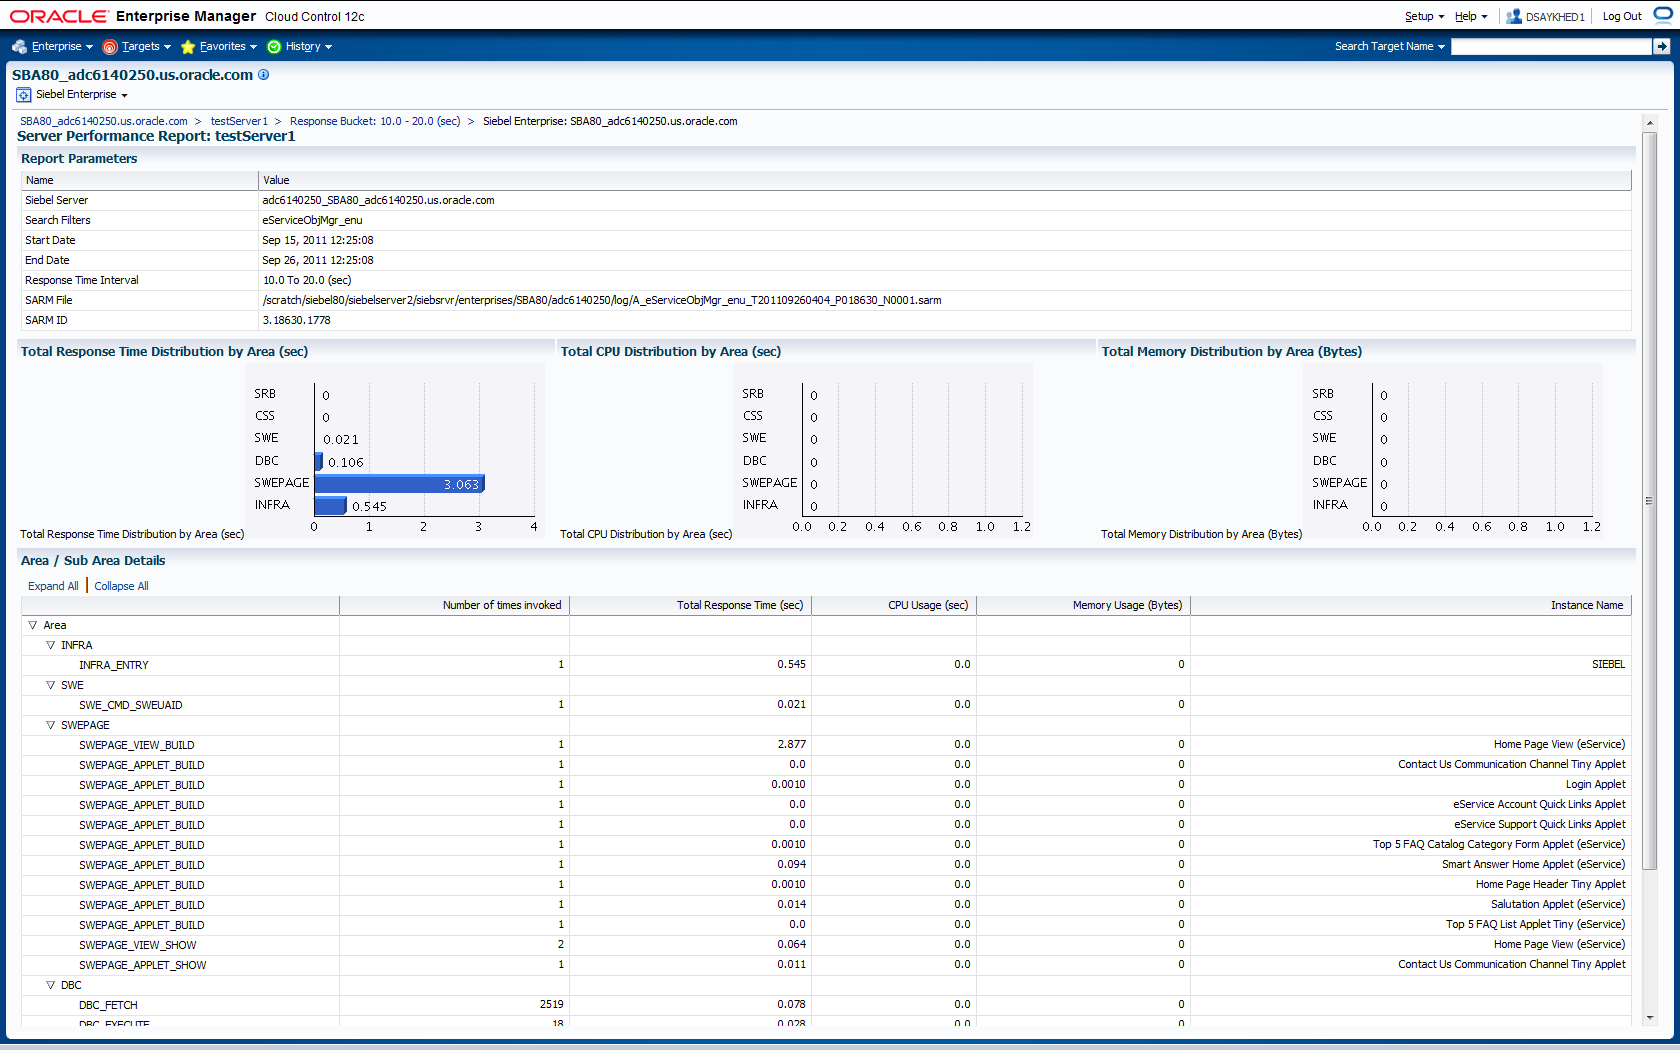
The details displayed in this page are:
-
Report Parameters — Displays the report parameters for the server and the value for each.
-
Total Response Time Distribution by Area — Displays the response time by area measured by the SARM framework. This helps you understand the response time taken by each area of the Siebel server to process requests.
-
Total Memory Distribution by Area — Displays the memory distribution by area measured by the SARM framework. This helps you understand the memory distribution among various areas of the Siebel server while processing requests.
-
Total CPU Distribution by Area — Displays the CPU distribution by area measured by the SARM framework. You can analyze the CPU time taken by each area of the Siebel server.
-
Area / Sub Area Distribution Section — Displays performance details for areas or sub-areas of the Siebel server. SARM functions based on points or areas where performance information is generated; for example, the start and end of each database operation. Area specifies the broad area or software layer where a request is processed.
Viewing User Performance Reports
User Performance reports enable you to analyze the performance for sessions of a specific user, providing details on the response time and allowing drill-downs into individual user requests. The following sections describe how to use the User Performance reports to monitor, analyze, and diagnose user data.
User Performance Report <Report Name> Page
To view this page (shown in Figure 6-6), from the Diagnostics Reports page, click the name of the User Performance report you want to view.
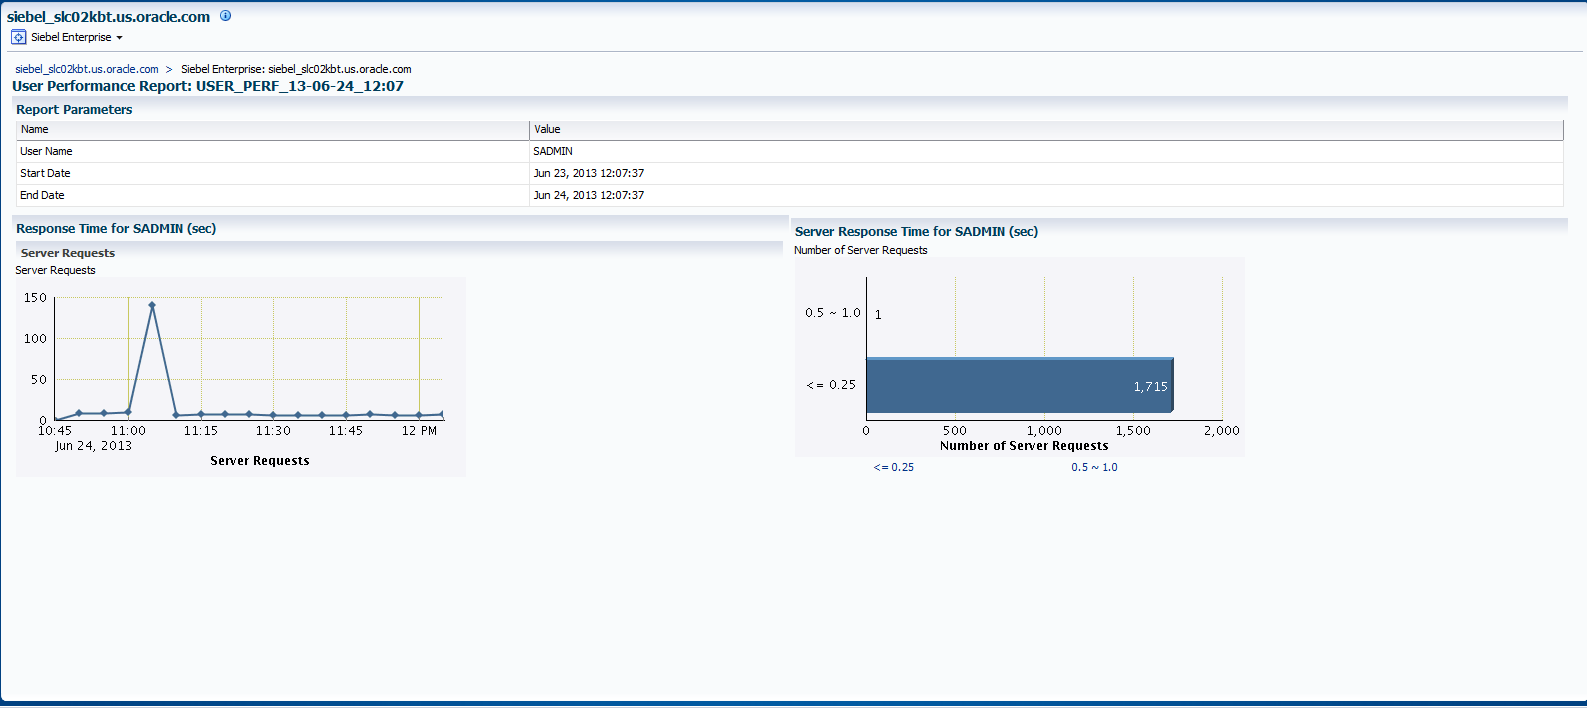
This page contains the following information:
-
Reports Parameters — Displays report parameters for the user and the value for each.
-
Response Time for 'User' — Displays the response time to process the user's requests measured through the Siebel Application Response Measurement (SARM) network. This helps you understand the response time to process requests by the user. It provides a trend and overview of the response time for the selected user and the specified time; that is, the chart displays requests from oldest to the most recent from right to left.
-
Histograms of Server Response Time for 'User' — Displays the server response time to process the user's requests. This chart helps you understand the response time to process user requests by the Siebel server. The information is displayed in a histogram. Basically, the chart displays buckets in a time range and displays the requests processed for each bucket. You can click the bucket to drill down and view more details from the User Performance <Report Name> <Bucket> page.
User Performance Report <Report Name> <Bucket> Page
To view this page (shown in Figure 6-7), from the User Performance Report <Report Name> Page, click a bucket in the Histograms of Server Response Time for 'User' chart in the User Performance Report <Report Name> page.
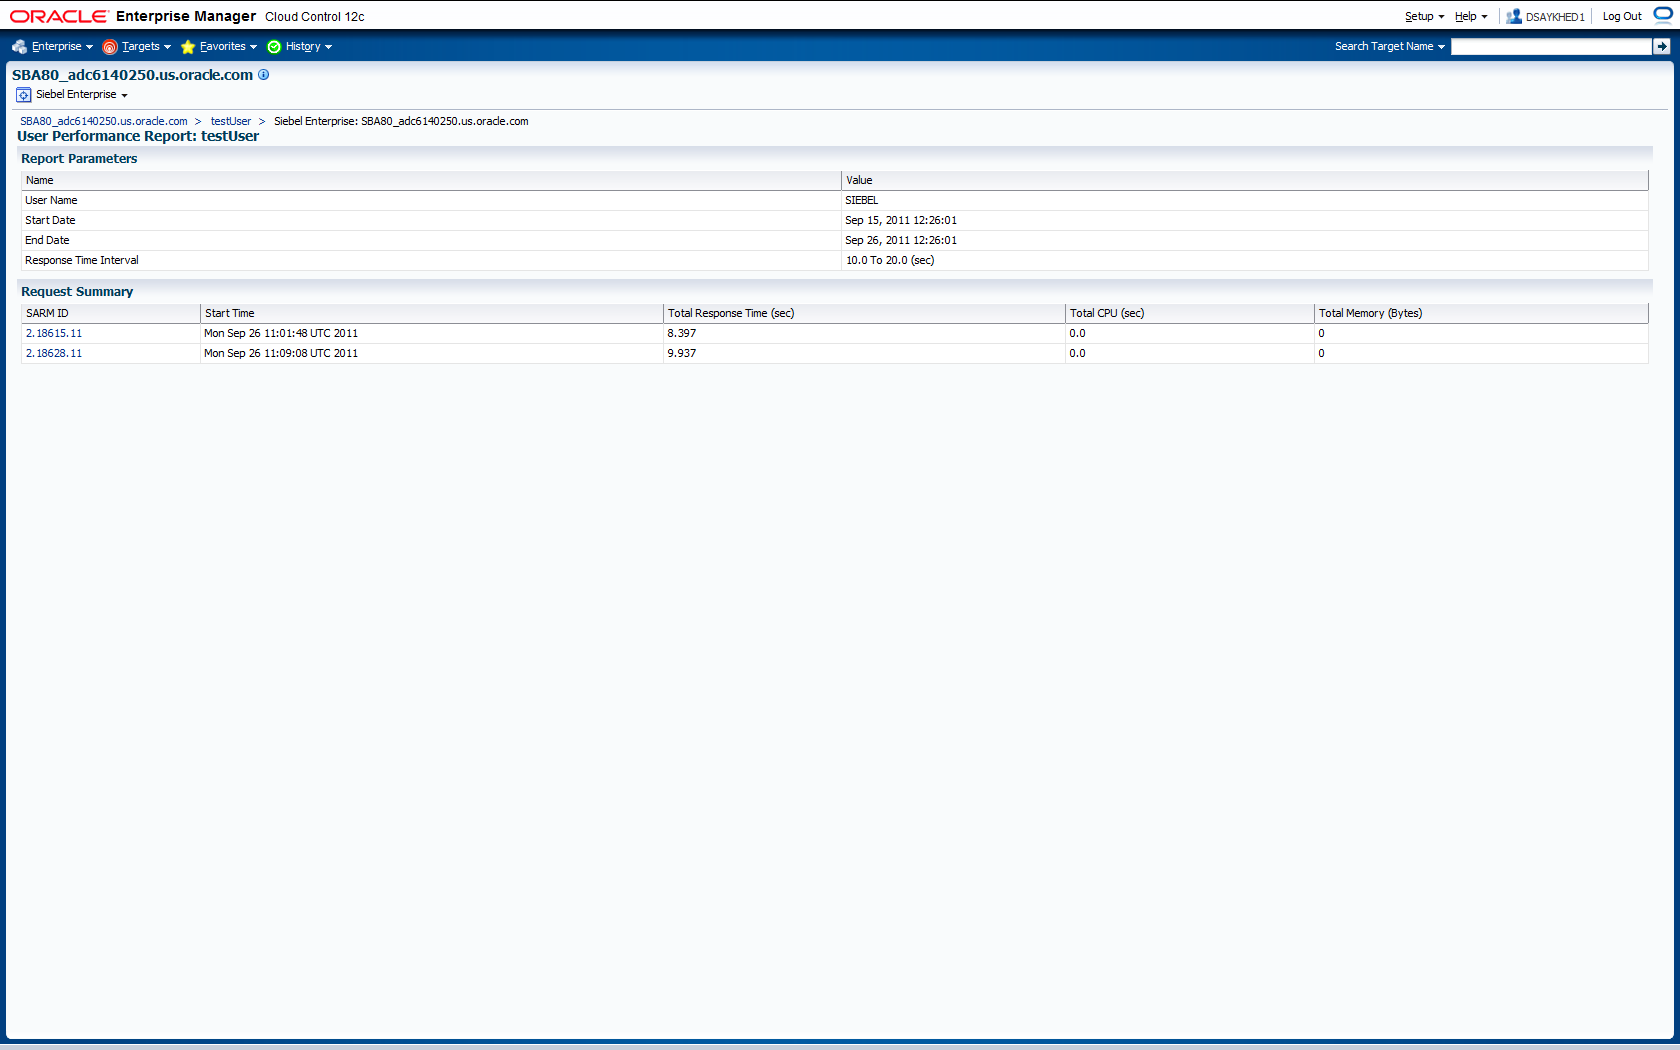
This page contains the following information:
-
Report Parameters — Displays the report parameters for the user and the value for each.
-
Request Summary — Displays the summary of user requests as measured by the Siebel Application Response Measurement (SARM) network. Click the SARM ID to drill down and view details of the percentage of resource consumed in each of the layers involved in processing a request. Enterprise Manager displays the User Performance Report <Report Name> <Request ID > page.
User Performance Report <Report Name> <Request ID> Page
To view this page (shown in Figure 6-8), click SARM ID in the Request Summary section of the User Performance Report <Report Name> <Bucket> page. You can use this page to view details about SARM requests serviced by the user.
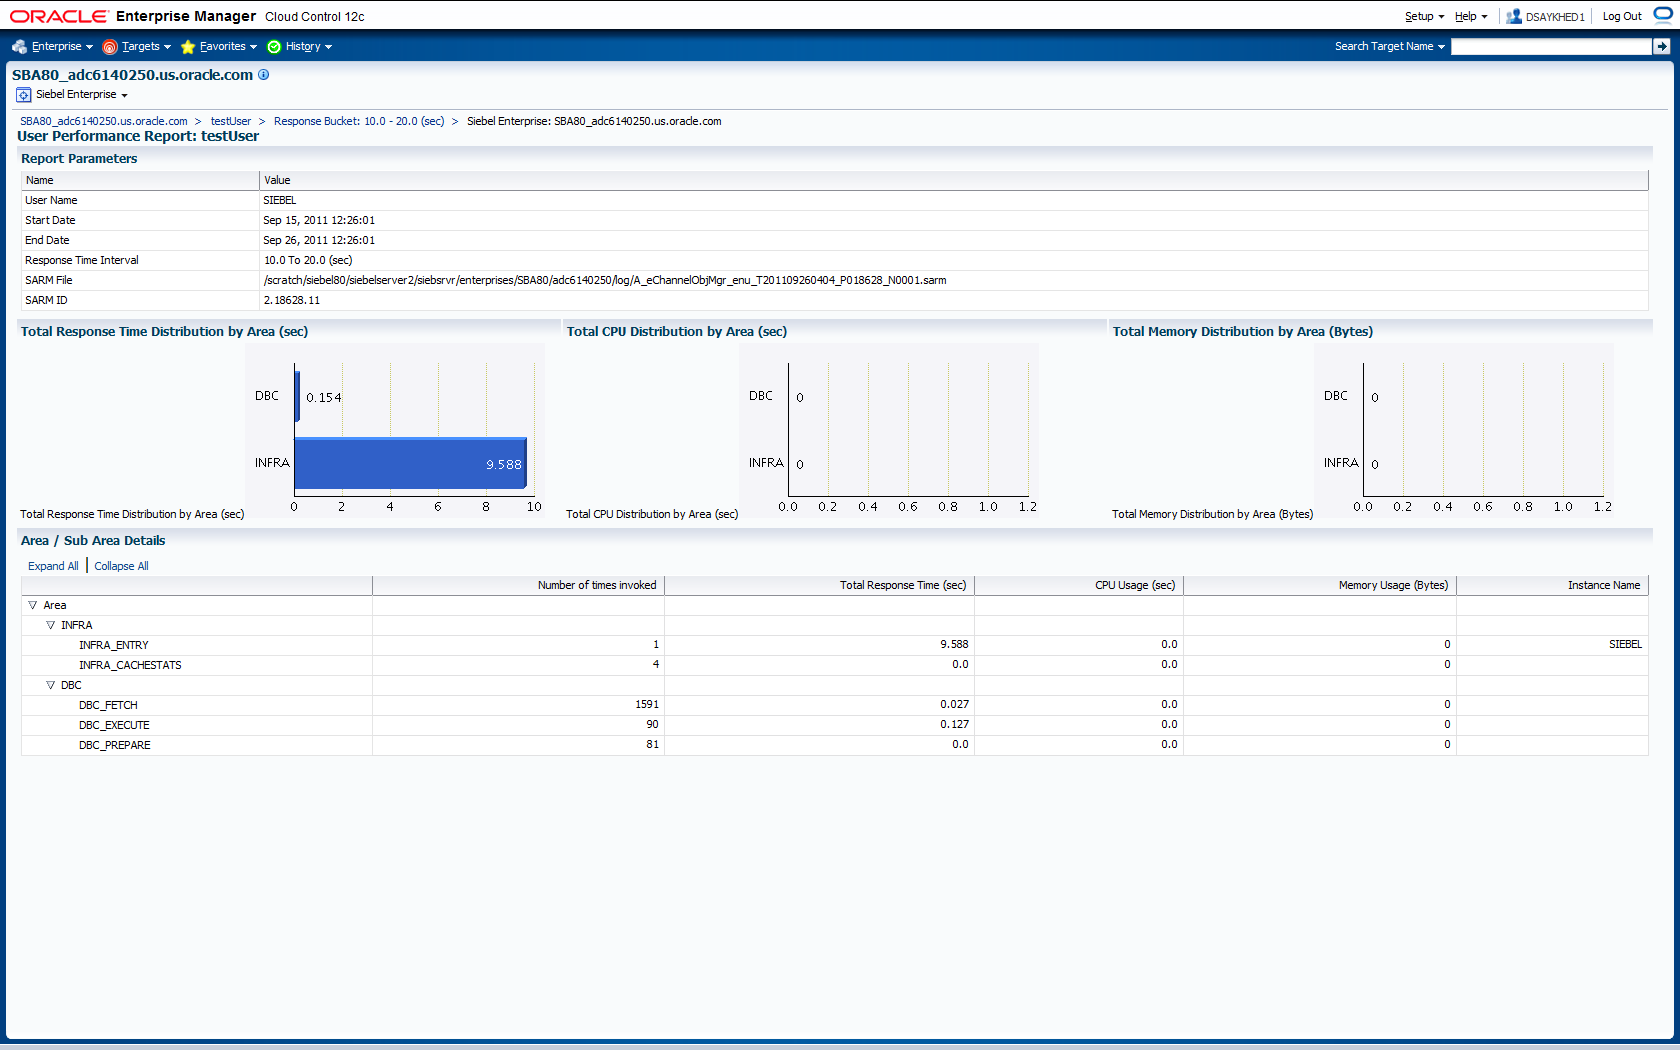
The details displayed in this page are:
-
Report Parameters — Displays the report parameters for the server and the value for each.
-
Total Response Time Distribution by Area — Displays the response time by area measured by the SARM framework. This helps you understand the response time taken by each area of the Siebel server to process user requests.
-
Total Memory Distribution by Area — Displays the memory distribution by area measured by the SARM framework. The chart displays the memory distribution among various areas of the Siebel server while processing user requests.
-
Total CPU Distribution by Area — Displays the CPU distribution by area measured by the SARM framework. The chart displays the CPU time taken by each area of the Siebel server to process user requests.
-
Area / Sub Area Distribution Section — Displays performance details for areas or sub areas of the Siebel server. SARM functions based on points or areas where performance information is generated; for example, the start and end of each database operation. Area specifies the broad area or software layer where a request is processed.