7 Using JD Edwards Compare and Merge Tools
This chapter contains the following topics:
-
Section 7.1, "Understanding JD Edwards EnterpriseOne Compare and Merge Tools"
-
Section 7.2, "Application Configuration Analyzer (Release 9.1 Update 2)"
-
Section 7.3, "JD Edwards Visual Compare for UDC Descriptions and Glossary Tool"
7.1 Understanding JD Edwards EnterpriseOne Compare and Merge Tools
JD Edwards compare and merge tools enable you to compare two versions of JD Edwards EnterpriseOne objects and non-code objects, such as versions, UDCs, data dictionary items. If you have made custom modifications to business data, forms, or event rules, the compare and merge tools can help you retrofit your changes or verify that they were carried forward to a new release. Furthermore, you can use these tools anytime you want to compare items between two environments.
7.2 Application Configuration Analyzer (Release 9.1 Update 2)
The Application Configuration Analyzer is a set of reports which identify differences for processing options, data dictionary (DD) items, and user defined codes (UDCs) between releases or environments. These reports are:
-
Version Compare Report
-
User Defined Codes Compare Report
-
Data Dictionary Compare Report
Note:
JD Edwards provides the report templates and report definitions to produce the Application Configuration Analyzer reports using the JD Edwards EnterpriseOne embedded BI Publisher.For information about the embedded BI Publisher, see "Introduction to BI Publisher for JD Edwards EnterpriseOne" in the JD Edwards EnterpriseOne Tools BI Publisher for JD Edwards EnterpriseOne Guide.
7.2.1 Version Compare Report
The Version Compare report (R983051N) compares the processing options for interactive versions and batch versions between two environments or data sources. Environment (1) and Data Source (1) are determined from the current sign on environment. You specify Environment (2) or Data Source (2) in a processing option to indicate the environment or data source to use for comparison.
Before an upgrade, you can compare the versions in the Production and Pristine environments to determine which versions were added, deleted, or changed. After the upgrade, you can use the report to verify that your modifications were carried forward to the new release.
Another way to use the report is as an audit or validation tool. For example, if a version performs as expected in a development environment but not in a production environment, you can use the Versions Compare report to see if there are processing option differences in the two environments.
The comparison report includes both a summary and a detailed section. The detailed section is sorted by system code and object type.
7.2.1.1 Processing Options
The following processing options enable you to specify the processing for the report.
- 1. Enter the Environment (2) that you want to compare.
-
Specify an environment to compare with the sign on environment. Leave this option blank if you want to compare data sources.
- 2. Or Enter the Data Source (2) for Versions table F983051.
-
Specify a data source to compare with the sign on data source. Leave this option blank if you want to compare environments.
- 3. Enter '1' to display all selected versions.Enter '2' to display only 'Processing Option (PO) Data' that are different.Default is to display all versions that are different.
-
Use this processing option to display all versions, all versions that are different, or only those where the processing option data is different.
Entering '1' displays all versions, even if there are no differences.
Entering '2' displays batch versions that have different processing option values.
The default (blank) displays:
-
Versions that exist in one environment or data source, but not in another.
-
Versions with processing option values that are different.
7.2.1.2 Running the Report
To run the Version Compare report:
-
From the Software Compare Tools (GH96111) menu, select Compare Versions.
-
Enter values for the processing options.
-
Click Submit.
Note:
Do not run multiple instances of the Version Compare report simultaneously. The report uses work table F98881 to build the report data. If two Version Compare reports are running at the same time, the information in the reports will not be accurate. -
Select options for the report definition, and then click Next.
-
From Recent Reports on the top menu bar, select Version Compare report.
Note:
If the report is not shown in the drop-down list, select View Job Status to monitor the processing of the report. -
When the report processing is complete, you can view or print the output by selecting either View Job Status or Version Compare report from the Recent Reports menu.
7.2.1.3 Reading the Report
The Version Compare report identifies differences in the interactive and batch versions between two environments or data sources. Based on the processing options that you select, the report will identify the following:
-
Versions that exist in one environment or data source, but not in the other.
-
Processing option values that are different in the compared versions.
-
Data selection differences for batch versions.
7.2.1.4 Report Components
The cover page of the report shows the report title, the date and time of the report, the data sources that were compared, and the report level of detail that was selected.
The report contains the following components:
-
Processing Option Data Changed - Summary by System Code (table)
-
Version Differences Detail (horizontal bar graph and table)
-
Report summary (text)
The summary section displays a table that summarizes the number of versions without processing option data changes, the number of versions with processing option data changes, and the total number of versions for each system code.
The detail portion of the report is grouped by system code. At the beginning of each system code section, a horizontal bar chart shows the total number of versions with processing option data differences and without processing option data differences in that system code.
Each version with differences has a table with the following columns:
| Column Heading | Description |
|---|---|
| Result | Describes the result of the comparison. Values are:
Only In: The version is only in the location shown in the Data Src column. Different: The versions in the two locations are not identical. PO Data Differ: The version processing option values are different. |
| Data Src | Data Location (1) or (2) |
| Version | Version Name
An example of a version name is XJDE0001 or VER0003. |
| Version Title | Version Title
An example of a version title is ”Mailing Labels for the Eastern Region.” |
| Security Flag | Values are:
0 - No Security 1 - Medium Security 2 - Medium to Full Security 3 - Full Security |
| Option Code | Values are:
Blank - Disables the processing options for the version. 1 - Blind Execution. The application will use existing processing options without prompting the user. 2 - Prompt for Values. The application will prompt the user for processing options at run time |
| Check Out Status | Indicates whether the version is checked out in Object Management Workbench.
Values are Y or N. |
| Version Availability | Values are:
Y - The version is available for use from the server. N - The version is not available for use from the server. |
| Processing Option Template Name | Processing Option Template Name
An example of a processing option template name is T0018P. |
| PO Data Differ (Y/N) | Processing Option Data Difference
Indicates whether there are differences in the processing option values in the compared versions. Values are Y or N. |
Note:
To change processing option values shown on the Version Compare report:-
For batch versions, use the Batch Versions (P98305W) application.
-
For interactive versions, use the Interactive Versions (P983051) application.
7.2.1.5 Report Summary
The summary at the end of the report displays the names of the environments or data sources that were compared and the F983051 table mappings. Also included is a record count with the following information:
-
Total number of versions selected in each data source.
-
Total number of versions that are only in one data source or the other.
-
Total number of versions that are different.
-
Total number of versions with processing option data that is different.
The terms used in the report are defined as follows:
| Term | Definition |
|---|---|
| Only in (1) | Version is only in Data Source (1) |
| Only in (2) | Version is only in Data Source (2) |
| Different | Version in Data Source (1) and (2) are not identical. |
| PO Data Differ - Y | Version processing option values are different. |
7.2.2 User Defined Code Compare Report
The User Defined Code Compare report (R960004N) displays differences in the user defined codes (UDCs) in two environments or data sources. Environment (1) and Data Source (1) are determined from the current sign on environment. You specify Environment (2) or Data Source (2) in a processing option to indicate the environment or data source to use for comparison. If data sources are compared, the F0004 User Defined Code Types and F0005 User Defined Codes tables must exist in both data sources for the comparison to succeed.
Before an upgrade you can compare the UDCs in the Production and Pristine environments to determine which UDCs were added, deleted, or changed. After the upgrade, you can use the report to verify that your UDC modifications were carried forward to the new release.
Another way to use the report is as an audit or validation tool. For example, if a UDC performs as expected in a development environment but not in a production environment, you can use the User Defined Code Compare report to see if there are UDC differences in the two environments.
The comparison report includes both summary and detailed sections. The detailed section is sorted by system code, and then by UDC type, such as 01/ST.
7.2.2.1 Processing Options
The following processing options enable you to specify the processing for the report.
- 1. Enter the Environment (2) that you want to compare.
-
Specify an environment to compare with the sign on environment. Leave this option blank if you want to compare data sources.
- 2. Or Enter the Data Source (2) for User Defined Code (UDC) tables.
-
Specify a data source to compare with the sign on data source. Leave this option blank if you want to compare environments. If you are comparing the UDCs in data sources, Data Source (2) must contain the F0004 and F0005 UDC tables.
- 3. Enter '1' to display all selected UDCs.Default is to display all UDCs that are different.
-
Entering '1' displays all UDCs, even if there are no differences.
The default (blank) displays:
-
UDCs with different values.
-
UDCs that exist in one environment, but not in the other.
-
7.2.2.2 Running the Report
To run the User Defined Code Compare report:
-
From the Software Compare Tools (GH96111) menu, select Compare User Defined Codes.
-
Enter values for the processing options.
-
Click Submit.
Note:
Do not run multiple instances of the User Defined Code Compare report simultaneously. The report uses work table F98881 to build the report data. If two User Defined Code Compare reports run at the same time, the information in the reports will not be accurate. -
Select options for the report definition, and then click Next.
-
From Recent Reports on the top menu bar, select User Defined Codes Compare report.
Note:
If the report is not shown in the drop-down list, select View Job Status to monitor the processing of the report. -
When the report processing is complete, you can view or print the output by selecting either View Job Status or User Defined Code Compare report from the Recent Reports menu.
7.2.2.3 Reading the Report
The User Defined Code Compare report identifies differences in the UDCs between two environments or data sources. Based on the processing options that you select, the report will identify the following:
-
UDCs that exist in one environment or data source, but not in the other.
-
UDCs with different field values.
7.2.2.4 Report Components
The cover page of the report shows the report title, the date and time of the report, the data sources that were compared, and the report level of detail that was selected.
The report contains the following components:
-
Summary by User Defined Code Types (horizontal bar graph).
-
Differences by Product Code (table).
-
Report summary (text and table)
A horizontal bar graph at the beginning of the report displays the percentage of UDC differences in each product code.
The Differences by Product Code portion of the report is grouped by product code. Only the product codes with UDC differences display on the report. Under each product code section are UDCs with differences (grouped by UDC, such as 01/PH). A table for each UDC or UDC value with differences shows the differences that were found.
For example, an entire UDC, such as 01/PH, could exist in one environment or data source, but not in the other. Or, if the UDC exists in both locations, some of the code values could be different. For instance, the BUSN code within the 01/PH UDC shown in the following example could be missing in one location or have a different value for one of its fields, such as Description 01.
This is an example of a UDC:
Each UDC with differences displays a table showing the values for the UDC and for any codes within the UDC with differences.
The following columns are shown for the UDC:
| Column Heading | Description |
|---|---|
| Result | The Result column indicates that the UDC has differences. |
| Product Code | The UDC's product code. |
| Code Types | The UDC type, which is a code that identifies the table that contains user defined codes. For example, for UDC 01/PH the type is PH. |
| Description | The UDC description. |
| Code Length | The maximum length of UDC code values. |
| Second Line (Y/N) | Determines if the Select User Defined Code form will display a second line of description. Valid values are:
|
| Numeric (Y/N) | Determines whether a user defined code is numeric or alphanumeric. Valid values are:
|
The following columns are shown for the UDC codes:
| Column Heading | Description |
|---|---|
| Result | The Result column displays one of these values:
The 1 or 2 value indicates in which environment or data source the difference was found. |
| Product Code | The UDC's product code. |
| Code Types | The UDC type, which is a code that identifies the table that contains user defined codes. For example, for UDC 01/PH the type is PH. |
| UDC Codes | The code values within the UDC with differences. |
| Description 01 | Values that are different for the Description 01 field are shown in this column. |
| Description 02 | Values that are different for the Description 02 field are shown in this column |
| Special Handling | Values that are different for the Special Handling field are shown in this column. |
| Hard Coded Y/N | Values that are different for the Hard Coded field are shown in this column. |
Note:
Use the User Defined Codes (P0004A) application to change UDCs and UDC values.7.2.2.5 Report Summary
The summary at the end of the report shows the environment or data sources that were compared and the F0004 and F0005 UDC table mappings. Additionally, the report displays a table with the following information for each location:
-
Total UDCs (F0004) selected in Data Source (1) and Data Source (2).
-
Total UDCs (F0004) only in Data Source (1) and Data Source (2).
-
Total UDCs (F0004) that are different.
-
Total UDCs (F0005) selected in Data Source (1) and Data Source (2).
-
Total UDCs (F0005) only in Data Source (1) and Data Source (2).
-
Total UDCs (F0005) that are different.
The terms used in the report are defined as follows:
| Term | Definition |
|---|---|
| Only in (1) | The UDC is only in Data Source (1) |
| Different | The UDC in Data Source (1) and (2) are not identical. |
| Only in (2) | The UDC is only in Data Source (2) |
7.2.3 Data Dictionary Compare Report
The Data Dictionary Compare report (R969200N) compares data dictionary items between two environments or data sources. Environment (1) and Data Source (1) are determined from the current sign on environment. You specify Environment (2) or Data Source (2) in a processing option to indicate the environment or data source to use for comparison.
Before an upgrade, you can compare the data dictionary items in the Production and Pristine environments to determine which items were added, deleted, or changed. After the upgrade, you can use the report to verify that your modifications were carried forward to the new release.
Another way to use the report is as an audit or validation tool. For example, if a data dictionary item performs as expected in a development environment but not in a production environment, you can use the Data Dictionary Compare report to see if the items in the two environments are different.
The report includes both a summary and a detailed section. The detailed section is sorted by system code, and then by the item alias name within each system code.
7.2.3.1 Processing Options
The following processing options enable you to specify the processing for the report.
- 1. Enter the Environment (2) that you want to compare.
-
Specify an environment to compare with the sign on environment. Leave this option blank if you want to compare data sources.
- 2. Or Enter the Data Source (2) for Data Dictionary tables.
-
Specify a data source to compare with the sign on data source. Leave this option blank if you want to compare environments.
The data dictionary tables that will be used for comparison are F9200, F9203, F9207, F9210, and GT92002.
- 3. Enter '1' to display all selected DD items.Default is to display all DD items that are different.
-
Entering '1' displays all selected DD items, even if there are no differences.
The default (blank) displays:
-
Data dictionary items with different values.
-
Data dictionary items that exist in one environment, but not in the other.
-
7.2.3.2 Running the Report
To run the Data Dictionary Compare report:
-
From the Software Compare Tools (GH96111) menu, select Compare Data Dictionary.
-
Enter values for the processing options.
-
Click Submit.
Note:
Do not run multiple instances of the Data Dictionary Compare report simultaneously. The report uses work table F98881 to build the report data. If two Data Dictionary Compare reports run at the same time, the information in the reports will not be accurate. -
Select options for the report definition, and then click Next.
-
From Recent Reports on the top menu bar, select Data Dictionary Compare report.
Note:
If the report is not shown in the drop-down list, select View Job Status to monitor the processing of the report. -
When the report processing is complete, you can view or print the output by selecting either View Job Status or Data Dictionary Compare report from the Recent Reports menu.
7.2.3.3 Reading the Report
The Data Dictionary Compare report identifies differences in the data dictionary tables between two environments or data sources. The following data dictionary tables are compared:
| Table Name | Description |
|---|---|
| F9200 | Data Item Master |
| F9203 | Data Item Alpha Description |
| F9207 | Error Message Information |
| F9210 | Data Item Specifications |
| GT92002 | Data Dictionary Glossary |
Based on the processing options that you select, the report will identify the following:
-
Data dictionary items that exist in one environment or data source, but not in the other.
-
Values which are different in the compared data dictionary items.
7.2.3.4 Report Components
The cover page of the report shows the report title, the date and time of the report, the data sources that were compared, and the report level of detail that was selected.
The report contains the following components:
-
Summary by Product Code (horizontal bar graph)
-
Data item differences (detail tables)
-
Report summary (text and table)
The summary displays a horizontal bar graph showing the number of data items with differences in each product code in two environments or data sources. The summary is followed by a detail section, which displays detailed information about the items in both locations.
The detail section for each product code is sorted by data item aliases. The section consists of a table for each item, which displays the item differences. The information shown in the table differs, depending on whether the data dictionary item is a regular data item or a glossary data item.
Note:
If the data item exists only in Environment (2) or Data Source (2), the report lists the item but does not display a detail section for the item.For more information, see ”Understanding the Data Dictionary” in the JD Edwards EnterpriseOne Tools Data Dictionary Guide.
Each glossary item with differences has a table with the following columns:
| Column Heading | Description |
|---|---|
| Result | Describes the result of the comparison.
DD: The glossary data dictionary items in the two locations are different. |
| Glossary Group | The glossary group assigned to the glossary data item in the Data Item Master (F9200) table.
The most common glossary groups for glossary data items are E, H, X, or Y, although other types are available. |
| Product Code | The product code assigned to the glossary data item in the Data Item Master (F9200) table. |
| Product Code Reporting | The product reporting code assigned to the glossary data item in the Data Item Master (F9200) table. |
| Error Message | Error message tab for F9207. |
| Program Name | Program name (FRPGM) in F9207. |
| Error Level | The error level assigned to the glossary data item in the Error Message Information (F9207) table
Values are:
|
| Item Glossary | Item Glossary tab for F9203 |
| Data Item
Language Product System Code Scrn/Rpt |
Data Item (FRDTAI) for DD Alpha Descriptions F9203
Language (FRLNGP) in F9203 System Code (FRSYR) in F9203 Screen Name (FRSCRN) in F9203 |
| Alpha Description | The description assigned to the glossary data item in the Data Item Alpha Description (F9203) table. |
| Generic Text Key | The glossary data dictionary item's Generic Text Key. |
| Glossary Text Change | Indicates differences in the glossary text.
Values are:
|
Note:
To access the values for glossary data items, select any of the following Data Dictionary Design (GH951) menu selections:-
Work with Data Dictionary Items (P92001).
Select Glossary Data Item from the Form menu.
-
Error Messages (P92002).
-
Workflow Messages (P92002).
-
Processing Option Glossaries. (P92002)
Each regular data item with differences has a table with the following columns:
| Column Heading | Description |
|---|---|
| Result | Describes the result of the comparison.
Values are:
|
| Glossary Group | The glossary group assigned to the glossary data item in the Data Item Master (F9200) table.
Values are: C, D, K, S, E. |
| Product Code | The product code assigned to the data item in the Data Item Master (F9200) table. |
| Product Code Reporting | The product reporting code assigned to the data item in the Data Item Master (F9200) table. |
The second portion of the table displays the values for the data item in the two environments or data sources being compared. The table shows the data item values for the following categories:
-
Item Specifications
-
Default Value
-
Visual Assist
-
Edit Rule
-
Display Rule
-
Next Number
-
Item Glossary
The table, with a side-by-side comparison of the field values in the two locations, enables you to verify all field value differences.
Note:
To access the values for regular data dictionary items, select Work with Data Dictionary Items (P92001) from the Data Dictionary (GH951) menu.7.2.3.5 Report Summary
The report summary displays the names of the environments or data sources that were compared and the data dictionary table mappings in both locations. Also included is a record count for the following tables:
-
Data Item Master (F9200)
-
Total number of data items selected in each data source.
-
Total number of data items that are only in Data Source (1) or Data Source (2).
-
Total number of data items that are different.
-
-
Data Item Alpha Description (F9203)
-
Total number of data items selected in each data source.
-
Total number of data items that are only in Data Source (1) or Data Source (2).
-
Total number of data items that are different.
-
-
Data Dictionary Glossary (GT92002)
-
Total number of data items that are only in Data Source (1) or Data Source (2).
-
Total number of data items that are different.
-
-
Error Message Information (F9207)
-
Total number of data items selected in each data source.
-
Total number of data items that are only in Data Source (1) or Data Source (2).
-
Total number of data items that are different.
-
-
Data Item Specifications (F9210)
-
Total number of data items selected in each data source.
-
Total number of data items that are only in Data Source (1) or Data Source (2).
-
Total number of data items that are different.
-
| Term | Definition |
|---|---|
| Only in (1) | DD is only in Data Source (1) |
| Different | DD in Data Source (1) and (2) are not identical. |
| Only in (2) | DD is only in Data Source (2). |
| A | DD Glossary Text is only in Data Source (1). |
| Y | DD Glossary Text in Data Source (1) and (2) are not identical. ('Y' means that there is a change) |
| N | DD Glossary Text in Data Source (1) and (2) are the same. (N means that there is no change) |
7.3 JD Edwards Visual Compare for UDC Descriptions and Glossary Tool
JD Edwards EnterpriseOne Visual Compare for UDC Descriptions and Glossary tool (P96472) enables you to review and apply text updates for Data Dictionary glossaries and UDCs. You can see a side-by-side comparison of the new and old text values, which enables you to choose whether to accept the changes. When you install an ESU containing UDC Description and Glossary changes, an XML file is extracted to the Special Instructions folder on the deployment server and is located in the following directory: ..\E900\SpecialInstructions. The Visual Compare for UDC Descriptions and Glossary Tool, application P96472, is run from an administrative client workstation within JD Edwards EnterpriseOne and applies the changes to the current environment. You must have installed the Planner Update, which contains Software Action Request (SAR) 7481054, completed the special instructions, and built and deployed your package.
To apply DD glossary and UDC description changes:
-
In the Fast Path, enter P96472.
-
On Work With Special Instructions, click Add.
On Search and Select Special Instructions, in the Server Share Path field, the path to the Deployment Server special instructions folder appears as the default.
-
If you have moved the folder or if the appropriate folder does not appear, click the browse button, navigate to the directory that contains the XML file, and select the directory. Click Find.
-
In the grid, click the appropriate ESU, and then click Select.
The data from the new ESU is imported and the application returns to the Work With Special Instructions form. The new ESUs appear in the grid. The Work With Special Instructions form appears. The ESUs appear in the grid.
-
Select the appropriate ESU.
-
Select one of the following options from the Row menu:
-
Accept: Select this option if you want to accept all updates in the ESU without reviewing them.
-
Reset Status: Select this option to change the status from Applied to Not Applied or from Reviewed to Not Applied.
Three types of statuses are available:
Status Description Applied Applied status appears if you have applied everything contained in the ESU. If you have applied parts of the ESU, but not all, then this status will not appear. Not Applied This status appears if you have not applied any of the ESU contents. Reviewed This status appears if you have looked at the ESU but not applied any of its contents.
-
-
Select the UDC Description Option to access the Work with UDC Description Changes form. This option is enabled only if the ESU contains changes to UDC descriptions.
The UDCs are grouped by product code and appear in a list underneath the Available UDC Items folder. Only those UDCs that have different descriptions from the ones that already reside in your current environment appear.
-
You can select individual UDCs, multiple UDCs, or all UDCs. To select all UDCs, click the top-level node located under the Available UDC Items folder. Clicking any node selects all of the UDCs beneath it. To accept the UDC descriptions, click Accept.
-
You can opt to view all UDCs in the ESU by clicking the All items option. Or, you can opt to view only those items that have not already been reviewed by clicking the Non Reviewed Items option.
-
Click the double-arrow button to accept the UDC description of the currently selected UDC.
-
Select the DD Glossary option to access the Work with DD Glossary Changes form. This option is enabled only if the ESU contains changes to DD glossaries.
The DD items are grouped by product code and appear in a list underneath the Special Instructions folder. Only those DD items that have different glossaries from the ones that already reside in your current environment appear.
-
You can select individual DD items, multiple DD items, or all DD items. To select all DD items, click the top-level node located under the Special Instructions folder. Clicking any node selects all of the DD items beneath it. To accept the DD glossaries, click Accept.
-
You can opt to view all glossaries in the ESU by clicking the All items option. Or, you can opt to view only those items that have not already been reviewed by clicking the Non Reviewed Items option.
-
Click the double-arrow button to accept the DD glossary of the currently selected DD.
-
Select the Preceding ESU option to view a summary of changes previously applied but also contained in the selected ESU.
-
Select the SARs Related option to view all SARs in the selected ESU containing text changes for UDCs and glossaries.
7.4 JD Edwards EnterpriseOne FDA Compare
This section contains the following topics:
7.4.1 Understanding FDA Compare
The FDA Compare tool in Oracle's JD Edwards EnterpriseOne Form Design Aid (FDA) enables you to compare one version of an application to another. You can compare them on the application level to determine whether forms have been added, deleted, or rearranged and whether the properties have changed. You also can compare the forms in the applications to each other to see whether controls have been added, deleted, or rearranged and whether the properties have changed.
Additionally, you can compare two different applications as well. This feature is useful when you have made a new application by copying an existing one and then modifying it. Then, when you upgrade, you can not only compare the base application to its new counterpart, but also you can compare a custom application.
While working with the target object, you can use all FDA functions except creating new forms. While comparing, you can change the target object to match the source object. If an object exists in the source but not in the target, you can copy it to the target. If an object exists in both but is different in some way, you can merge the specifications from the source to the target to make them identical.
As a software developer, you might use FDA Compare as the final step before checking in the changes to ensure that you made all of the changes you intended to make. In this way, you can also make sure that you did not move a control or make a property change unintentionally.
As an administrator, you might use FDA Compare to see the changes between a software update and the pristine or current implementation. If you have performed a number of customized modifications, you can more carefully implement the software changes without fear of ruining the customization.
7.4.2 Understanding the FDA Compare Color Scheme
FDA Compare uses colors and letters to highlight the differences between the source and target objects. This table lists the default colors and their meanings:
| Color | Meaning |
|---|---|
| Black | The object exists in both the source and target and is the same in both versions. |
| Red | The object exists in both the source and target but is not the same in both versions. |
| Green | The object exists only in the target. |
| Blue | The object exists only in the source. |
In the form workspace, the controls that differ between the versions are marked with a symbol in a color indicating the type of change. When you click a control, the browsers highlight the changes in specific property values with the same color coding. To change the color scheme, select View, User Options.
Note:
Nodes in the Application Tree View browser appear in a color if one or more of their children are different. Therefore, while the node itself may not be different, you will find that an object is different when you navigate deeper into the tree.7.4.3 Using FDA Compare
This section discusses how to merge specifications using FDA Compare.
7.4.3.1 Forms Used To Use FDA Compare
| Form Name | FormID | Navigation | Usage |
|---|---|---|---|
| Select Source Object | NA | Form Design Aid, File, Compare Mode | Enable or disable compare mode (toggle). When you enable compare mode, the system prompts you to identify the application that you want to use as the basis for the comparison. |
7.4.3.2 Merging Specifications Using FDA Compare
To merge specifications using FDA Compare:
-
In FDA, open the target application.
This is the application that you have been working on or that your company uses. It is the version of the application that you might want to change when you compare it to the source, which is a base version of the application.
-
Select a source application (the one to use as the basis for the comparison).
-
To change the view properties in the source or target property browser, select one of these options from the drop-down menu at the bottom of the pane:
-
All
Displays all the properties and values in alphabetic order for the object including the translation properties.
-
Standard
Displays only the standard properties in alphabetic order.
-
Translation
Displays only the translation properties in alphabetic order.
-
-
Compare the source application properties (on the left) to the local target properties (on the right).
-
To merge properties from the source object to the target object, right-click in the property source property browser and select Merge to Target from the menu.
7.5 JD Edwards EnterpriseOne ER Compare
This section contains the following topics:
JD Edwards ER Compare provides a detailed, on-screen comparison of event rules. You can change the target object (your local version) within the utility by moving lines directly from the source. You can also remove or disable lines. In addition to providing an on-screen comparison, you can select to print a report detailing the changes as well.
7.5.1 Using JD Edwards ER Compare for Applications and Event Rules
This section provides an overview of the JD Edwards ER Compare user interface and discusses how to start JD Edwards ER Compare.
7.5.1.1 Understanding the JD Edwards ER Compare User Interface
JD Edwards ER Compare is a utility that enables you to compare an application on the local workstation (target application) to the source applications defined in:
-
The central objects data source of any defined path code.
-
A TAM specifications directory.
-
An ESU backup.
You can compare applications, reports, table conversions (TC), business functions (BSFN), table event rules (TER), and business services (BSSVs) using the ER Compare User Interface.
Figure 7-2 Select Target Object (9.1 Update 4)
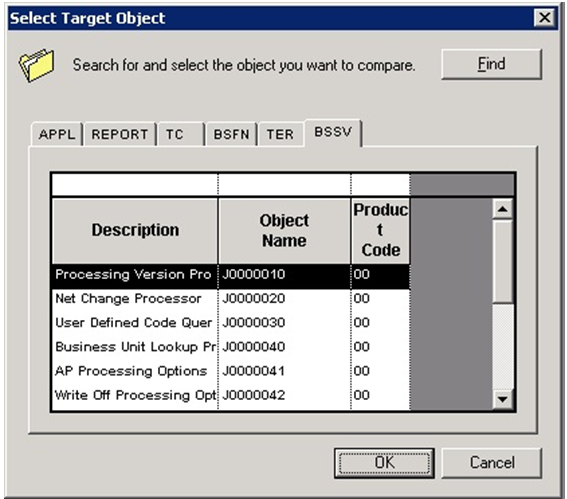
Description of "Figure 7-2 Select Target Object (9.1 Update 4)"
When you start JD Edwards ER Compare, a tree-structured outline of the application appears on the left. You can change source locations with the Select Source command under the File menu.
Expand an event node in the tree to display a split window that shows the source ER on the left and corresponding target ER on the right. The ER on the right belongs to your local specifications.
The program indicates differences in color, while identical lines are normally displayed in black. Disabled lines are marked with an exclamation point. You can customize the color coding by selecting the Set Colors command from the View menu.
JD Edwards ER Compare normally displays ID numbers and technical details about the currently selected item in two small windows on the status bar. The window on the left annotates the source specification while the window on the right annotates the target specification. This information is superfluous in most cases, and can be deactivated with the Show Object IDs switch under the View menu.
The tool lets you compare a modified application to the original version of that application on the server. JD Edwards ER Compare provides a side-by-side, visual comparison of the event rules for the two applications. Moreover, JD Edwards ER Compare enables you to modify the target ER (your local version) by copying lines directly from the source application. You can also move, remove, and disable ER lines in the target application. To copy all eligible lines in the current event from source to target, use the Copy All command. To copy all eligible lines in every event from source to target, use the Auto Merge Application command in the Edit menu.
To refresh the comparison, click the Refresh button. A warning message saying 'the source and target specifications are about to refresh, any unsaved changes will be lost' is displayed when you click the refresh button. You can click OK or Cancel as required. (9.1 Update 4)
To validate your changes before saving, select the Validate Event Rules command from the File menu. A validation will automatically occur before you exit the tool if you have saved changes.
7.5.1.2 Starting JD Edwards ER Compare
JD Edwards ER Compare can be started from FDA or directly from OMW.
When JD Edwards ER Compare starts, a window appears. On this window, entitled Select the Location of Source Specifications, select one of these locations:
-
Central Objects Path Code
Enter the server location of the source object (the object to which you want to compare the local ER).
-
Remote Specifications Location
Enter the TAM location of the source object (the object to which you want to compare the local ER). ESUs are delivered in a TAM package, so use this method to compare the local ER to an object packaged in an ESU.
-
Software Update Backup
After applying a software update, use this tool to retrofit custom ER from the customized copy on the ESU backup.
Note:
Starting JD Edwards ER Compare under FDA freezes all other programs running on your system, including FDA itself. Finish your work in JD Edwards ER Compare and then exit ER Compare to restore normal operation. The purpose of this action is to prevent two programs from potentially modifying the same set of specifications at the same time.7.5.2 Working with JD Edwards ER Compare
Use the application tree view to identify and display specific application and ER components that have changed. If a parent node is identified as having changed, expand it to see which of its children are different. Expand an event in the tree structure to display its associated code. You can display more than one event at a time.
You can change the target ER with JD Edwards ER Compare. You can also print the ER.
7.5.2.1 Changing the Target ER
Perform any of these actions to change the target ER:
| Task | Details |
|---|---|
| To copy selected lines from source to target | Select the lines to copy and then select Copy Right. |
| To copy all lines in the current event | See Merging ER in a Single Event. |
| To copy all lines in the application | See Merging ER in the Entire Application. |
| To delete selected lines from the target | Select the lines to delete, and then click Delete. |
| To enable or disable selected lines in the target | Select the lines to enable or disable, and then select Enable/Disable ER. |
| To undo the previous command | Select Undo. |
| To redo the previous command | Select Redo. |
| To reload the last saved version of the specifications | Select Refresh. |
Each command is available from the Edit menu and tool bar.
Note:
Use the Shift key to select multiple, contiguous lines and the Ctrl key to select multiple, noncontiguous lines.When you are copying ER, JD Edwards ER Compare checks ER variable references before copying and automatically fixes nonmatching variable IDs. Not only does JD Edwards ER Compare perform validity checking on ER variables, which are present in almost every ER statement, but it also does many other types of validity checking.
Caution:
Although JD Edwards ER Compare provides validity checking, which eliminates the largest source of invalid ER, you must still be vigilant when using JD Edwards ER Compare. When JD Edwards ER Compare copies ER statements, it does not check all of the object references in those statements. If the ER statements reference objects that do not exist in the target specifications or objects that have different IDs in the source and target specifications, JD Edwards ER Compare may allow the copy operation, which results in invalid ER. Different control IDs are very common for controls or objects that were not in the base version of the application. Controls that were added at separate times to separate versions of the application usually have different control IDs.When you save changes, your local application specifications are updated. JD Edwards ER Compare prompts you to save before either of these operations:
-
Exit
-
Select new source location
7.5.2.2 Printing
You can use the Print command to place a copy of the target ER in a text file. JD Edwards ER Compare will generate the text file and open it in your default text editor. You can then print the ER from the text editor.
7.5.2.3 Merging ER in a Single Event
The Copy All command copies ER lines from the source to the target, but only within the currently displayed event. The command will not delete lines from target ER if they do not exist in the source location. The command also does not necessarily copy all lines. It does not copy lines that would produce any of these types of invalid ER:
-
Duplicate variables.
-
Unbalanced IF and ENDIF statements.
-
Unbalanced WHILE and ENDWHILE statements.
-
Statements referencing an ER variable that is not defined in the target application.
-
Statements referencing an ER variable that is defined differently in the target application.
7.5.2.4 Merging ER in the Entire Application
The Auto Merge Application command resides under the Edit menu. It lets you copy ER lines from all events in the source application to the corresponding events in the target application. It works like the Copy All command, but it works on all events at once. The command will not delete lines from target ER that do not exist in the source location. The command also attempts to avoid copying lines that would result in invalid ER.
As with any JD Edwards ER Compare command, you might create invalid ER by using the Auto Merge Application command. As of version 8.98, JD Edwards ER Compare attempts to protect you from this by disabling unsafe operations. For example, JD Edwards ER Compare prevents the accidental creation of references to undefined ER variables. However, it does not recognize references to other kinds of undefined objects. Follow the steps recommended earlier to ensure that your ER remains valid.
Regardless of how you modify the ER, you should validate event rules prior to saving. This command is found under the File menu. If any ER violations occur, delete the offending lines and use Edit Event Rules to reenter them after you have exited JD Edwards ER Compare.
7.6 Customization Object Analyzer
This section contains the following topics:
-
Section 7.6.5, "Import and Configure Reports and Data Models"
-
Section 7.6.6, "Object Customization Summary Interactive Report"
-
Section 7.6.7, "Object Customization Detail Interactive Report"
-
Section 7.6.8, "Pathcode Comparison Summary Interactive Report"
-
Section 7.6.9, "Pathcode Comparison Detail Interactive Report"
If you are on an older release of JD Edwards EnterpriseOne, you need to identify customizations in order to determine the impact and level of effort to retrofit the customizations into the newer release of JD Edwards EnterpriseOne. This utility helps to identify the customizations in order to determine the impact and level of effort to retrofit the customizations into the newer release of JD Edwards EnterpriseOne.
A review of this information, prior to performing modifications within the software, allows for a smoother and more predictable upgrade of the EnterpriseOne software. This section details the impact of an upgrade of the EnterpriseOne software on custom objects and custom modifications to standard EnterpriseOne objects.
The Customization Object Analyzer is comprised of a UBE that loads a table and UBEs that read from that table to create either a summary or detailed report. The UBEs are:
-
R9840DL (Object Dataload) loads the F98881CU table in a parent-child hierarchy of object changes with a list of all JD Edwards EnterpriseOne customized objects.
-
R9840RLS (Release Level Object Dataload) - This Data Load UBE takes the Cross Release Pathcodes as input from User from the Processing Options. The Input from the Processing Option can be selected from the Visual Assist. Once the Cross Release Pathcodes are selected and the UBE is submitted to execute, this UBE will load the data into F98881CU table in a parent-child hierarchy of object changes with a list of all JD Edwards EnterpriseOne customized objects.
-
RD9840RS (Object Customization Summary Report - BI Publisher) creates a summary report from the data in the F98881CU table.
-
RD9840RD (Object Customization Detail Report - BI Publisher) creates a detail report from data in the F98881CU table that shows the details of the customizations grouped by various criteria.
-
R9840R (Object Customization Summary and Detail Report - Standard Version) creates a summary and detail report from the data in the F98881CU table.
-
R9840R|ZJDE0005 (Object Customization Summary Version) creates a summary report on all of the objects from the data in the F98881CU table. This Summary report can be used to compare the Customized objects across pathcodes.
-
R9840R|ZJDE0006 (Object Customization Detail Version) creates a Detail report on all of the objects from the data in the F98881CU table when executed without Dataselection. This version can also be run with Data Selection to get the Detail report on selected objects.
-
R9840R|ZJDE0007 (Object Customization Summary Version By Pathcode) - This version takes two pathcodes as input from processing Options and will generate a Summary report only for the selected Pathcodes from Processing Options. This Summary report can be used to compare the Customized objects across pathcodes.
Note:
For the pathcodes which will be entered in the Processing Options in the R9840R|ZJDE0007 summary report, data should be loaded for those pathcodes using the DataLoad UBE.
Note:
JD Edwards provides the RD9840RS and RD9840RD report definitions and report templates to produce the summary and detail reports using the JD Edwards EnterpriseOne embedded BI Publisher. BI Publisher reports are only available for E812 and later releases.For information about the embedded BI Publisher, see ”Introduction to BI Publisher for JD Edwards EnterpriseOne” in the JD Edwards EnterpriseOne Tools BI Publisher for JD Edwards EnterpriseOne Guide.
Objects Captured and Not Captured for Customizations
Currently the APPL, UBE, BSFN, DSTR, BSVW, TBLE object types are captured and all other types of objects are not captured. This table lists what specifically is and is not captured within these object types:
| Object Type | Captured | Not Captured |
|---|---|---|
| APPL | For applications, the details about the Form Events, Control Events, Grid Column events, Controls and Grid Columns that are added or changed.
New objects list all the details, even the hidden items like columns, controls and events. |
Event Rule changes.
Changes in BSFN call from an application, like BSFN parameter changes. |
| UBE | In UBE templates, changes related to Section Events and Control Events that are newly added or changed.
New objects list all the details, even the hidden items like columns, controls and sections. |
Event Rule changes. |
| UBE Versions | Changes related to section events, newly added controls, Control Event changes and Version Overrides. | Event Rule changes. |
| BSFN | Newly added business functions and the BSFN name and function name that are added. | Changes to the C code.
BSFN Parameter changes. |
| DSTR | Only the data structure name and description. | Internal details of the DSTR variable that are added or changed, but the report displays that the data structure has changed. |
| BSVW | Only the business view name and description. | Internal details of business view changes, but the report displays that the business view has changed. |
| TBLE | Existing table new column additions, Indexes and Table Events. | Event Rule changes. |
7.6.1 Object Dataload
EnterpriseOne records when an object is created or modified (an object is considered modified when it is checked in, regardless of whether or not changes were made). This customization information is loaded into the F98881CU table by using the R9840DL UBE. A processing option value needs to be set prior to running this UBE.
Note:
R9840DL will typically be run by the administrator.7.6.1.1 Processing Options
The following processing options enable you to specify the processing for the data load:
-
Enter 0 or Blank to load the data according to data selection without deleting the other existing records where load will occur after deletion based on data selection.
-
Enter 1 to delete all of the existing records from the F98881CU table and load the data still based on data selection.
Note:
Setting the processing option value to 1 means that you want to clean up all of the loaded data and reload it with the default data selection or data selection based on the user 's needs.7.6.1.2 Data Selection Options
Users running this UBE need to identify the objects that were added or existing objects that have been changed. The default ZJDE0001 version that is shipped with the template R9840DL is set with the default data selection. This data selection loads the F98881CU table with all of the object types for all path codes into the F98881CU table.
7.6.2 Release Level Dataload
EnterpriseOne records when an object is created or modified (an object is considered modified when it is checked in, regardless of whether or not changes were made).
7.6.2.1 Prerequisite for Release Level Dataload
The following configuration must be done on the development client where the Release Level Dataload UBE will execute:
-
The F00941 table should contain the entries for the Source and Target pathcodes providing all the information regarding the Environment, Pathcode, Release, etc. for which the USER wants to run the Release level Data load UBE.
For example, if the USER wants to run the Release Level Dataload for pathcodes DV900 and DV910, the F00941 table should contain entries for the DV900 and DV910 pathcodes with their corresponding Environments and Releases.
If the entry for the Source and Target pathcode with their corresponding Environment and Release is not available, then it can be created using the P0094 application.
The following screenshots show examples from the F00941 table displaying the entries for the DV910 and DV900 Pathcodes.
-
The Environments of the Source and Target Pathcodes from the F00941 table should have the entries for the following tables with their corresponding Datasources in OCM, in system and Server Map Datasource:
-
F9860
-
F9861
-
F9862
-
F00941
-
F9202
-
F983051
-
The following screenshots display the DV900WIN and DV910WN environments with the tables and their corresponding datasource mappings and Object Status.
7.6.2.1.1 Processing Options
This Data Load UBE takes the Cross Release Pathcodes as input from User from the Processing Options. The input from the Processing Option can be selected from the Visual Assist. Once the Cross Release Pathcodes are selected and a UBE is submitted to execute, this UBE will then load the customized data into F98881CU table.
A Processing Option value needs to be set prior to running this UBE.
Note:
R9840RLS will typically be run by the administrator.Release Level Data Load Database Specific Prerequisites:
For Oracle Database:
TNSNAMES.ORA should be manually updated with SID of source and target pathcodes.
For example, if a customer is running the release level data load for DV900 and DV910 pathcodes, make sure the TNSNAMES.ORA file is updated with the SID of both the databases of E9.0 and E9.1.
For Other Databases:
Please make sure that the Data Sources of the Source and Target Pathcodes are created in odbcad32 for the following tables:
-
F9860
-
F9861
-
F9862
-
F00941
-
F9202
-
F983051
7.6.2.2 Processing Options
The following processing options enable you to specify the processing for the data load.
Enter the Source and Target Pathcodes of Different Releases to load the customized data of these Pathcodes into the F98881CU table. Pathcodes can be selected from Visual Assist.
-
Enter 0 or Blank to load the data according to data selection without deleting the other existing records where load will occur after deletion based on data selection.
-
Enter 1 to delete all of the existing records from the F98881CU table and load the data still based on data selection.
Note:
Setting the processing option value to 1 means that you want to clean up all of the loaded data and reload it with the default data selection or data selection based on the user's needs.7.6.3 Object Customization Summary Report
RD9840RS (BI Publisher version) and R8940R (Standard Version) are read-only reports that print the information available in the F98881CU table in a usable format.
This report should be run only after running UBE R9840DL, which loads the F98881CU table. Since the RD9840RS and R9840R reports are based on what is loaded in F98881CU via R9840DL, you need to ensure that table F98881CU has been loaded with what you expect to see in the RD9840RS or R9840R report.
Running the R9840R|ZJDE0005 Object Customization Summary Report
To run the R9840R Object Customization Report:
-
Fast Path to P95620.
-
Provide R9840R in Source UBE and click on Find.
-
Select ZJDE0005.
-
Click on Submit.
Running the R9840R|ZJDE0006 Object Customization Detail Report
To run the R9840R Object Customization Report:
-
Fast Path to P95620.
-
Provide R9840R in Source UBE and click on Find.
-
Select ZJDE0006.
-
Click Submit.
-
Provide Data Selection if Detail report is required for selected objects, else run this version without any Data selection which will give the Output for all the objects in F98881CU table.
Running the R9840R|ZJDE0007 Object Customization Summary Report by Pathcode
To run the R9840R Object Customization Report:
-
Fast Path to P95620.
-
Provide R9840R in Source UBE and click on Find.
-
Select ZJDE0007.
-
Click Submit.
-
Provide the Source and Target pathcode in Processing Options. Summary report will be generated only for the provided Source and Target pathcode.
7.6.3.1 Customizations Summary
The Customizations Summary gives an overview of the impact of customizations to the system, and provides information to estimate the level of effort needed to retrofit the customizations. This summary sees the system as a whole (all of the data in F98881CU) and is not affected by any data selections the user provides before the run.
Note:
The quickest way to extract a Summary ONLY report in RD9840RS and the R9840R standard UBE is to give an invalid data selection so that no data is selected. This is shipped with a default invalid data selection.The Customizations Summary section contains the following:
7.6.2.1.1 Customizations Summary Statement
The Customizations Summary statement contains embedded values (xx) within a sentence. The sentence reads:
System has xx customized objects impacting xx Product Codes.
The Customizations Summary statement section contains the following:
| Column Heading | Description |
|---|---|
| System has xx | Refers to the unique count of objects that have been customized. |
| customized objects impacting | These objects could exist in multiple pathcodes and may have many versions. |
| xx product codes. | This shows the unique count of all Product Codes affected across all pathcodes. |
This section shows all pathcodes affected by customizations and shows the number of objects affected in each pathcode. Remember that the same object might have been customized in multiple pathcodes. Thus, the sum of objects impacted by pathcode might not be equal to the total number of objects customized. The information is presented in horizontal bar chart and table format (RD9840RS) and table format (R9840R).
The Summary by Pathcode section has these columns:
| Column Heading | Description |
|---|---|
| Pathcodes | Shows all pathcodes affected by customizations. |
| Number of Objects | Shows number of objects affected in each pathcode. |
7.6.2.1.3 Summary by Object Type
This section shows all object types affected by customizations and shows the number of objects affected for each object type. The summary lists only object types that were affected and not necessarily all EnterpriseOne object types. The information is presented in pie chart format and table format (RD9840RS) and table format (R9840R).
The Summary by Object Type section has these columns:
| Column Heading | Description |
|---|---|
| Object Type | Shows all Object Types affected by customizations. |
| Number of Objects | Shows number of objects affected for each Object Type. |
7.6.2.1.4 Summary by Product Code
This section shows all Product Codes affected by customizations and shows the number of objects affected for each Product Code. The information is presented in horizontal bar chart format and table format (RD9840RS) and table format (R9840R).
The Summary by Product Code section has these columns:
| Column Heading | Description |
|---|---|
| Product Code | Shows all Product Codes affected by customizations. |
| Product Code Description | Shows description of each product code. |
| Number of Objects | Shows number of objects affected for each Product Code. |
This section shows information for the different types of objects affected by customizations. If the same object was customized in multiple pathcodes, the object is listed twice; one time for each path code it was customized in. This section does not list versions for objects.
The object list has these columns for each object type:
| Column Heading | Description |
|---|---|
| Product Code | Shows all Product Codes affected by customizations. |
| Pathcode | Shows pathcodes affected by customizations. |
| Object Name | Shows application affected by customizations. |
| Object Description | Provides a description of the object. |
7.6.3.2 Customizations Summary R9840R ZJDE0005, ZJDE0007
This Summary report can be used to compare the Customized objects across pathcodes. The sample screenshot below shows the Summary report from ZJDE0005, ZJDE0007.
We can see that P0006 is modified in both the pathcodes. It has 1 as a flag under DV910 and PD910, which says object is modified in both the pathcodes.
-
1 signifies Object changed.
-
0 signifies Object not changed.
P01012 is changed in DV910 and not changed in PD910.
7.6.4 Object Customization Detail Report
The Customization Detail Report is impacted by data selection. You may choose to see the objects along with customizations details by data selecting on the following criteria: Path Code, Object Name, Object Type and Product Code. Any other data selection might return unexpected results. A new page is created for each object and its version (if applicable for UBEs). The change details are printed until all are listed.
7.6.4.1 RD9840RD - BI Publisher Report Version
The Customization Detail Report section in RD9840RD has up to five levels of line items. Each level will be indented relative to the previous line level.
| Line Item | Description |
|---|---|
| Object Type | Type of object. |
| Pathcode + Product Code | Shows the pathcode for the Object Type.
Shows the Product Code for the Object Type. |
| Object Name | Shows the Object Name and version. |
Running the RD9840RD Detail Report
To run the RD9840RD Object Customization Detail Report:
-
From the Software Compare Tools (GH96111) menu, select Object Customization Detail.
-
Enter the values for the data selection.
-
Click Submit.
7.6.4.2 R9840R - Standard Report Version
The Customization Detail section in R9840R has these columns:
| Column Heading | Description |
|---|---|
| Object Type | Type of object. |
| Product Code | Shows all Product Codes affected by customizations. |
| Pathcode | Shows pathcodes affected by customizations. |
| Object Name | Shows application affected by customizations. |
| Object Description | Provides a description of the object. |
The objects are listed by Object Type. The details are shown in a parent child hierarchy where the top-most parent is the object, followed by 3 children for each change. The 3 children are listed in Child Component 1, Child Component 2, and Child Component 3 order. Each line in the detail identifies one unique change at the lowest level child for that line.
Running the R9840R Detail Report
To run the R9840R Object Customization Detail Report:
-
Navigate to Batch Versions.
-
Select R9840R.
-
Enter the values for the data selection.
-
Click Submit.
7.6.5 Import and Configure Reports and Data Models
In order to use interactive reports, Oracle BI Publisher and the JD Edwards EnterpriseOne Data Access Driver need to be installed, and then Interactive reports and data models need to be imported from the Oracle Update Center and then configured.
7.6.5.1 Installing Oracle BI Publisher and the Data Access Driver
To install Oracle Business Intelligence Enterprise edition (OBIEE) 11g, see: Oracle® Fusion Middleware Installation Guide for Oracle Business Intelligence 11g Release 1 (11.1.1.5).
To install the JD Edwards EnterpriseOne Data Access Driver, see: JD Edwards EnterpriseOne Tools BI Publisher for JD Edwards EnterpriseOne Guide.
7.6.5.2 Importing Interactive Reports and Data Models
Interactive reports and data models need to be imported from the Oracle Update Center and then configured.
To download reports and data models from the Oracle Update Center:
-
Go to the Oracle Update Center.
https://updatecenter.oracle.com/apps/WebSearch/updatecenter.jsp?action=news&pkgType=06&
-
Select the data model files (.xdmz) and report files (.xdoz) that you want to import.
-
Once you have imported the files, upload the data model files (.xdmz) and report files (.xdoz) to Target Instance.
To upload the data model file (.xdmz file):
-
Click on Catalog on the toolbar.
-
Select any folder where you want to upload this file.
-
Click on Upload in the Tasks window.
-
Click the Browse button to find the .xdmz file which you copied from target machine.
-
After uploading, it will show the data model in that folder. Click on the Edit hyperlink and select a correct data source and save the data model.
To upload the report file (.xdoz file):
-
Click on Catalog on the toolbar.
-
Select the same folder where you saved the data model.
-
Click on Upload in the Tasks window.
-
Browse the .xdoz file which you copied from target machine.
-
After uploading, click on the Edit hyperlink for the report name to open the report in edit mode.
-
If there is an associated Data Model, it will display next to Data Model in the top left corner under the tab title. If the correct one is not displayed, or if the one displayed is in red letters, then re-associate the interactive report with appropriate data model by clicking on the Magnifying Glass on the toolbar, then selecting the correct data model, then click Open, and then click Save.
The associations are:
Report Data Model Object Customization Summary
F98881CU_SUMMARY_DM
Object Customization Detail
F98881CU_DETAIL_DM
Pathcode Comparison Summary
F98881CU_PATHCOMP_SU_DM
Pathcode Comparison Detail
F98881CU_DE_DM
Once the data model is associated, it will display on the toolbar in blue letters.
-
Click on View Report on the toolbar to run the report.
-
7.6.6 Object Customization Summary Interactive Report
The Object Customization Summary Interactive Report consists of three tabs:
-
Summary by Object Type
-
Summary by Product Code
-
Object List
7.6.6.1 Summary by Object Type tab
The Summary by Object Type tab will display a pie chart that shows the distribution of the object types affected. The first line of the report has a clickable list of pathcodes affected. Clicking on a pathcode will interactively filter the Object Types to show the summary for that pathcode only.
The Object Types available for selection are:
-
Application
-
Batch Application
-
Business Functions
-
Business View
-
Data Structure
-
Table
The Number of Objects table displays the number of object types affected for the selected pathcode or for all pathcodes.
The Object Type Vs Pathcode comparison table is available which tells the impact of each object type in each pathcode.
The interactive report can be viewed in different formats. In View Report mode, select the View Report icon on the tab toolbar and select a viewing option:
-
Interactive
-
HTML
-
PDF (recommended output type)
-
RTF
-
Excel
-
PowerPoint
7.6.6.2 Summary by Product Code tab
The Summary by Product Code tab displays a horizontal bar graph that lists the product codes affected. The first line of the report has a clickable list of pathcodes affected. Clicking on a pathcode will interactively filter the Product Codes to show the summary for that pathcode only.
The Number of Objects table lists the number of objects affected for each product code.
The Product Code Vs Pathcode comparison table is also available at the bottom of the page for cross analysis of object types and pathcodes. The table will display the number of objects per pathcode for each product code.
The interactive report can be viewed in different formats. In View Report mode, select the View Report icon on the tab toolbar and select a viewing option:
-
Interactive
-
HTML
-
PDF (recommended output type)
-
RTF
-
Excel
-
PowerPoint
7.6.6.3 Object List tab
The object list tab has a summary statement that contains embedded values (xx) within a sentence. The sentence reads:
System has xx customized objects impacting xx Product Codes.
The object list statement section contains the following:
| Column Heading | Description |
|---|---|
| System has xx | Refers to the unique count of objects that have been customized. |
| customized objects impacting | These objects could exist in multiple pathcodes and may have many versions. |
| xx product codes. | This shows the unique count of all Product Codes affected across all pathcodes. |
The Pathcodes Affected section has a list of pathcodes which can be clicked on to filter the report data to that pathcode only.
The Object Types Affected section has a list of object types which can be clicked on to filter the data shown on the report. It can also be clicked in combination with any other filters available on the page.
A table presents all of the objects affected by customizations (the list will be affected by any filters in effect). The table displays:
-
Object Type
-
Pathcode
-
Product Code
-
Object Name
-
Object Description
7.6.7 Object Customization Detail Interactive Report
The Object Customization Detail Interactive Report has a Pathcode and Product Code filter on the header which determines which detail information is shown on the page.
After selecting the Pathcode and Product Code, click on Apply to display the details for that combination in the report. Desired objects can be chosen from the Object Name field using the drop down menu. Change details for that object will be listed in a parent child relationship for up to three children.
The interactive report can be viewed in different formats. In View Report mode, select the View Report icon on the tab toolbar and select a viewing option:
-
Interactive
-
HTML
-
PDF (recommended output type)
-
RTF
-
Excel
-
PowerPoint
7.6.8 Pathcode Comparison Summary Interactive Report
The Pathcode Comparison Summary Interactive Report compares two pathcodes for the selected product code. The pathcodes and Product Code are selected at the top of the page. Once the selections are applied, an object list comparing the existence of the object in the chosen pathcodes is displayed along with the total number of instances of the objects.
The interactive report can be viewed in different formats. In View Report mode, select the View Report icon on the tab toolbar and select a viewing option:
-
Interactive
-
HTML
-
PDF (recommended output type)
-
RTF
-
Excel
-
PowerPoint
7.6.9 Pathcode Comparison Detail Interactive Report
The Pathcode Comparison Detail Interactive Report compares two pathcodes for the selected product code. The pathcodes and Product Code are selected at the top of the page. Once the selections are applied, the user can choose the object he is interested in using the Object Name field drop down object list. Once the object is selected, the detail is shown in table format in a parent child hierarchy with changes displayed for up to three children. The changes in the two pathcodes are grouped at the left showing the changes in each pathcode.
The interactive report can be viewed in different formats. In View Report mode, select the View Report icon on the tab toolbar and select a viewing option:
-
Interactive
-
HTML
-
PDF (recommended output type)
-
RTF
-
Excel
-
PowerPoint
7.6.10 Pathcode Comparison Summary Report
The Pathcode Comparison Summary Report can be accessed by executing the XJDE0005 version of R9840R using Batch Versions (BV). It can also be accessed from the GH96111 menu. No data selection is allowed for this report. An invalid data selection is included by default for this version.
The report output is presented in table format. The pathcodes will be listed as column headings horizontally across the table. The object type will be listed vertically in the left column. The table cell where the object type and pathcode intersect displays the number of instances of the object in each pathcode. A sum of all instances of the object in pathcodes is also available.
Note:
The Pathcode Comparison Summary Report is available with Bug# 14767497.7.6.11 Pathcode Comparison Detail Report
The Pathcode Comparison Detail Report can be accessed by executing the XJDE0006 version of R9840R using Batch Versions (BV). It can also be accessed from the GH96111 menu. This report needs a mandatory data selection for up to 3 pathcodes. The user may add further data selection based on his preference of object type, product code and object name.
This report shows a linear comparison of customizations between pathcodes in a format similar to the regular Object Customization detail report. Each section will report on an object within a pathcode. The first line in the section will display the object type and the associated pathcode. The second line will display a description of the object type. The third line will display the product code. The lines following will display details that are relevant to the object type.
Note:
The Pathcode Comparison Detail Report is available with Bug# 14767497.7.6.12 Troubleshooting Information and Tips
Object customizations are captured based on the SIMRGMOD flag in the F9861 table for each pathcode. A check-out and check-in of an object in OMW flags this column as changed even if the object does not have any changes.
When a new object is created or copied, the flag is set to A. When the R9840DL is run with data selection for this object, it is normal for the R9840DL to display the Object Customizations data load failed and No Data selected messages.
The R9840DL/ZJDE0001 version is shipped with a default data selection which captures all objects that are added or changed. Any other data selection additions should be added to this default data selection.
If the object has been changed but does not appear in the reports, the issue could be that the object is not checked in. The object must be checked in for the changes to be captured. The SISTCE column set to 1 in F9861 indicates that the object is checked in.
The original UBE template must be checked in for the UBE Version changes or override changes to be reflected in the report.
Changes for object types BSFN, DSTR and BSVW are shown in the Summary report and not in the Detail report.
If for some reason the R9840DL UBE fails to run on the server, you can run this UBE locally from a development client, which should capture the same data.
The R9840R|ZDE0006 version which prints the detail report will fail when the F98881CU data load has a huge amount of data. This issue is fixed in Bug 17195573 in the 9.1.4 Tools Release.