 Pivot Grid Terms
Pivot Grid terms.
High-level overview and flow diagram for Pivot Grid.
Pivot Grid components
Pivot Grid security.
Limitations of PeopleSoft Chart and PeopleSoft Pivot Grid.
Pivot Grid TermsThis section defines terminology that is specific to Pivot Grid.
|
Axis and Values are at the core of analytical and operational reporting.
For example, in an expense report scenario, incurred expenses is the Value; whereas attributes such as Employee, Department, Business Unit, and Expense Type, the expense qualifiers, form the Axis members. In a scenario showing Product Sales, Actual Sales, Number of Units Sold, and Cost of Each Unit, these items could be Values; whereas attributes such as Region, Product Name, and Date Range for the sales, the Value qualifiers, would form the Axis members. In an organization chart, the Count of Employees could be a Value, and the axis members could be Departments, Job Codes, Pay Grade, and so on. |
|
|
Report filter |
Report filter determines the range of values that appears in the Pivot Grid and the chart. In SQL terms, report filter is similar to a WHERE clause that limits the data returned. In PeopleSoft Pivot Grid, report filter presents a slice of data to the user in both the chart and the Pivot Grid. If the PSQuery data source uses prompt values, they are automatically added as filters. Users can customize query prompt values when viewing the pivot grid. When you create a Pivot Grid model, you can select additional columns to use as filters. |
|
Aggregate functions |
Aggregate functions include SUM, MIN, MAX, AVG, and COUNT. |
|
Pivot Grid |
A Pure Internet Architecture component that provides a multidimensional presentation of data. |
|
Pivot |
A change of the dimensional orientation of a report inside Pivot Grid. |
|
Overlay |
Two charts with the same X axis but different Y axes that are plotted and then one is superimposed over the other. |
High-Level Overview and Flow Diagram for PeopleSoft Pivot GridPeopleSoft Pivot Grid provides the overall functionality of storing Pivot Grid metadata, generating queries at runtime, and rendering display for the pivot grid and chart. Pivot Grid uses PSQuery as the data source, with Pivot Grid grids and PeopleSoft charts as the visualization options. Pivot Grid can pivot and filter data, which enables business analysts to have different views of the same data. PeopleSoft charts provide different visual representation of the same data. If users select the display option Grid and Chart, the data in the chart is always a subset of the data in the grid, and the synchronization between the grid and the chart is unidirectional only. Users' actions on the grid change the chart visualization as well.
This section displays the high-level flow diagram for PeopleSoft Pivot Grid:
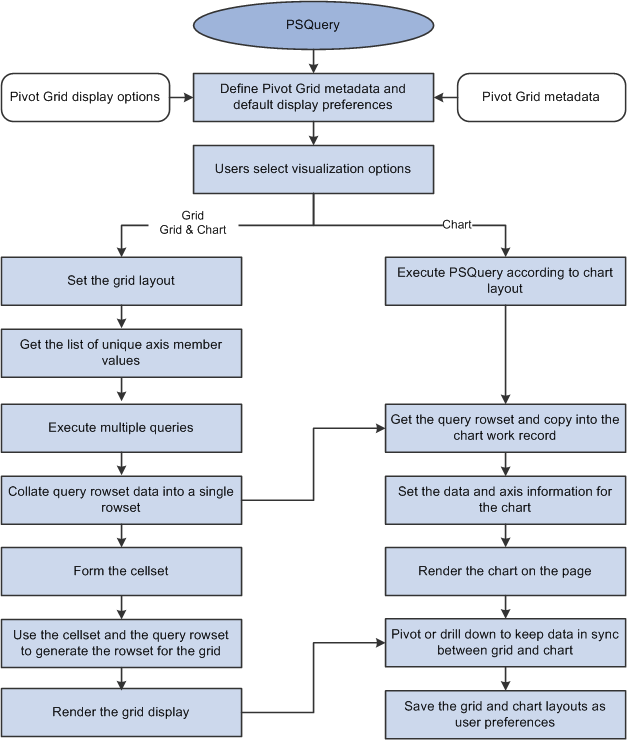
High-level flow diagram for PeopleSoft Pivot Grid
When using Pivot Grid, note that:
In PeopleTools 8.52, Pivot Grid supports only PSQuery as the data source.
All user actions on the Pivot Grid grid and the chart are driven through PSQuery. No data is cached for viewing. Every user action that requires fresh data will result in a new set of PSQuery modifications at runtime, and the ad hoc set of modified PSQuery is run against the database to fetch data.
Supported aggregate functions—MAX, MIN, COUNT, AVG, and SUM—are computed at database level, and the results appear in grids and charts. In addition, an All (Total) attribute can be defined for axis members that calculates subtotals based on the aggregate function defined for the Values.
Note. Only a single level of subtotal (that is, the innermost level)
is supported in PeopleTools 8.52.
If the Values are at the innermost level, then subtotal is also supported
for the axis immediately above the innermost Value level, as shown in this
example:
If users select the Grid and Chart display option, then the filtering operation on the grid (changing the report filter values) filters on the chart as well.
If an All attribute is defined for the axis members, then a drilldown operation on the grid indicates the user's action of clicking the + icon associated with the label.
If users select the Grid and Chart display option, then the drilldown operation on the grid drills down on the chart as well.
If users select the Chart Only display option, then the drilldown operation for a chart indicates the user's action of clicking the chart to display a detailed level of data.
Pivot Grid supports all PeopleSoft chart types that are related to bar, pie, and line charts.
Pivot Grid assigns one field from the Grid Row Axis to the X axis and one field from the column axis to the Y axis of the chart. In addition, you can select an overlay field and a data series (to display one level of drilldown) for the chart.
Note. If the display option is Chart Only, you are able to select the series and overlay values for the charts. If the display option is Grid and Chart, series values are automatically calculated based on the grid layout, but overlay are not supported.
For example, a query was built on a record that stores the number of product units sold and product sales for a set of regions and products by month:
|
Unit Cost |
Product Sales |
Region (Key) |
Product (Key) |
Month (Key) |
No. of Units Sold |
If Region were selected on the X axis and Product Sales were selected on the Y axis, then a user could select No. of Units Sold as an overlay field.
If No. of Units Sold were selected as an overlay field, then two separate charts would be plotted, one chart with Product Sales on the Y axis and the other with No. of Units Sold on the Y axis. One chart would be superimposed over the other chart. For overlay fields, the supported chart type is a Line Chart.
If Product were selected as a data series, then the chart would group the sales for each product for each region and then plot the data.
The synchronization between the chart and the grid is unidirectional and is always driven by a user action on the grid.
To support unidirectional synchronization between a chart and a grid, which is always driven by an action performed on the grid, the data in the chart must always be a subset of the data shown in the grid.
Logging is available; by enabling the log application, developers or customer developers can analyze errors or debug any products they build using this technology.
Pivot Grid ComponentsThis section provides an overview of Pivot Grid components and discusses:
Pivot Grid data source engine component.
Pivot Grid user interface component.
Grid-display component.
Chart-display component.
Pivot Grid Components Overview
Pivot Grid has these main components:
Pivot Grid Data Source Engine component.
This component is the back-end component of Pivot Grid. It provides the necessary framework support for runtime manipulation and generation of PSQueries to render the grid and chart display. This component also provides interfaces that can be used by the Pivot Grid User Interface component, the Grid-display component, and the Chart-display component to perform the required PSQuery manipulations for rendering the controls on the Pure Internet Architecture page.
Pivot Grid User Interface component.
You use this component to create and update Pivot Grid models using the Pivot Grid wizard, to view the Pivot Grid models in the Pivot Grid Viewer, and to create different views for the same Pivot Grid model.
Grid-display component.
This component is primarily responsible for rendering data in the Pivot Grid grids. Its functionality “understands” the current grid layout and invokes the interfaces of the Data Source Engine component to run queries. It also interprets various actions in the grid and subsequently invokes the engine component for running the PSQuery again.
Chart-display component.
This component is primarily responsible for rendering data in the Pivot Grid chart. Its functionality “understands” the current chart layout and invokes the interfaces of the Data Source Engine component to run queries. It also interprets various actions in the chart and subsequently invokes the engine component for running the PSQuery again.
Pivot Grid Data Source Engine Component
The Pivot Grid Data Source Engine component is responsible for runtime PSQuery manipulation to retrieve the data required for a grid and chart. Any events in the grid and chart will result in a PSQuery modification and its being rerun, which are handled by the data source engine. The Pivot Grid Data Source Engine component enables you to:
Set Pivot Grid metadata.
Pivot Grid metadata includes axis members, Value members, the All attribute for axis members, aggregate functions for Value members, and Pivot Grid viewing options.
Retrieve Pivot Grid metadata from the database.
Return a result set for a chart, a result set for a grid, unique values for axis members, and unique values for filters.
Pivot Grid User Interface Component
The Pivot Grid User Interface component enables you to create new Pivot Grid models and to update existing Pivot Grid models. This component is a step-by-step wizard with user-friendly mechanism for creating and updating Pivot Grid models. The last step of the wizard enables you to preview the models that you created.
You can define two parts of a Pivot Grid model using the Pivot Grid User Interface component:
Based on the PSQuery definition, this core defines which PSQuery columns and aggregation functions are used and which totals and subtotals appear. You cannot change the Pivot Grid core at runtime.
Pivot Grid model default view options.
This part displays the Pivot Grid model and defines the default values for the runtime prompts that are associated with PSQuery data source, grid and chart axis information, grid and chart display preferences, and so on. One set of default view options is associated with the Pivot Grid model whenever it is created. These view options are the preferences used to render the display when the Pivot Grid appears initially. You can customize the display and save your personalizations for the Pivot Grid model. These preferences take precedence when the system displays a Pivot Grid model for you.
The Pivot Grid Grid-display component is based on the existing PeopleSoft analytic grid. This component enables users to leverage the different functionality of the analytic grid, like multi-level display and the drag-and-drop operation. However, unlike the analytic grid, the grid in a Pivot Grid does not require the analytic server to run; it can function as a standalone Pure Internet Architecture component. As with the analytic grid, the grid in a Pivot Grid has three axes—row, column, and filter. You can place the axis and value members on any of these axes to provide different views of the same data.
The Grid-display component provides the following functionality:
Uses the Pivot Grid Data Source Engine interfaces to execute the PSQuery at runtime to render data in a grid. The grid does not cache any data. Any layout modification will result in a new PSQuery running to retrieve the data.
Note. Query modifications are not saved; Pivot Grid runs the query in an adhoc way to retrieve information.
Responses to users' filtering, pivoting, and drilldown actions from within the grid. Each of these actions will result in the PSQuery being modified and rerun to retrieve the rowsets again.
Exports the current slice of data visible in the grid to Microsoft Excel.
This diagram shows the process flow of the Grid-display component:
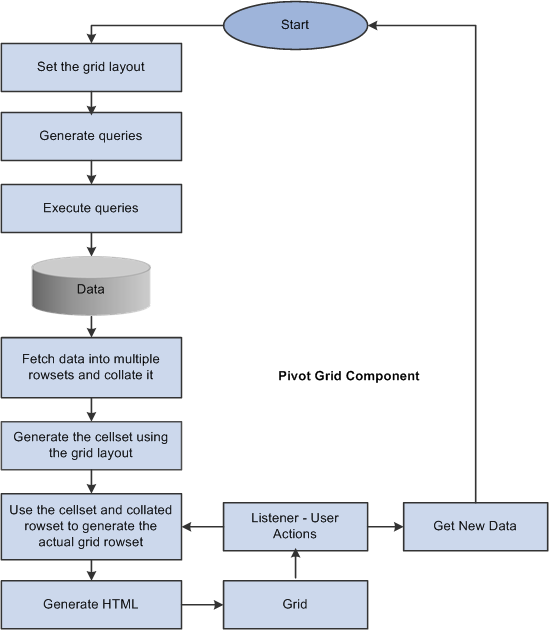
Process flow of the Grid-display component
The Pivot Grid Chart-display component also uses the Pivot Grid Data Source Engine component to retrieve PSQuery data. It provides the following functionality:
Invokes the Pivot Grid Data Source Engine interfaces to modify the PSQuery at runtime to retrieve data.
If the display option is chart only, a single PSQuery modification and run suffices for retrieving the relevant charting data; extra modifications are required to get filter values. If the display option is grid and chart, Pivot Grid uses the resultset that was retrieved while populating the grid for chart display.
Calls the appropriate PeopleCode charting APIs for generating and rendering the chart control on the page.
If the display option is chart only, users can drill down on the chart by clicking the data points of the chart to display details.
After drilling down, a drillout option is available as a locator link at the top of the chart. Clicking the drillout link restores the chart to its earlier state.
Note. In PeopleTools 8.52, the maximum number of drilldowns that you can perform on a chart is limited to four.
All the pivoting, drilldown, and filtering operations on the grid result in an appropriate synchronization action on the chart if the display option is grid and chart.
This diagram shows the processes of the Pivot Grid Chart-display component:
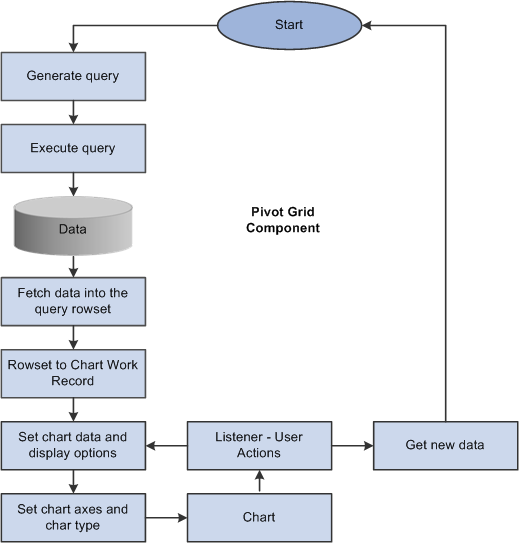
Process flow of the Chart-display component
Pivot Grid Security
Various layers of security are available for users who access Pivot Grid:
Query security is the first layer.
If a user has access to run and modify a query, that user can create a new Pivot Grid model or view an existing Pivot Grid model based on the selected query data source.
Pivot Grid model type security is the second layer.
Any Pivot Grid model can be published as a private or public model. Private Pivot Grid models are available only to the user or users who created the models. Public models are available to administrators and power users for updates.
Pivot Grid roles is the third layer.
Three primary roles are available for Pivot Grid users. PeopleSoft delivers the roles PivotGridAdmin and PivotGridSuperUser. Users not assigned to one of these roles will be Pivot Grid end users.
This section discusses:
Pivot Grid administrator role.
Pivot Grid super user role.
Pivot Grid end user role.
Users with the role PivotGridAdmin are granted access to:
Use the Pivot Grid wizard to create new Pivot Grid models or update existing Pivot Grid models.
Update and view all models that were created by all other users.
Define how a Pivot Grid will be viewed by end users by specifying the axes and values.
Select the aggregate functions for values and All members of the axes members.
Select the initial PSQuery prompt values for the PSQuery runtime prompts.
Define the initial view layout, which includes view options for the grid and the chart.
Publish the Pivot Grid models as public or private.
Define whether the selected model is valid.
Users with the role PivotGridSuperUser are granted access to:
Use the Pivot Grid wizard to create new models or update existing public Pivot Grid models.
For the models that are accessible to super users, the tasks are the same as for the Pivot Grid administrator.
View all public Pivot Grid models and perform pivoting, filtering, or dicing on the initial view to set their own user preferences.
Note. Users can save these preferences.
Users with the role Pivot Grid end user are granted access to:
Create new Pivot Grid models and publish them as public or private.
For models created by a Pivot Grid end user, the tasks are the same as for the Pivot Grid administrator.
Note. Pivot Grid end users cannot update Pivot Grid models created by other users.
View public Pivot Grid models that were created by other users and perform all operations on accessible models.
Save public models as user preferences.
Limitations of PeopleSoft Chart and PeopleSoft Pivot GridThis section discusses:
PeopleSoft Chart limitations.
PeopleSoft Pivot Grid limitations.
PeopleSoft Chart has these limitations:
Users can only assign Value fields to the Y axis because they are numerical.
If users select Chart only as a display option, then only one level of detail can appear in the chart, and users can have one field on the X axis and one field as a data series to group the data.
If users drill down on the chart, they can select an overlay field to display two fields on the Y axis. If an overlay field is selected, then two charts are plotted and one is superimposed over the other.
Note. In PeopleTools 8.52, the number of filters on the chart is limited to four.
If users select Grid and Chart as a display option, then the chart can use one Y axis for plotting one of the Value members, and all the other axes are automatically determined based on the current grid layout.
Note. In PeopleTools 8.52, overlay fields for a Grid and Chart display option are not supported.
PeopleSoft Pivot Grid Limitations
PeopleSoft Pivot Grid has these limitations:
It does not have a vertical scroll bar for viewing data, but it displays all possible rows based on the current layout.
Pagination is not available.
Pivot Grid supports up to 75 axes and values; the character limit for each is 30.
Because of analytical grid limitations, the column axis in Pivot Grid can have only four levels.
If All (Total) is defined for the innermost level of a column, then Totals cannot be expanded. For example, the + icon next to the All label is not available and All cannot be expanded.