6/31
Oracle Discrete Manufacturing Command Center
This chapter provides information about Oracle Discrete Manufacturing Command Center dashboards.
This chapter covers the following topics:
Discrete Manufacturing Command Center
Discrete Manufacturing Command Center Overview
The Discrete Manufacturing Command Center enables you to search and view dashboard metrics related to job status, job delays, component and resource shortages, scrap and reject quantities, assembly completions, and genealogy and trace of material lot and serial units. You can increase operational efficiency and gain insight using key metrics, drillable graphs, tag clouds, and a network viewer that enables you to quickly identify problem areas and outstanding items that require intervention. Based on your role, you can use the Discrete Manufacturing Command Center to:
-
Monitor work order status.
-
Monitor production quality rejections, including scrap and yield levels.
-
Track production delays and identify exceptions.
-
Track work order execution and resolve schedule delays and quality issues.
-
View customers and sales orders that are impacted by production delays.
-
Take action to manage exceptions.
-
Monitor outside processing operations.
-
Analyze production delays due to supplier process delays.
-
View work order completions information and information for transactions without work orders.
-
View genealogy and trace the lot and serial unit entities within a network viewer diagram.
The Discrete Manufacturing Command Center includes the following dashboards:
-
Work Order Status dashboard - Use this dashboard to manage current work orders and execute tasks efficiently and on time. You can also track and analyze production delays and manage exceptions.
-
Production Quality dashboard - Use this dashboard to monitor the production quality processes. You can track and manage quality issues to meet the production schedule and demand.
-
Outside Processing dashboard - Use this dashboard to monitor outside processing operations. You can identify and manage supplier related production delays.
-
Assembly Completions dashboard - Use this dashboard to view work order completions information. You can also view information for transactions without work orders.
-
Genealogy and Trace dashboard - Use this dashboard to trace the manufacturing production network, both forward and backward, to track the source of material lots or serial units, identify and isolate problems with these lots, and view the customers impacted by the production lots or serial units.
Note: The Oracle Work in Process application configuration and setup must be completed before the installation and common configurations are completed as described in the My Oracle Support Knowledge Document 2495053.1 Installing Oracle Enterprise Command Center Framework. For additional ECC Overview information, see Overview of Oracle Enterprise Command Center Framework, Oracle E-Business Suite User's Guide.
You can use the Work Execution Track & Trace diagram from the Work Orders and Operation tabs on the Work Order Status, Production Quality, and Outside Processing dashboards to seamlessly view, track and trace the entire work order or operation execution events.
Searching Enterprise Command Center Dashboards
Use the dashboard sidebar to refine (filter) the data on each dashboard. You can also Search using a keyword, value, or a specific record. The type-ahead feature suggests matches for your entry that correspond to the selected data set. When you submit a search, the search term is added to the Selected Refinements list, and the dashboard data is refined to include only records that match the search. You can add multiple refinements and remove any of them at any time. Using Saved Searches, you can create and save your searches and refer to them later. You can also edit and delete saved searches.
Use an asterisk (*) or percent sign (%) to perform a partial keyword or record search that matches any string of zero or more characters. You can also use a question mark (?) to perform a partial search that matches any single character.
Additional Information: For more information about searching for and refining data in enterprise command centers, see Search in Highlights of an Enterprise Command Center, Oracle E-Business Suite User's Guide.
Work Order Status Dashboard
As a production supervisor or manager, you can use the Work Order Status dashboard to manage current work orders, track production delays and identify exceptions, view impacted customers, and take action to manage exceptions. The dashboard shows work order information in the Schedule, Delay, and Materials tab layouts, and enables you to navigate to the Discrete Jobs window to edit and update work orders. You can also use the Track Execution link to track and trace work order and operation execution in the network diagram and use the View Timeline link to view event timeline related to work order and operation execution.
You can search by entering a work order, operation, component, serial number, resource, or a move transaction. You can also view work order information based on the available refinements for the work orders, operations, components, serial numbers, and resources data sets. See the Discrete Manufacturing Command Center Overview for more information.
From the Work in Process responsibility, navigate to the Work Order Status dashboard:
(N) WIP > Discrete > Discrete Manufacturing Command Center > Work Order Status [tab]
Work Order Status Dashboard
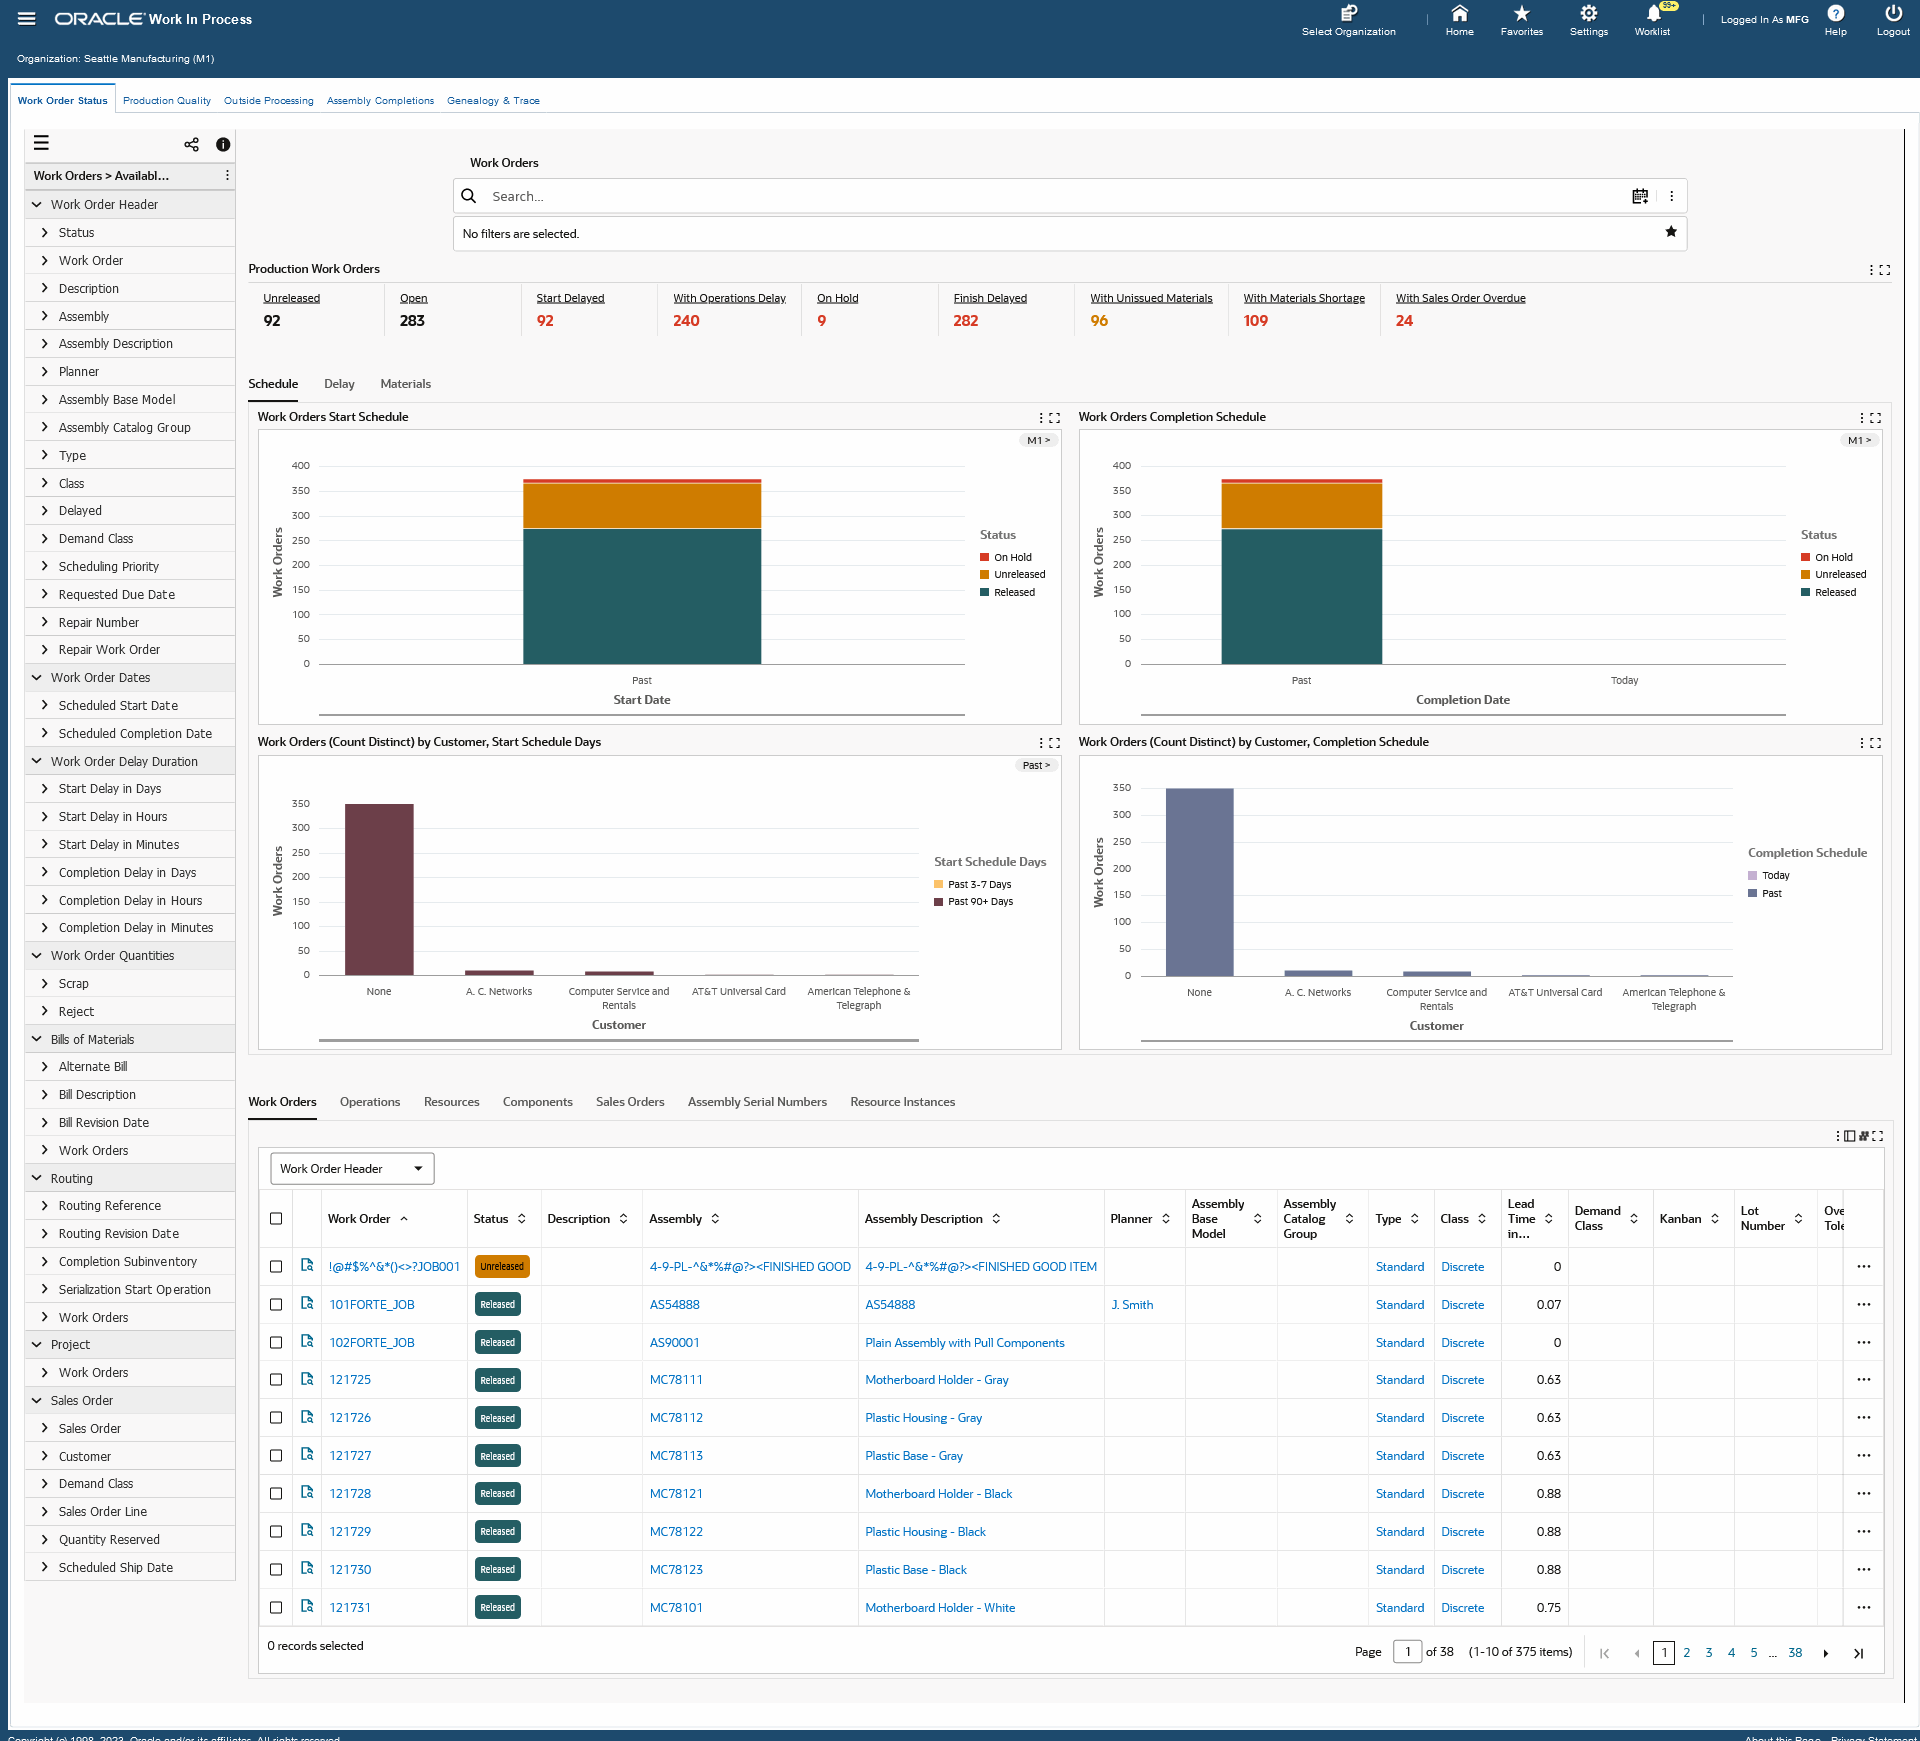
The following table describes the Work Order Status dashboard:
| Production Work Orders (summary bar) |
The Production Work Orders summary bar displays the following key metrics to summarize work order transactions based on selected organizations:
-
Unreleased
This metric displays unreleased work orders.
-
Open
This metric displays released work orders or are on hold.
-
On Hold
This metric displays work orders that are on hold.
-
Start Delayed
This metric displays work orders with start delays.
-
With Operation Delays
This metric displays work orders with operation delays.
-
Finish Delayed
This metric displays work orders with completion delays.
-
With Unissued Materials
This metric displays work orders with open material requirements.
-
With Materials Shortage
This metric displays work orders with shortage quantities.
-
With Sales Order Overdue
This metric displays work orders with corresponding overdue sales orders.
The metrics display in color codes for warnings, alerts, or exceptions. Click a metric link to refine the dashboard data. |
| Schedule (tab layout) |
The Work Orders Start Schedule chart displays organization codes segregated by work orders based on start schedule.
The Work Orders Completion Schedule chart displays organization codes segregated by work orders based on completion schedule.
You can refine the displayed data by clicking the data point on the chart and the dimension and metric value for a data point.
The Work Orders (Count Distinct) by (Group Dimension), Start Schedule Days chart displays the number of work orders by group dimension selected, based on past, today, and future start schedule dates.
The Work Orders (Count Distinct) by (Group Dimension) by Completion Schedule Days chart displays the number of work orders by customer based on past, today, and future completion schedule dates.
You can refine the displayed data by clicking the data point on the chart and the dimension and metric value for a data point.
For each chart, you can click the Options icon to select display properties (Dimensions). You can also export the chart as an image, or in a Comma-Separated Values (CSV) file format. |
| Delay (tab layout) |
The Work Orders With Start Delays chart displays organization codes segregated by work orders based on start delays.
The Work Orders with In Process Delays chart displays organization codes segregated by work orders based on delays.
You can refine the displayed data by clicking the data point on the chart and the dimension and metric value for a data point.
The Work Orders (Count Distinct) by (Group Dimension), Start Delay chart displays the number of work orders by group dimension selected, based on start delays.
The Work Orders (Count Distinct) by (Group Dimension), Operation Delay chart displays the number of work orders by group dimension selected, based on operation delays.
You can refine the displayed data by clicking the data point on the chart and the dimension and metric value for a data point.
For each chart, you can click the Options icon to select display properties (Dimensions). You can also export the chart as an image, or in a Comma-Separated Values (CSV) file format. |
| Materials (tab layout) |
The Unissued Material Requirements Summary chart displays unissued quantities of materials for on-hand quantity, open quantity, and shortage quantity. You can click the Options icon export the chart as an image, or in a Comma-Separated Values (CSV) file format.
The Unissued Material Requirements and Shortage results table lists unissued material requirements and material shortage details. Click the View Component Item Reservation action link to navigate to the Item Reservation window to view and update item reservations for the selected record. Click the View Component Item Details action link to navigate to the Items dashboard to view item master details and key item attributes for the selected record.
Click the Options icon to Compare selected records, or Export the data set. |
| Work Order Status Results Tables (tab layout) |
The Work Order Status results tables tab layout contains results tables that display work order information that include work order numbers, assembly descriptions and numbers, tolerance types, components, serial numbers, and other details.
The Production Work Orders tab layout displays information in the following result table tabs:
-
Work Orders
From the drop-down menu, you can select attribute groups to display details by:
-
Work Order Header
-
Work Order Dates
-
Work Order Quantities
-
Bills of Material
-
Routing
-
Project
Click the Record Details icon for a selected work order to view the Work Order Details dialog box.
In the Work Order Header view, click the View Assembly icon for a work order to navigate to the Items dashboard to view item master details and key item attributes for the selected record.
In the Projects view, click the View Project icon to navigate to the Project Manufacturing Command Center, Projects dashboard to view detailed project information for the selected record.
On the Work Orders tab, click the Actions icon, and select the following actions:
-
Update - Click this action link for a selected work order to navigate to the Discrete Jobs window to edit and update the work order.
-
Quick Update - Click this action link to open the Quick Update dialog box where you can reschedule and change the status of work orders. Enter a Scheduled Start Date or a Scheduled Completion Date and click Submit to refresh the status of work orders in the results tables and all other components in the Work Order Status dashboard as well as all other Discrete Manufacturing Command Center dashboards.
-
View Genealogy - Click this action link to navigate to the Genealogy and Trace dashboard to view the timeline of material lot and serial unit entities within a network viewer diagram.
-
Track Execution - Click this action link to view the Work Order Execution Track & Trace network diagram. You can then view operation status, pending material issue, shortages, resource instances, material issued quantity, resources and their quantities in the diagram and then navigate to the timeline view from the work order and operation nodes.
Note: For complete visibility of items with open material requirements or shortages, the Work Order Execution Track & Trace diagram displays component nodes based on the following:
-
All items with the Supply Type defined as Push. Such component items display the current state of the component with open, partially issued, completely issued material requirements, or with material shortage.
-
Items defined with other Supply Types such as Assembly Pull, Operation Pull, Bulk, and Vendor that have material shortages only.
-
View Timeline - Click this action link to trace the timeline of work order events related to work order and operation schedules along with material issues, returns, resource transactions, resource instances, quality nonconformances, and dispositions.
Note: You view the network diagram for multiple work orders on the Work Orders results table. Select multiple work orders from the results table, click the Options icon, and then click View Genealogy. You can then navigate to the Genealogy and Trace dashboard to view the timeline of material lot and serial unit entities within a network viewer diagram for the selected records.
-
Operations
From the drop-down menu, you can select attribute groups to display details by:
-
Operation Details
-
Operation Dates
-
Operation Quantities
-
Shop Floor Status
Click the Record Details icon for a selected work order to view the Operation Details dialog box
On the Operations tab, click the Actions icon, and select the following actions:
-
Track Execution - Click this action link to view the Work Order Execution Track & Trace network diagram. You can then view operation status, pending material issue, shortages, resource instances, material issued quantity, resources and their quantities in the diagram and then navigate to the timeline view from the work order and operation nodes.
Note: For complete visibility of items with open material requirements or shortages, the Work Order Execution Track & Trace diagram displays component nodes based on the following:
-
All items with the Supply Type defined as Push. Such component items display the current state of the component with open, partially issued, completely issued material requirements, or with material shortage.
-
Items defined with other Supply Types such as Assembly Pull, Operation Pull, Bulk, and Vendor that have material shortages only.
-
View Timeline - Click this action link to trace the timeline of work order events related to work order and operation schedules along with material issues, returns, resource transactions, resource instances, quality nonconformances, and dispositions.
You can view the information in the Work Orders and Operations tabs in the results tables using the Timeline View or Table View options.
Click the Timeline View icon in the Work Orders tab to see the following events for a work order:
Click the Timeline View icon in the Operations tab to see the following events for a work order operation.
Right click each event in the Timeline View to select Show Details or an action.
Click the Timeline View Option icon to enable the overview display and the select the optimum number of records within the maximum limit of 500 to view all the dates for each work order and work order operation.You can also use the Timeline View Option icon to add and remove events.
-
Resources
From the drop-down menu, you can select attribute groups to display details by:
-
Resource Details
-
Resource Quantities
-
Resource Scheduling
-
Resource Costing
Click the Record Details icon for a selected work order to view the Resource Details dialog box.
-
Components
From the drop-down menu, you can select attribute groups to display details by:
-
Component Details
-
Component Quantities
-
Supply Details
Click the Record Details icon for a selected work order to view the Component Details dialog box.
In the Component Details view, click the View Component action link to navigate to the Items dashboard to view item master details and key item attributes for the selected record.
Note: You can view Component Reservations for work orders beginning with Oracle E-Business Suite Release 12.2.10. When you select the Component Quantities view in this results table, the Reserved Quantity column appears. However, you must complete reservation setup to view reserved quantity values or the Reserved quantity values display zero amount values. In addition, the Reserved quantity also displays zero amount values for releases prior to Release 12.2.10.
-
Sales Orders
Click the Record Details icon for a selected work order to view the Sales Order Details dialog box.
-
Assembly Serial Numbers
From the drop-down menu, you can select attribute groups to display details by:
-
Assembly Serial Number
-
Assembly Details
Click the Record Details icon for a selected work order to view the Assembly Serial Number Details dialog box.
Click the View Genealogy action link to navigate to the Genealogy and Trace dashboard to view the time line of material lot and serial unit entities within a network viewer diagram.
Note: You can view the network diagram for multiple records on the Assembly Serial Numbers results table. Select multiple work orders or assembly serial numbers from the results table, click the Options icon, and then click View Genealogy. You can then navigate to the Genealogy and Trace dashboard to view the timeline of material lot and serial unit entities within a network viewer diagram for the selected records.
-
Resource Instances
Use the results table to view resource instance information such as resource type, instance name, serial numbers, department, resource, resource description, work order, operation sequence, start date, and completion date.
Click the Options icon within each results table to Compare selected records, or Export the data set. |
See:
Production Quality Dashboard
The Production Quality dashboard enables you to monitor production quality to meet production schedule and demand. You can view rejections, rework, and scrap levels to control production quality and yield. You can also use the Track Execution link to track and trace work order and operation execution in the network diagram and use the View Timeline link to view event timeline related to work order and operation execution.
You can search by entering an operation, work order, component, move transaction, serial number, or a resource. You can also view information based on the available refinements for the operations, work orders, components, serial numbers, and resources data sets. See the Discrete Manufacturing Command Center Overview for more information.
From the Work in Process responsibility, navigate to the Production Quality dashboard:
(N) WIP > Discrete > Discrete Manufacturing Command Center > Production Quality [tab]
Production Quality Dashboard
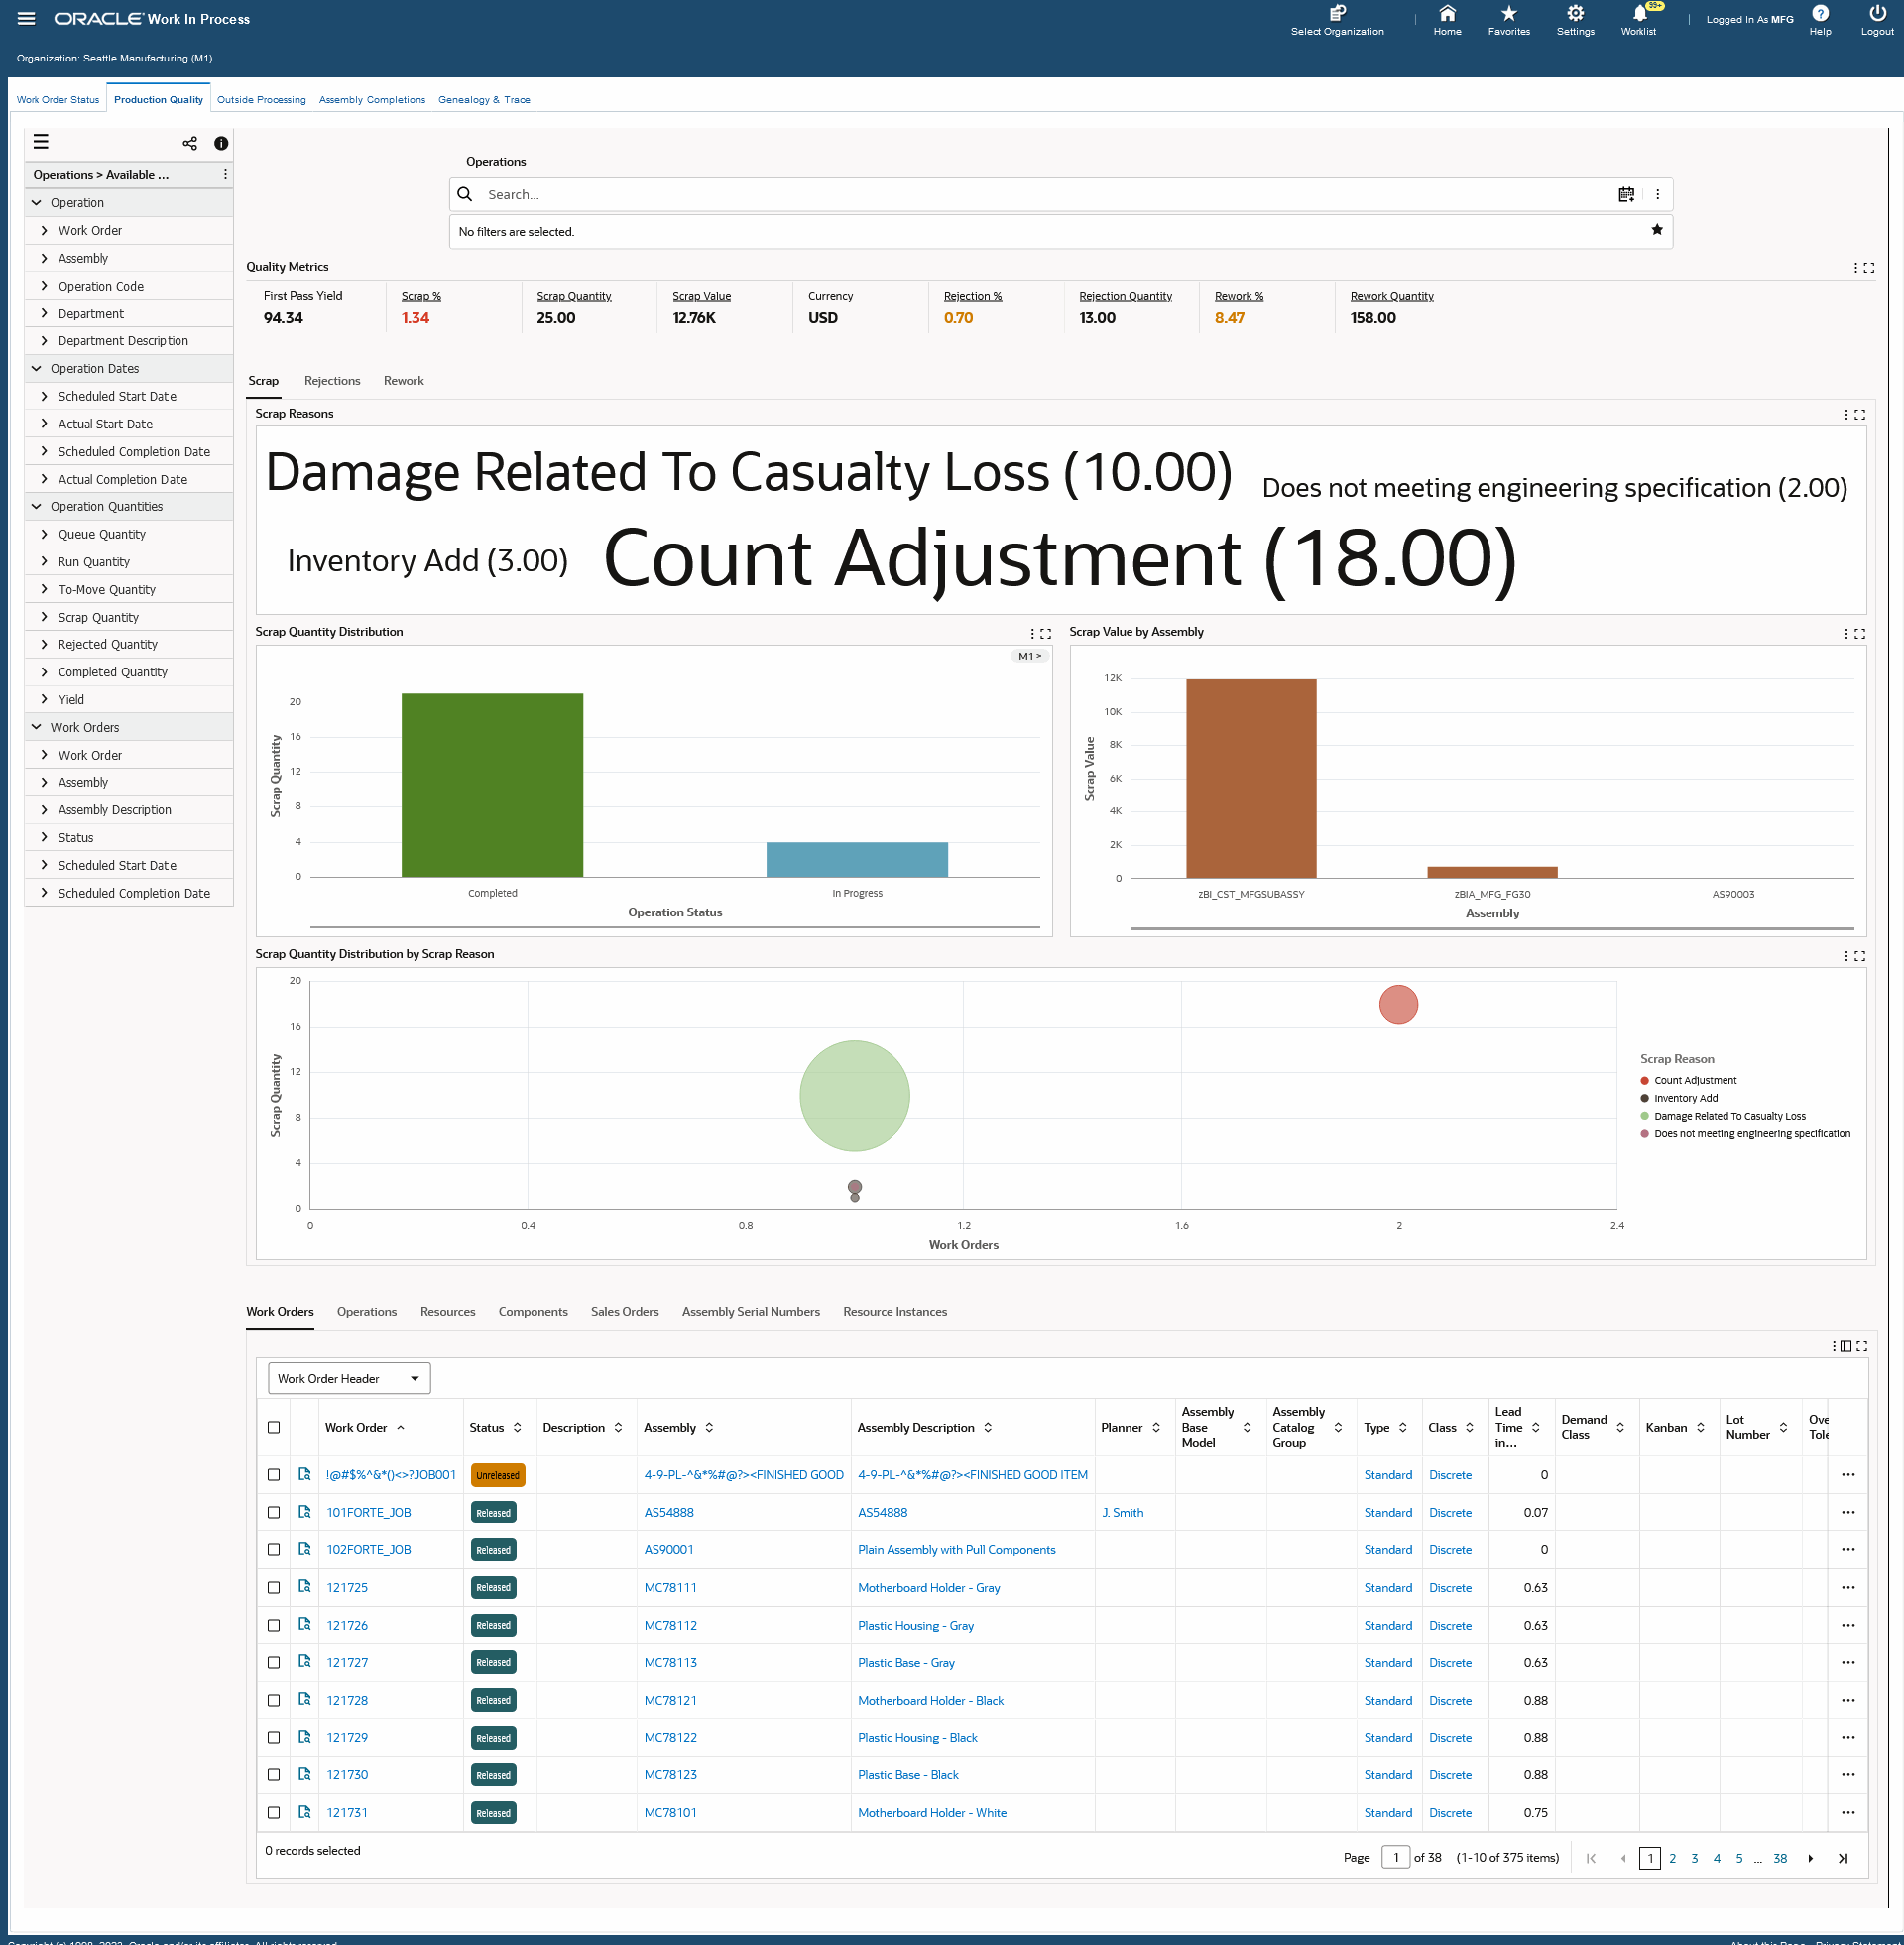
The following table describes the Production Quality dashboard:
| Quality Metrics (summary bar) |
The Quality Metrics summary bar displays the following key metrics that summarize quality transactions based on selected organizations:
-
First Pass Yield
This metric displays the percentage of units completed without scrap or rework, divided by the total completed quantity of all work orders.
-
Scrap Percent
This metric displays the percentage of total scrap quantity divided by the total quantity of all work orders completed.
-
Scrap Quantity
This metric displays the total scrap quantity of all work orders.
-
Scrap Value
This metric displays the total scrap value of all work orders.
-
Currency
This metric displays the item cost currency.
-
Rejection Percent
This metric displays the percentage of the total rejection quantity divided by the total quantity completed of all work orders.
-
Rejection Quantity
This metric displays the total rejection quantity of all work orders.
-
Rework Percent
This metric displays the percentage of the total rework quantity divided by the total completed quantity for all work orders.
-
Rework Quantity
This metric displays the total rework quantity of all work orders.
The metrics display in color codes for warnings, alerts, or exceptions. To refine the dashboard data, click a metric link. |
| Scrap (tab layout) |
The Scrap tab displays the Top 10 Scrap Reasons (tag cloud).
The Scrap Quantity Distribution chart displays scrap quantity by department.
The Scrap Value by Assembly chart displays the top 10 assemblies by scrap value.
The Scrap Quantity Distribution by Scrap Reason chart displays scrap quantity distributions by the number of work orders and scrap reasons.
For each chart, you can click the Options icon to select display properties (Dimensions). You can also export the chart as an image, or in a Comma-Separated Values (CSV) file format. |
| Rejections (tab layout) |
The Rejections tab displays the Top 10 Rejection Reasons (tag cloud).
The Rejection Quantity Distribution chart displays the rejection quantity by operation status.
The Rejection Quantity by Assembly chart displays the top 10 assemblies by rejection quantity.
The Rejection Quantity Distribution by Rejection Reason chart displays rejection quantity distributions by the number of work orders and rejection reasons.
For each chart, you can click the Options icon to select display properties (Dimensions). You can also export the chart as an image, or in a Comma-Separated Values (CSV) file format. |
| Rework (tab layout) |
The Rework Quantity Distribution chart displays the distribution of rework quantity by organization.
The Rework Operations chart displays the rework operations with rework quantity by department.
For each chart, you can click the Options icon to select display properties (Dimensions). You can also export the chart as an image, or in a Comma-Separated Values (CSV) file format. |
| Production Quality Results Tables (tab layout) |
The Production Quality results tables tab layout contains results tables that display work order and quality information. This tab layout displays information in the following result table tabs:
-
Work Orders
From the drop-down menu, you can select attribute groups to display details by:
-
Work Order Header
-
Work Order Dates
-
Work Order Quantities
-
Bills of Material
-
Routing
-
Project
Click the Record Details icon for a selected work order to view the Work Order Details dialog box.
In the Work Order Header view, you can select to click the following icons at the end of a selected row:
-
View Assembly - Use this to navigate to the Items dashboard to view item master details and key item attributes for the selected record.
-
View Nonconformances - Use this to navigate to the Quality Command Center's Nonconformances dashboard.
Note: When you navigate from the Production Quality dashboard to the Quality Nonconformances dashboard, the Organization and Assembly Item filters are carried forward and display nonconformance information for the selected assembly.
On the Work Orders tab, click the Actions icon, and select from the following:
-
Update - Click this link for a selected record to navigate to the Discrete Jobs page where you can edit and update work orders.
-
View Genealogy - Click this action link to navigate to the Genealogy and Trace dashboard to view the timeline of material lot and serial unit entities within a network viewer diagram.
Note: You can view the network diagram for multiple work orders on the Work Orders results table. Select multiple work orders, click the Options icon, and then click View Genealogy. You can then navigate to the Genealogy and Trace dashboard to view the timeline of material lot and serial unit entities within a network viewer diagram for a selected record.
-
Track Execution - Click this action link to view the Work Order Execution Track & Trace network diagram. You can then view operation status, pending material issue, shortages, resource instances, material issued quantity, resources and their quantities in the diagram and then navigate to the timeline view from the work order and operation nodes.
Note: For complete visibility of items with open material requirements or shortages, the Work Order Execution Track & Trace diagram displays component nodes based on the following:
-
All items with the Supply Type defined as Push. Such component items display the current state of the component with open, partially issued, completely issued material requirements, or with material shortage.
-
Items defined with other Supply Types such as Assembly Pull, Operation Pull, Bulk, and Vendor that have material shortages only.
-
View Timeline - Click this action link to trace the timeline of work order events related to work order and operation schedules along with material issues, returns, resource transactions, resource instances, quality nonconformances, and dispositions.
-
Operations
From the drop-down menu, you can select attribute groups to display details by:
-
Operation Details
-
Operation Dates
-
Operation Quantities
-
Shopfloor Status
Click the Record Details icon for a selected work order to view the Operation Details dialog box.
On the Operations tab, click the Actions icon, and select the following actions:
-
Track Execution - Click this action link to view the Work Order Execution Track & Trace network diagram. You can then view operation status, pending material issue, shortages, resource instances, material issued quantity, resources and their quantities in the diagram and then navigate to the timeline view from the work order and operation nodes.
Note: For complete visibility of items with open material requirements or shortages, the Work Order Execution Track & Trace diagram displays component nodes based on the following:
-
All items with the Supply Type defined as Push. Such component items display the current state of the component with open, partially issued, completely issued material requirements, or with material shortage.
-
Items defined with other Supply Types such as Assembly Pull, Operation Pull, Bulk, and Vendor that have material shortages only.
-
View Timeline - Click this action link to trace the timeline of work order events related to work order and operation schedules along with material issues, returns, resource transactions, resource instances, quality nonconformances, and dispositions.
-
Resources
From the drop-down menu, you can select attribute groups to display details by:
-
Resource Details
-
Resource Quantities
-
Resource Scheduling
-
Resource Costing
Click the Record Details icon for a selected work order to view the Resource Details dialog box.
-
Components
From the drop-down menu, you can select attribute groups to display details by:
-
Component Details
-
Component Quantities
-
Supply Details
Click the Record Details icon for a selected work order to view the Component Details dialog box.
In the Component Details view, click the View Component icon to navigate to the Items dashboard to view item and component details.
-
Sales Orders
Click the Record Details icon for a selected work order to view the Sales Order Details dialog box.
-
Assembly Serial Numbers
From the drop-down menu, you can select attribute groups to display details by:
-
Assembly Serial Number
-
Assembly Details
Click the Record Details icon for a selected work order to view the Assembly Serial Number Details dialog box.
Click the View Genealogy action link to navigate to the Genealogy and Trace dashboard to view the timeline of material lot and serial unit entities within a network viewer diagram.
Note: You can view the network diagram for multiple records on the Assembly Serial Numbers results table. Select multiple work orders or assembly serial numbers, click the Options icon, and then click View Genealogy. You can then navigate to the Genealogy and Trace dashboard to view the timeline of material lot and serial unit entities within a network viewer diagram for the selected records.
-
Resource Instances
Use the results table to view resource instance information such as resource type, instance name, serial numbers, department, resource, resource description, work order, operation sequence, start date, and completion date.
Click the Options icon within each results table to Compare selected records, or Export the data set. |
See:
Outside Processing Dashboard
The Outside Processing dashboard enables you to monitor outside processing operations, analyze production delays attributed to supplier delivery, and quickly locate specific supplier and access details. You can also use the Track Execution link to track and trace work order and operation execution in the network diagram and use the View Timeline link to view event timeline related to work order and operation execution.
You can search by entering a resource, work order, component, move transaction, serial number or an operation. You can also view information based on the available refinements for the resources, work orders, operations, components, and serial numbers data sets. See the Discrete Manufacturing Command Center Overview for more information.
From the Work in Process responsibility, navigate to the Outside Processing dashboard:
(N) WIP > Discrete > Discrete Manufacturing Command Center > Outside Processing [tab]
Outside Processing Dashboard
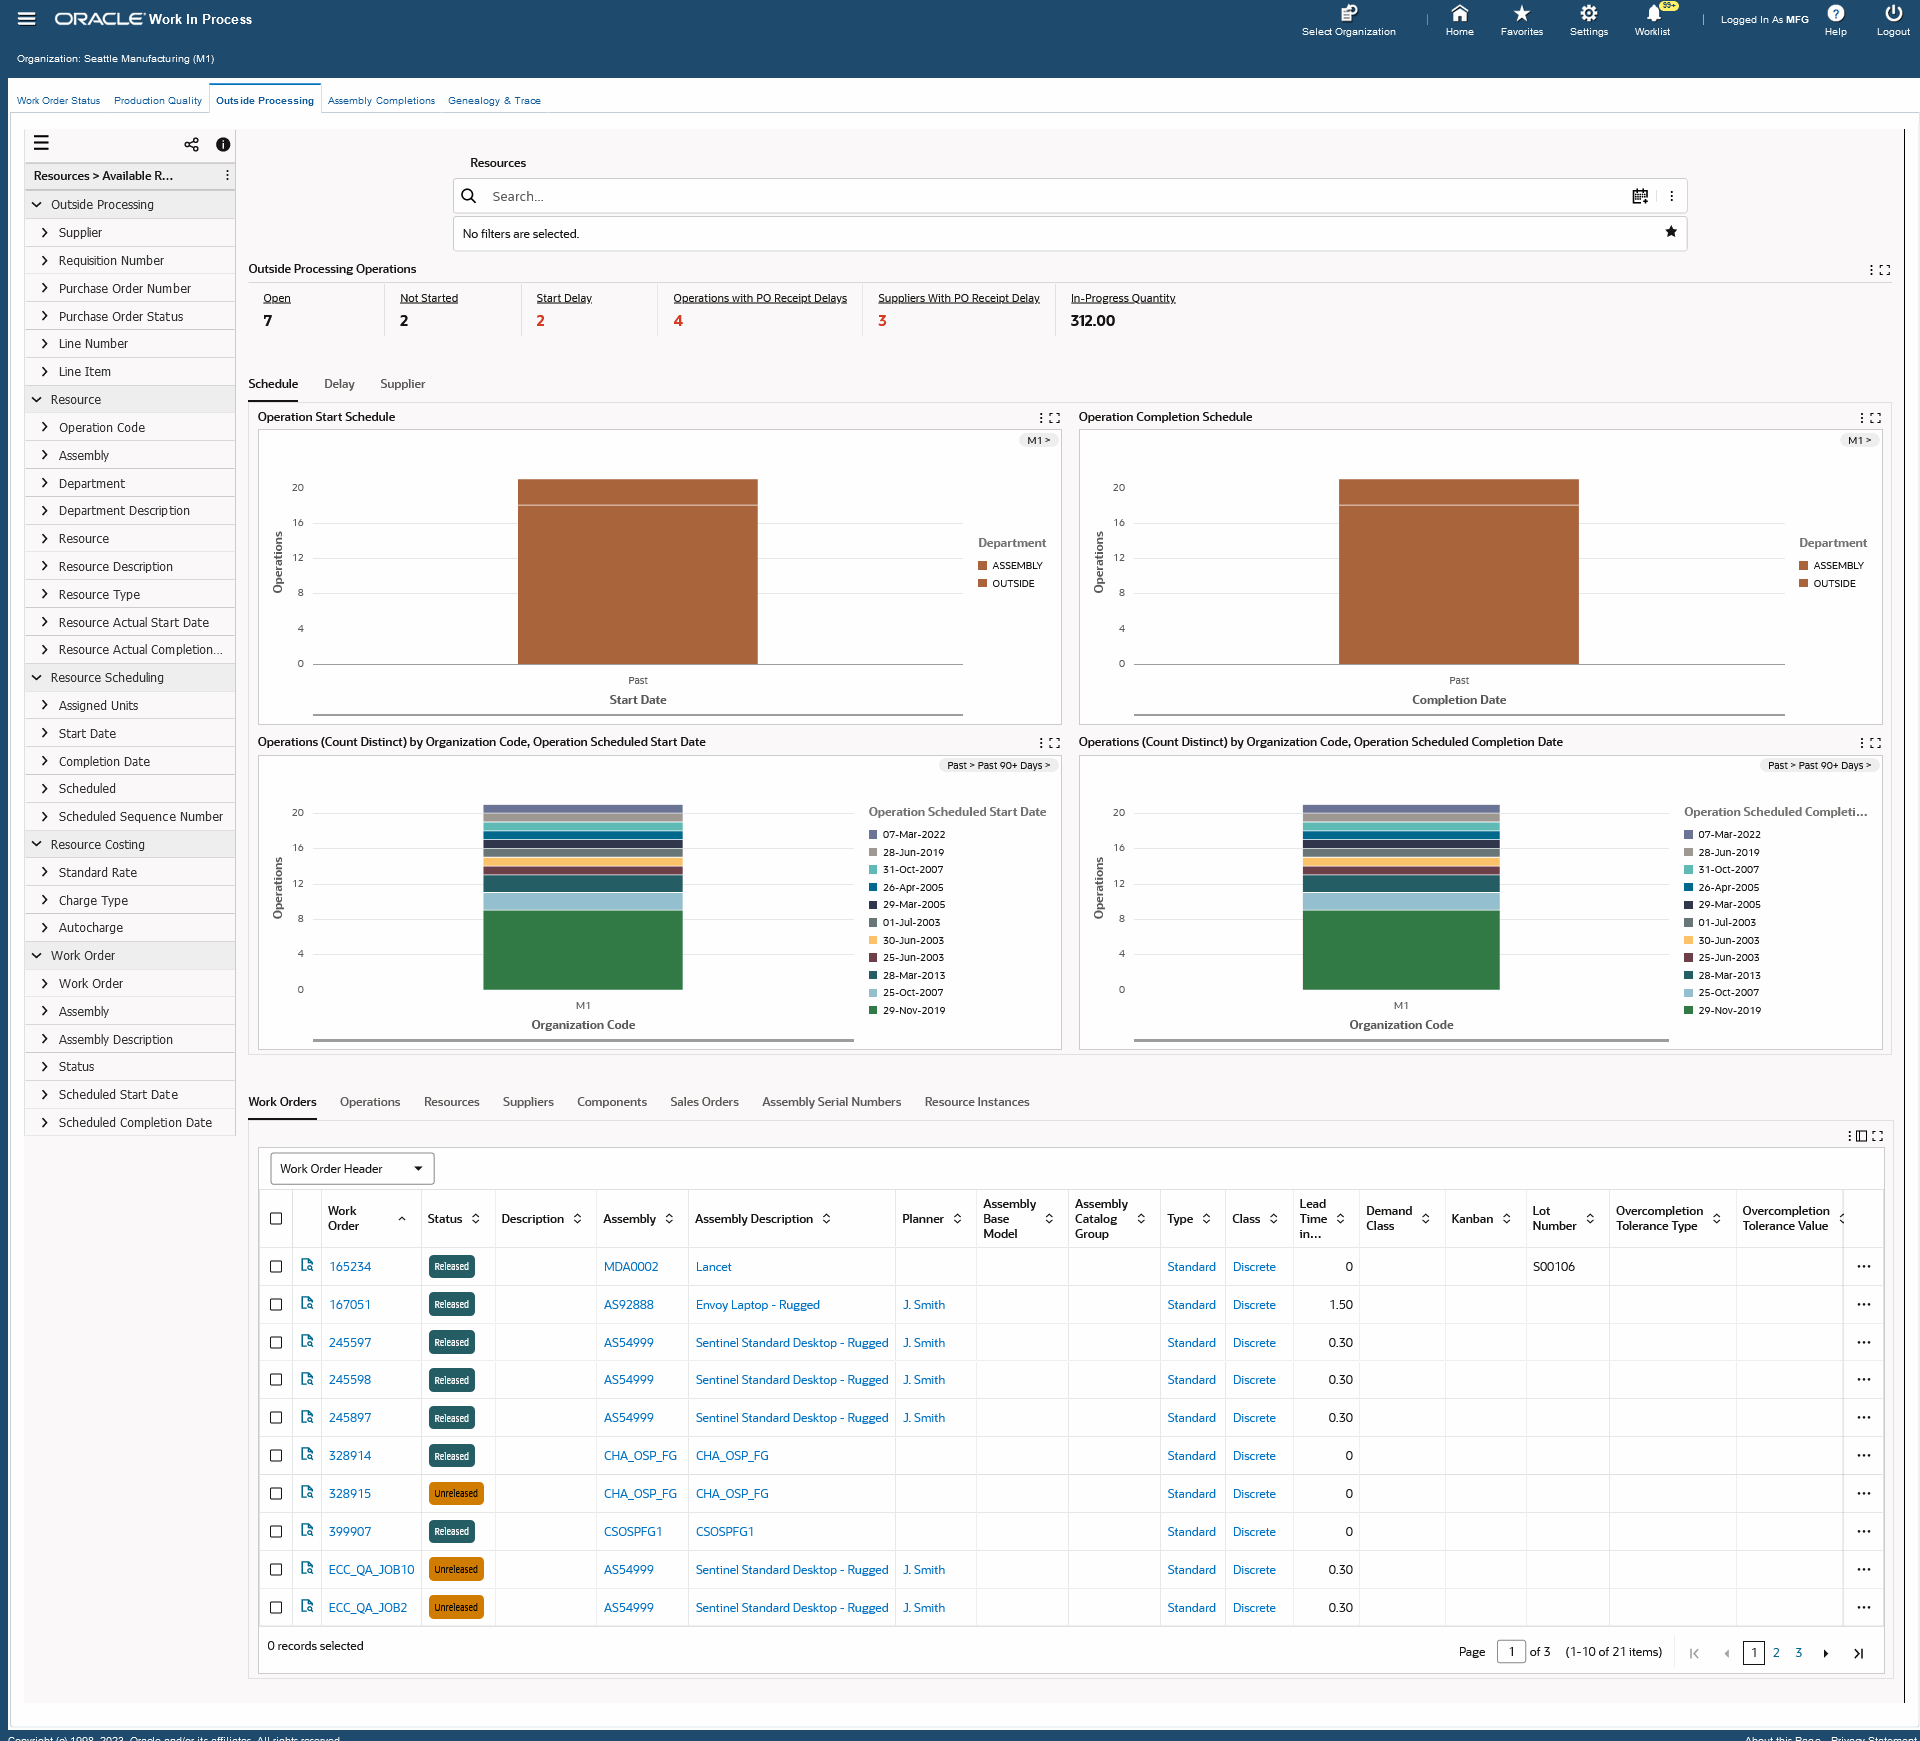
The following table describes the Outside Processing dashboard:
| Outside Processing Operations (summary bar) |
The Outside Processing Operations summary bar displays the following key metrics to summarize outside processing work for organizations:
-
Open
This metric displays the total number of open outside processing operations.
-
Not Started
This metric displays the total number of operations that have not started.
-
Start Delay
This metric displays the total number ofoperations with start delays.
-
Operations with PO Receipt Delays
This metric displays the total number of operations with past-due receipts.
-
Suppliers with PO Receipt Delays
This metric displays the total number of suppliers with past-due receipts.
-
In Progress Quantity
This metric displays the total number of assemblies in progress in outside processing operations.
The metrics display in color codes for warnings, alerts, or exceptions. To refine the dashboard data, click a metric link. |
| Schedule (tab layout) |
The Operation Start Schedule chart displays the number of operations by organization by start date.
The Operation Completion Schedule chart displays the number of operations by organization by completion date.
The Operations (Count Distinct) by (Group Dimension), Start Schedule Days chart displays the number of operations by scheduled start date.
The Operations (Count Distinct) by (Group Dimension), Completion Schedule Days chart displays the number of operations by completion schedule date.
For each chart, you can click the Options icon to select display properties (Dimensions). You can also export the chart as an image, or in a Comma-Separated Values (CSV) file format. |
| Delay (tab layout) |
The Operation Start Delay chart displays the number of operation start delays by organization.
The Operation Completion Delay chart displays the number of operation completion delays by organization.
For each chart, you can click the Options icon to select display properties (Dimensions). You can also export the chart as an image, or in a Comma-Separated Values (CSV) file format. |
| Supplier (tab layout) |
The Outside Processing Suppliers tag cloud displays the top 10 suppliers by operation status.
The Operations (Count Distinct) by Supplier, Department chart displays the number of operations by supplier and department.
The In-Progress Quantity by Assembly chart displays the number of operations that are partially completed (in progress) by assembly item.
For each chart, you can click the Options icon to select display properties (Dimensions). You can also export the chart as an image, or in a Comma-Separated Values (CSV) file format. |
| Outside Processing Operations Results Tables (tab layout) |
The Outside Processing Operations results tables tab layout contains results tables that display work order details. Results tables include:
-
Work Orders
From the drop-down menu, you can select attribute groups to display details by:
-
Work Order Dates
-
Work Order Quantities
-
Bills of Material
-
Routing
-
Project
-
On the Work Orders tab, click the Actions icon, and select the following actions:
-
Update - Click this action link for a selected work order to navigate to the Discrete Jobs window to edit and update work orders.
-
View Genealogy - Click this action link to navigate to the Genealogy and Trace dashboard to view the timeline of material lot and serial unit entities within a network viewer diagram.
-
Track Execution - Click this action link to view the Work Order Execution Track & Trace network diagram. You can then view operation status, pending material issue, resource instances, shortages, material issued quantity, resources and their quantities in the diagram and then navigate to the timeline view from the work order and operation nodes.
Note: A functional filter ensures that the Component node only displays in the Work Order Execution Track & Trace diagram if the supply type is push or if there is material shortage for a component that is greater than 0.
-
View Timeline - Click this action link to trace the timeline of work order events related to work order and operation schedules along with material issues, returns, resource transactions, resource instances, quality nonconformances, and dispositions.
Note: You view the network diagram for multiple work orders on the Work Orders results table. Select multiple work orders from the results table, click the Options icon, and then click View Genealogy. You can then navigate to the Genealogy and Trace dashboard to view the timeline of material lot and serial unit entities within a network viewer diagram for the selected records.
-
Operations
From the drop-down menu, you can select attribute groups to display details by:
-
Operation Details
-
Operation Dates
-
Operation Quantities
-
Shopfloor Status
Click the Record Details icon for a selected work order to view the Operation Details dialog box.
On the Operations tab, click the Actions icon, and select the following actions:
-
Track Execution - Click this action link to view the Work Order Execution Track & Trace network diagram. You can then view operation status, pending material issue, shortages, resource instances, material issued quantity, resources and their quantities in the diagram and then navigate to the timeline view from the work order and operation nodes.
Note: For complete visibility of items with open material requirements or shortages, the Work Order Execution Track & Trace diagram displays component nodes based on the following:
-
All items with the Supply Type defined as Push. Such component items display the current state of the component with open, partially issued, completely issued material requirements, or with material shortage.
-
Items defined with other Supply Types such as Assembly Pull, Operation Pull, Bulk, and Vendor that have material shortages only.
-
View Timeline - Click this action link to trace the timeline of work order events related to work order and operation schedules along with material issues, returns, resource transactions, resource instances, quality nonconformances, and dispositions.
-
Resources
From the drop-down menu, you can select attribute groups to display details by:
-
Resource Details
-
Resource Quantities
-
Resource Scheduling
-
Resource Costing
Click the Record Details icon for a selected work order to view the Resource Details dialog box.
-
Suppliers
Click the Record Details icon for a selected work order to view the Supplier Details dialog box.
Click the View Receiving Dashboard icon to navigate to the Receiving Dashboard. You can use this dashboard to ensure that material is received, inspected, and made available for order picking and consumption.
Note: You must run the Inventory Command Center data load to display details in the Receiving Dashboard.
-
Components
From the drop-down menu, you can select attribute groups to display details by:
-
Component Details
-
Component Quantities
-
Supply Details
Click the Record Details icon for a selected work order to view the Component Details dialog box.
-
Sales Orders
Click the Record Details icon for a selected work order to view the Sales Order Details dialog box.
-
Assembly Serial Numbers
From the drop-down menu, you can select attribute groups to display details by:
-
Assembly Serial Number
-
Assembly Details
Click the Record Details icon for a selected work order to view the Assembly Serial Number Details dialog box.
Click the Genealogy action link for a selected record to navigate to the Genealogy and Trace dashboard to view the timeline of material lot and serial unit entities within a network viewer diagram.
Note: You can view the network diagram for multiple records on the Assembly Serial Numbers results table. Select multiple work orders or assembly serial numbers, click the Options icon, and then click View Genealogy. You can then navigate to the Genealogy and Trace dashboard to view the timeline of material lot and serial unit entities within a network viewer diagram for the selected records.
-
Resource Instances
Use the results table to view resource instance information such as resource type, instance name, serial numbers, department, resource, resource description, work order, operation sequence, start date, and completion date.
Click the Options icon within each results table to Compare selected records, or Export the data set. |
See:
Assembly Completions Dashboard
The Assembly Completions dashboard displays work order completions information. The dashboard also displays information for transactions without work orders. This provides users with complete visibility of WIP completion transactions.
You can search by entering an assembly completion transaction, assembly serial transaction, component transaction or a resource transaction. You can also view information based on the available refinements for the assembly completion transactions, component transactions, resource transactions, and assembly serial transactions data sets. See the Discrete Manufacturing Command Center Overview for more information.
From the Work in Process responsibility, navigate to the Assembly Completions dashboard:
(N) WIP > Discrete > Discrete Manufacturing Command Center > Assembly Completions [tab]
Assembly Completions Dashboard
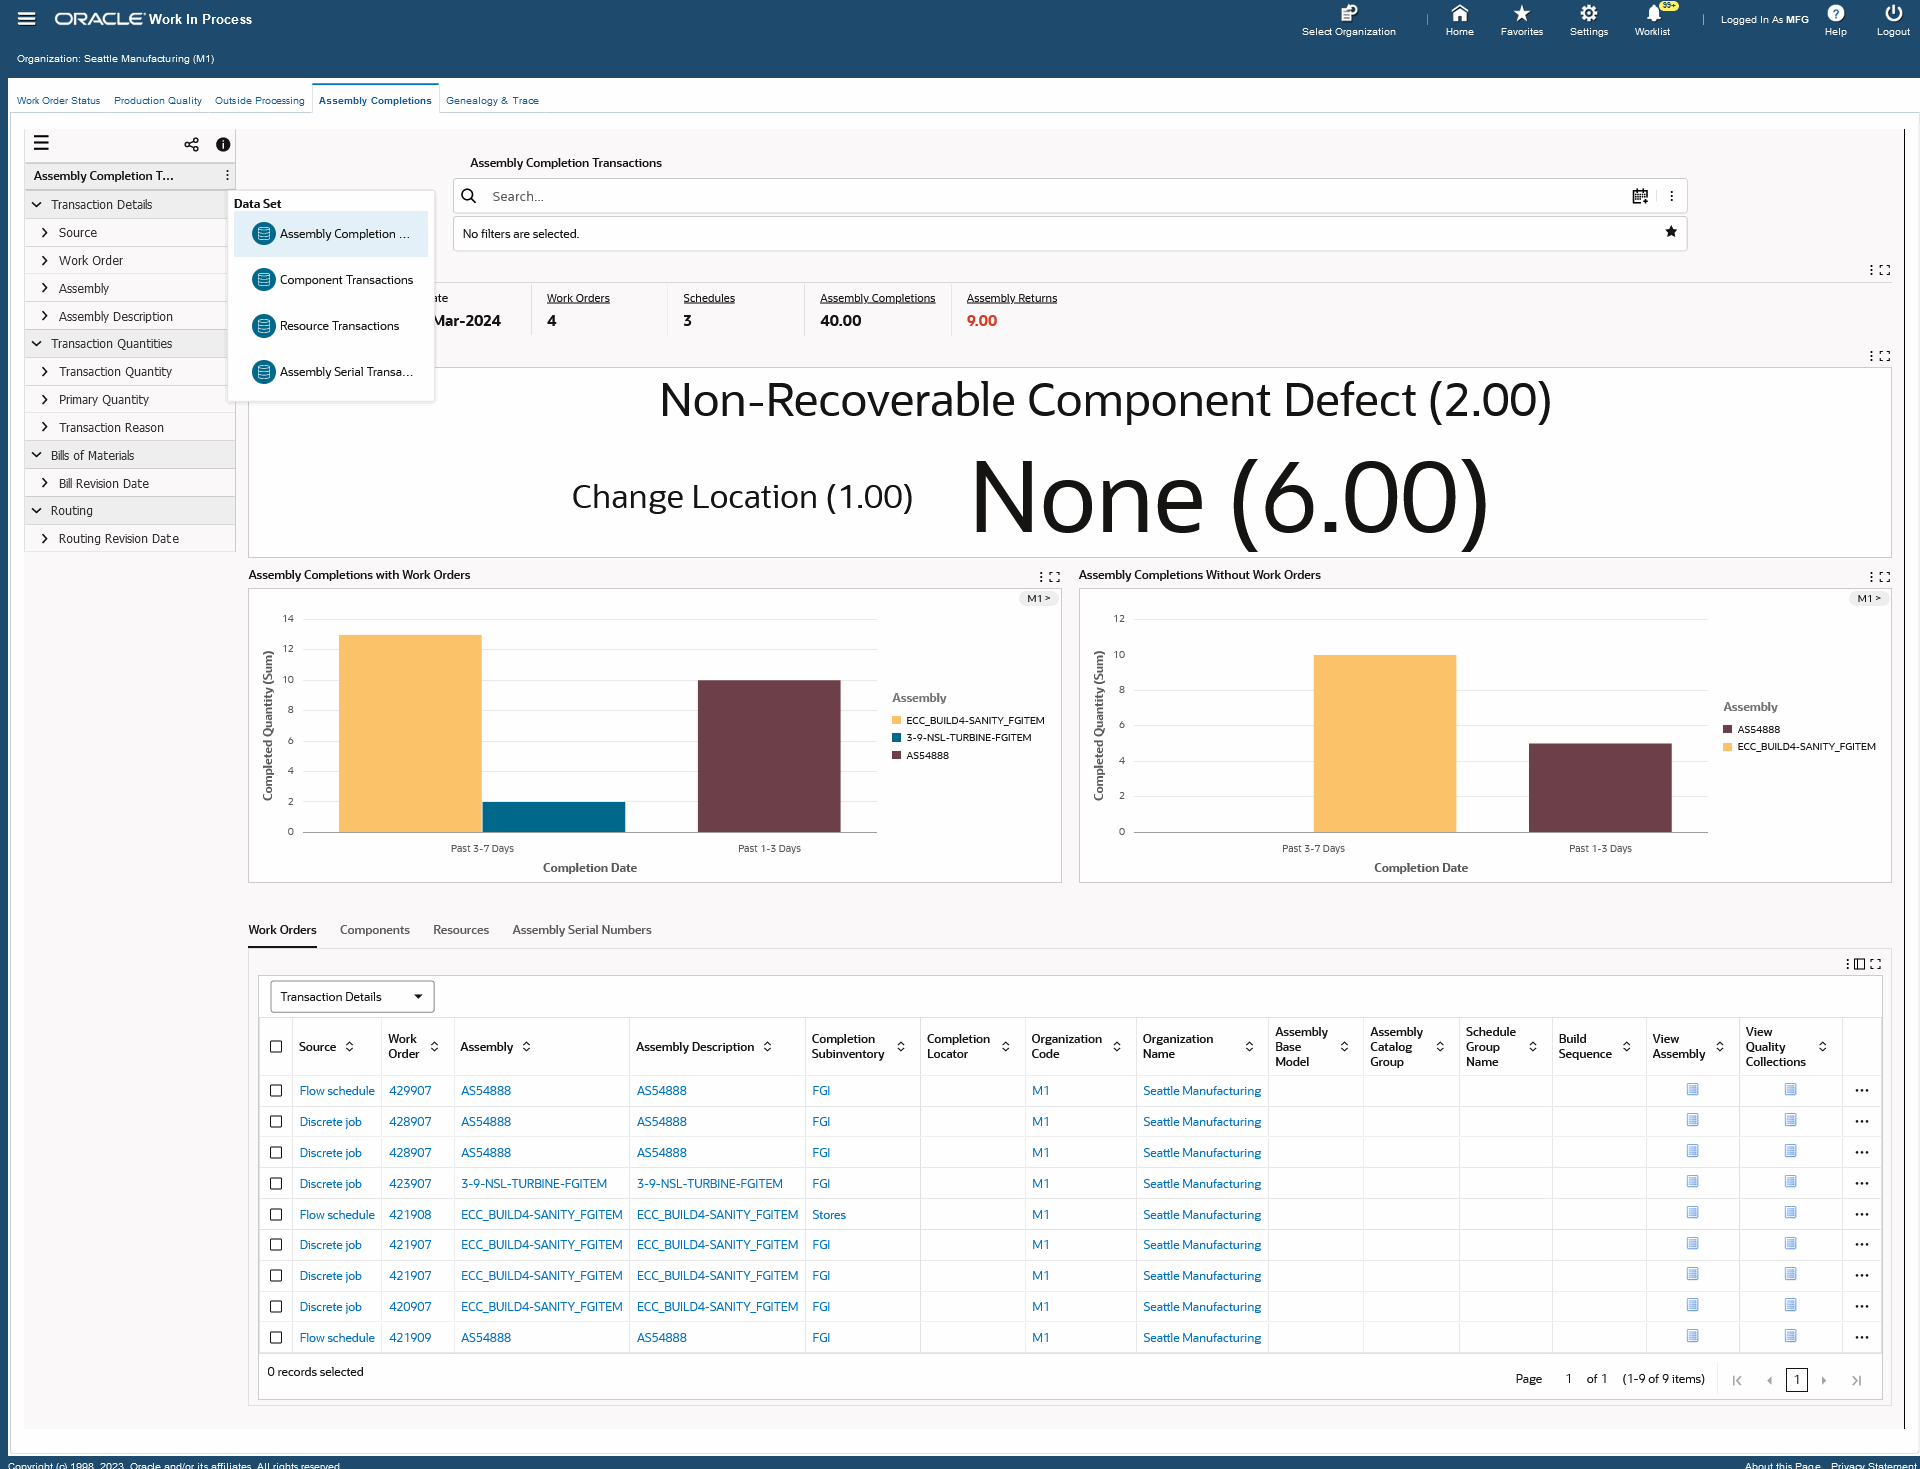
The following table describes the Assembly Completions dashboard:
| Completions (summary bar) |
The Completions summary bar displays the following key metrics based on selected organizations:
-
From Date
This metric displays the starting date for completions that are included in the dashboard view.
-
To Date
This metric displays the end date for completions that are included in the dashboard view.
-
Work Orders
This metric displays the total number of production work orders in Complete status.
-
Schedules
This metric displays the total number of completion transactions without work orders.
-
Assembly Completions
This metric displays the total completion quantity of assemblies from work orders and transactions without work orders.
-
Assembly Returns
This metric displays the total completion return quantity of assemblies from work orders and transactions without work orders.
The metrics display in color codes for warnings, alerts, or exceptions. To refine the dashboard data, click a metric link.
|
| Top 10 Assembly Returns Reasons (tag cloud) |
The Top 10 Assembly Returns Reasons tag cloud displays the top ten completion return reasons based on completion returns entered from both work orders and transactions without work orders. |
| Assembly Completions (charts) |
The Assembly Completions with Work Orders chart displays all completed assemblies with associated work orders.
The Assembly Completions Without Work Orders chart displays all completed assemblies that do not have associated work orders.
Click the Options icon for each chart to select Group Dimensions, Dimensions, and Metrics for viewing various combinations of data. You can also click the Options icon to export the charts as an image, or in a Comma-Separated Values (CSV) file format. |
| Assembly Completions Result Tables (tab layout) |
The Assembly Completions result tables tab layout includes the following tabs that display work order details:
-
Work Orders
This results table displays attributes pertaining to completed assemblies with work orders. From the drop-down menu, you can select attribute groups to display details by:
-
Transaction Details
-
Transaction Quantities
-
Bill Details
-
Project Details
Click the View Assembly icon to navigate to the Item dashboard to view item details for the selected work orders and assemblies.
Click the View Quality Collections icon to navigate to the Quality dashboard to view quality details for the selected work orders and assemblies.
On the Work Orders tab, click the Actions icon, and select the following actions:
-
View Genealogy - Click this action link to navigate to the Genealogy and Trace dashboard to view the Material Lot and Serial Unit Genealogy flow schedules for the selected record.
-
View Lot Details - Click this action link to view lot numbers for a lot-controlled assembly.
-
View Serial Details - Click this action link to view serial numbers for a serial-controlled assembly.
-
View Lot and Serial Details - Click this action link to view lot and serial numbers for a lot and serial controlled assembly.
Note: You can view the network diagram for multiple records in the Work Orders results table. Select multiple work orders, click the Options icon, and then click View Genealogy. You can then navigate to the Genealogy & Trace dashboard to view the timeline of material , lot and serial unit entities within a network viewer diagram for the selected records.
-
Components
This results table displays attributes pertaining to components for work orders and assemblies. From the drop-down menu, you can select attribute groups to display details by:
-
Component Details
-
Component Quantities
Select Component Details and then click the View Component icon to navigate to the Item dashboard to view item details for the selected work orders, assemblies, and components.
Select Component Details and then click the View Quality Collections icon to navigate to the Quality dashboard to view quality details for the selected work orders, assemblies, and components.
For both Component Details and Component Quantities, click the Actions icon, and select the following actions:
-
View Lot Details - Click this action link to view lot numbers for a lot-controlled component.
-
View Serial Details - Click this action link to view serial numbers for a serial-controlled component.
-
View Lot and Serial Details - Click this action link to view lot and serial numbers for a lot and serial controlled component.
-
Resources
This results table displays attributes pertaining to resource details for work orders and assemblies. From the drop-down menu, you can select attribute groups to display details by:
-
Resource Details
-
Resource Costing
-
Assembly Serial Numbers
This results table displays attributes pertaining to assembly serial number details for work orders and assemblies.
Click the View Genealogy action link to navigate to the Genealogy and Trace dashboard to view Material Lot and Serial Unit Genealogy flow schedules for the selected record.
Note: You can view the network diagram for multiple records in the Assembly Serial Numbers results table. Select multiple work orders or assembly serial number, click the Options icon, and then click View Genealogy. You can then navigate to the Genealogy & Trace dashboard to view the timeline of material , lot and serial unit entities within a network viewer diagram for the selected records.
|
See:
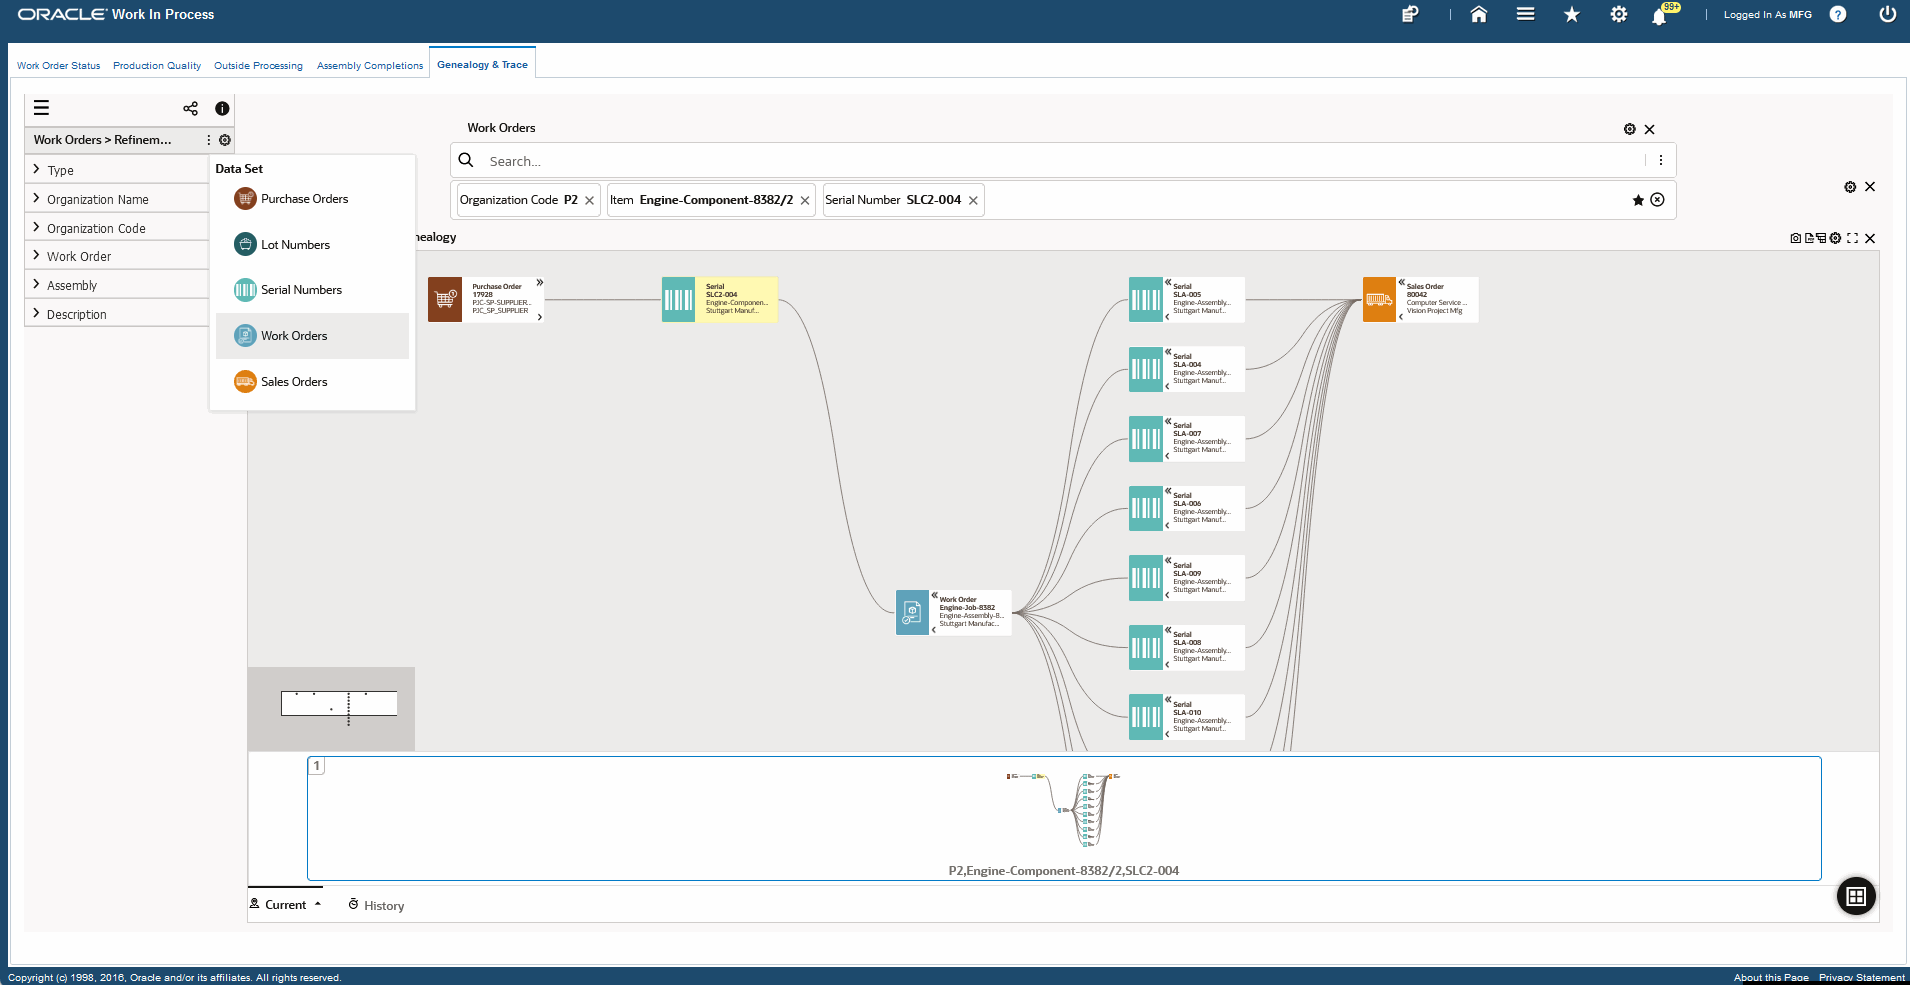
Genealogy and Trace Dashboard
The Genealogy & Trace dashboard displays the genealogy and trace of material lot and serial unit entities within a network viewer diagram. Production supervisors can trace the serial or lot entity in the shop floor and view component materials, work orders, and shipping details. The dashboard allows users to perform backward and forward traceability across the supply chain.
You can search by entering a work order, lot number, serial number, purchase order, or a sales order. You can also view information based on the available refinements for the work orders, purchase orders, lot numbers, serial numbers, and sales orders data sets. See the Discrete Manufacturing Command Center Overview for more information.
From the Work in Process responsibility, navigate to the Genealogy & Trace dashboard:
(N) WIP > Discrete > Discrete Manufacturing Command Center > Genealogy and Trace [tab]
Genealogy and Trace Dashboard
The following table describes the Genealogy & Trace dashboard:
| Material Lot and Serial Unit Genealogy (network viewer) |
The Material Lot and Serial Unit Genealogy network viewer for material lot and serial unit traceability displays the following data sets. Click the Options icon to select from the following data sets:
-
Purchase Orders
-
Lot Numbers
-
Serial Numbers
-
Work Orders
-
Sales Orders
You can right click each of the following nodes in the Network Viewer and select from the actions available for each node.
-
Purchase Order - Click View Purchase Order action to navigate to the Purchase Order page to view and update the purchase order.
-
Lot Number
-
View Item Lots - click to navigate to the Item Lots window to view on-hand quantity information, lot information, view lots, or manage existing lot information such as Lot Status.
-
View Lot Transactions - click to navigate to the Material Transactions window to view lot and serial number information for a transaction.
-
View Quality Results - click to navigate to the Quality Command Center, Collection Results dashboard to manage quality data collection and inspection results.
-
View Material Workbench - click to navigate to the Material Workbench window to view material on-hand quantity information.
-
Serial Number
-
View Serial Numbers - click to navigate to the Serial Numbers window to view and update serial number information.
-
View Serial Transactions - click to navigate to the Material Transactions window to view lot and serial number information for a transaction.
-
View Quality Results - click to navigate to the Quality Command Center, Collection Results dashboard to manage quality data collection and inspection results.
-
View Material Workbench - click to navigate to the Material Workbench window to view material on-hand quantity information.
-
Work Order
-
View Discrete Jobs - click to navigate to the Discrete Jobs window to view and update discrete jobs.
-
View Move Transactions - click to navigate to the View Move Transactions window to view move transactions for individual jobs or repetitive schedules.
-
View Work Order Status - click to navigate to the Work Order Status dashboard to view and update work order details.
-
View Quality Results - click to navigate to the Quality Command Center, Collection Results dashboard to manage quality data collection and inspection results.
-
View Nonconformances - click to navigate to the Quality Command Center, Nonconformances dashboard to manage quality non-conformances and dispositions of defects in products and processes.
-
Sales Order - Click View Sales Order to navigate to the Sales Order page to view and update the sales order.
-
Batch
-
View Batch Details - click to navigate to the Batch Details window.
-
View Batch Status - click to navigate to the Process Manufacturing Command Center, Batch Status dashboard.
-
View Production Quality - click to navigate to the Process Manufacturing Command Center, Production Quality dashboard.
The network viewer also displays the lineage between transaction nodes. Examples include:
-
Lot and serial units received from purchasing. The viewer displays the purchase order and supplier information.
-
Lot and serial unit component items issued to WIP or returned. The viewer displays the work order information.
-
Lot and serial unit assemblies completed in WIP. The viewer displays work order information.
-
Lot and serial units shipped. The viewer displays the sales order and customer information.
Right-click a node to select from the following options:
-
Make Anchor Node - Select this option to make a node the main node.
-
Show Adjacent Nodes - Select this option to expand a node to see its related nodes.
-
Highlight Path - Select this option to highlight the specific path of a node. You can right-click and select Unhighlight Path to remove highlighting a path.
-
Explore Node - Select this option to explore the node further.
-
Compare - Select multiple nodes and click Compare for a side-by-side comparison of the records of each selected node.
-
Show Details - Select this for a node to open the Details window to view all attribute details available for a node.
On the Details window, select multiple filters and then click:
Additional actions include:
-
Export to Image - export the network diagram as a svg or png image file.
-
Export to PDF - export the full network diagram in pdf format.
-
Row Expander - converts the network view diagram to text format with action icons that display details within a dialog box.
|
See: