Other Common HTML Setups
This chapter covers the following topics:
- Specifying the Default Customer for Case Management and Service Desk
- Enabling Multiple HTML Modules in a Single Instance
- Modifying Notes
- Viewing Audit History
- Understanding Key Performance Indicators
- Setting Up Key Performance Indicators
- Setting Up Jeopardy for Service Requests
Specifying the Default Customer for Case Management and Service Desk
Most Service Desk and Case Management implementations do not require agents to enter customer information.
This is because service desks help employees working in a single organization (the customer). Investigative agencies usually create cases on behalf of a single organization as well.
For this reason, both the Service Desk and Case Management modules hide customer information pages by default.
Because service requests and cases do require customer entry, you must set a default customer by setting the system profile Service: Default Customer Name.
If you want agents to capture customer information in every service request or case, then make sure that this system profile is left null and that you expose the various customer information regions using the Personalization feature.
Enabling Multiple HTML Modules in a Single Instance
To run multiple TeleService modules in a single instance, you must implement standard service request security by mapping service request types to the responsibilities for each module. If you do not, all service request types are available in the different modules.
See Setting Up Service Request and Case Security.
Note: Many fields, including Severity and Urgency, are not mapped to service request types and are the same across all the application modules.
Modifying Notes
By default, users cannot update notes created in Customer Support, Service Desk, and Case Management. Notes cannot be edited by any user, including the note author.
You can modify notes with the appropriate responsibility by adding functions to the default Notes Security submenu for that responsibility:
-
Internal Menu Name: CSZ_SR_T2_AGENT_NOTES_GRANT
-
Menu User Name: Customer Support Tier 2 Agent Notes Security Menu
You must add the following three functions:
-
JTF_NOTE_UPDATE_NOTES
-
JTF_NOTE_UPDATE_NOTE_DETAILS
-
JTF_NOTE_UPDATE_SECONDARY
If you make notes editable by adding these functions, you must be aware that:
-
Changes are not audited.
This means that there is absolutely no indication that a note has been updated, who updated it, or when it was updated.
-
You cannot specify which notes a user can edit.
If you make notes editable, a user can update any existing note, including those created by other users and customers as well as notes created within other applications accessible through the user's responsibility.
Viewing Audit History
You can view the audit report for the service request from the Update Service Request page. Use the Audit History page to view the history of changes to the service request attributes you select in the Audit Report.
The service request audit report displays the following information:
-
Service request attribute name
-
Date of change
-
Name of the application user name who made the change. If the service request attribute is not changed, the attribute is not displayed.
-
Name of the resource who made the change
-
The original value of the service request attribute
-
The new changed value of the service request attribute
-
Any other additional information required by the agents
Agents can write comments and add reasons why the change was made for each service request attribute.
Understanding Key Performance Indicators
This topic describes the functionality and setup steps for the Key Performance Indicator region in the Agent Dashboard.
Statistics About Personal and Group Performance
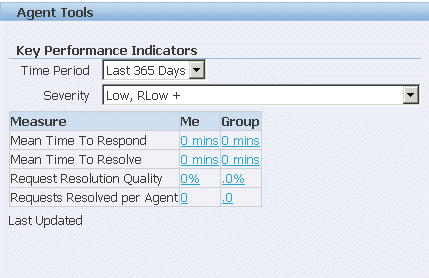
Agents can view statistics about their personal and group's response to customer service requests in the Key Performance Indicator region of the Agent Dashboard (shown in the image below).

Key performance indicators include the following measures of agent and group performance:
-
Mean Time to Respond
The average time it takes to respond to a service request from the time the service request is entered.
-
Mean Time to Resolve
The average time it takes to close the service request from the time it is entered. (Closing a service request means setting it at a status classified as final.)
-
Request Resolution Quality
The percentage of service requests that are not reopened by customers. (This percentage is the opposite of the reopen rate, the percentage of service requests that are reopened by customers.)
-
Requests Resolved per Agent
The number of service requests set to a final (closed) status.
The data in the Key Performance Indicators are refreshed by a concurrent program and stored in materialized views.
By default, group performance is calculated based on the groups the agent belongs to. You can restrict the calculations by specifying a single group in a system profile.
Key Performance Indicator Filters
Agents can filter the data by length of time and severity.
By making a selection from the Period of Time list, agents can choose to display the statistics for:
-
Today
-
Last 7 Days
-
Last 30 Days
-
Last 90 Days
-
Last 365 Days
Agents can use the Severity list to filter the service requests by severity. The filtering choices depend on the severities you have set up and their importance level. (See Setting Up Service Request Severities.) For example:
-
Severity <highest importance> Only
-
Severity <2nd highest> and Higher
-
Severity <3rd highest> and Higher
-
Severity <4th highest> and Higher
Agent Productivity Details
Between the time it is logged to the time it is resolved, a service request can have multiple owners and multiple periods when it is waiting on customers or other individuals.
Because the key performance indicators summaries displayed on the dashboard base their calculations on the on the total time from entry to resolution, they provide performance measures from the customer's rather than the agent's point of view.
For example, the key performance indicators statistics for Agent A are calculated based on the six day service request resolution time even though Agent A resolved it in one day. The service request spent four days waiting on response from the customer and one day with Agent B who could not resolve the issue.
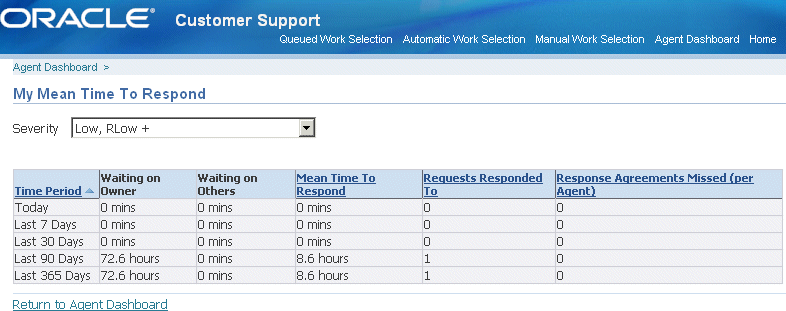
Agents can get an indication of their personal and group performance by drilling down to view the key performance details.
These show the amount of time service requests spent waiting on the owner (the agent) and on others. The following image shows the details for the response time on service requests:

Setting Up Key Performance Indicators
Use the following procedure to set up key performance indicators on the Agent Dashboard.
Prerequisites:
You must classify service request statuses with the predefined status classifications:
-
Waiting on Customer
-
Waiting on Support
-
Waiting on Internal Group
-
Waiting on External Group
For details, see Setting Up Service Request Statuses.
To set up key performance indicators
-
Optionally, set the system profile CSY: Service Request Group Filter, to the group you wish to use in the group key performance indicator calculations. By default, this system profile is set to All.
-
Under the Service responsibility, navigate to Others, and select Submit Requests.
-
In the Submit a New Request dialog box, choose Request Set.
-
Run the KPI Summary: Initial Data Load Set concurrent program. You only need to run this program once in any implementation.
-
Schedule the KPI Summary: Incremental Data Load Set concurrent program to run frequently to synchronize the materialized views with your application data.
Setting Up Jeopardy for Service Requests
The application considers service requests with expected response or resolution dates past the current date as in jeopardy and displays them in red on the Agent Dashboard.
You can also use jeopardy as one of the search criteria on the Advanced Search page. For example, you can search for all the service requests you own that are in jeopardy. (By default, you must add the Jeopardy search parameter using the Add Attribute ist.)
You can extend the range of service requests that are considered by the application as in jeopardy by making entries in the system profiles Service: Jeopardy: Response Date Buffer and Service: Jeopardy: Resolution Date Buffer.
For example, if you set Service: Jeopardy: Resolution Date Buffer to 2 and today is August 4, any service request with an expected resolution date of August 6 or earlier is considered in jeopardy by the application.
On the Agent Dashboard, the application displays any dates in jeopardy by this extended definition in blue.