Monitoring Procurement Operations
This chapter discusses how to use the Procurement Operations dashboard and actions available from this dashboard.
This chapter covers the following topics:
- Analyzing Procurement Operations
- Using Oracle Web ADI in Oracle Procurement Command Center Plus
- Performing Bulk Update of Purchasing Data Using Oracle Web ADI
- Overview of Procurement Manager Actions
- Performing Actions for Requisitions
- Performing Actions for Orders
- Performing Actions for Agreements
- Performing Actions for Negotiations
- Performing Actions for Deliverables
- Performing Actions for Notes
Analyzing Procurement Operations
The Procurement Operations Dashboard helps buyers gain end-to-end visibility of the status of procurement. For example, a buyer can view the backing requisition for a purchase order line, the agreement line from which the PO line was sourced, the RFX award from which the agreement line was created, and open supplier deliverables.
Full Procurement Lifecycle
Using this dashboard, buyers can filter and see relationships across all the following domains:
-
Requisitions
-
Purchase Orders
-
Global Blanket Agreements and Contract Agreements
-
Negotiations
-
Deliverables
By viewing related documents, buyers can assess individual document flows end-to-end as well as evaluate important related documents. The buyer can review all procurement activities pertaining to them, discover issues and resolve them before business is affected.
With graphs, buyers can visualize agreement utilization status and take action to terminate, renegotiate, or extend documents as needed.
Requisition Management
Buyers can review requisitions and prioritize requisitions based on business needs. Buyers can also manage requisition and other document workload using notes.
Integrated Payables Information
Procurement Command Center enables buyers to respond quickly to purchase order and agreement performance by monitoring purchasing documents beyond the walls of procurement. Buyers track information on ordered, shipped, received, and invoiced quantities and amounts available through the Procurement Operations Dashboard. Buyers are able to identify invoice holds, overdue payments, and procurement contract deliverables.
Procurement Operations Dashboard Details
Using the different regions in this dashboard, procurement teams and procurements managers can:
-
Prioritize work, discover and resolve problems as the dashboard offers a 360 degree view of procurement activities.
-
Take corrective action on exceptions before business is affected.
-
Search across documents and update multiple documents with one click.
-
View catalog review ratings from Oracle iProcurement.
-
View supplier performance evaluation ratings from Oracle Supplier Lifecycle Management.
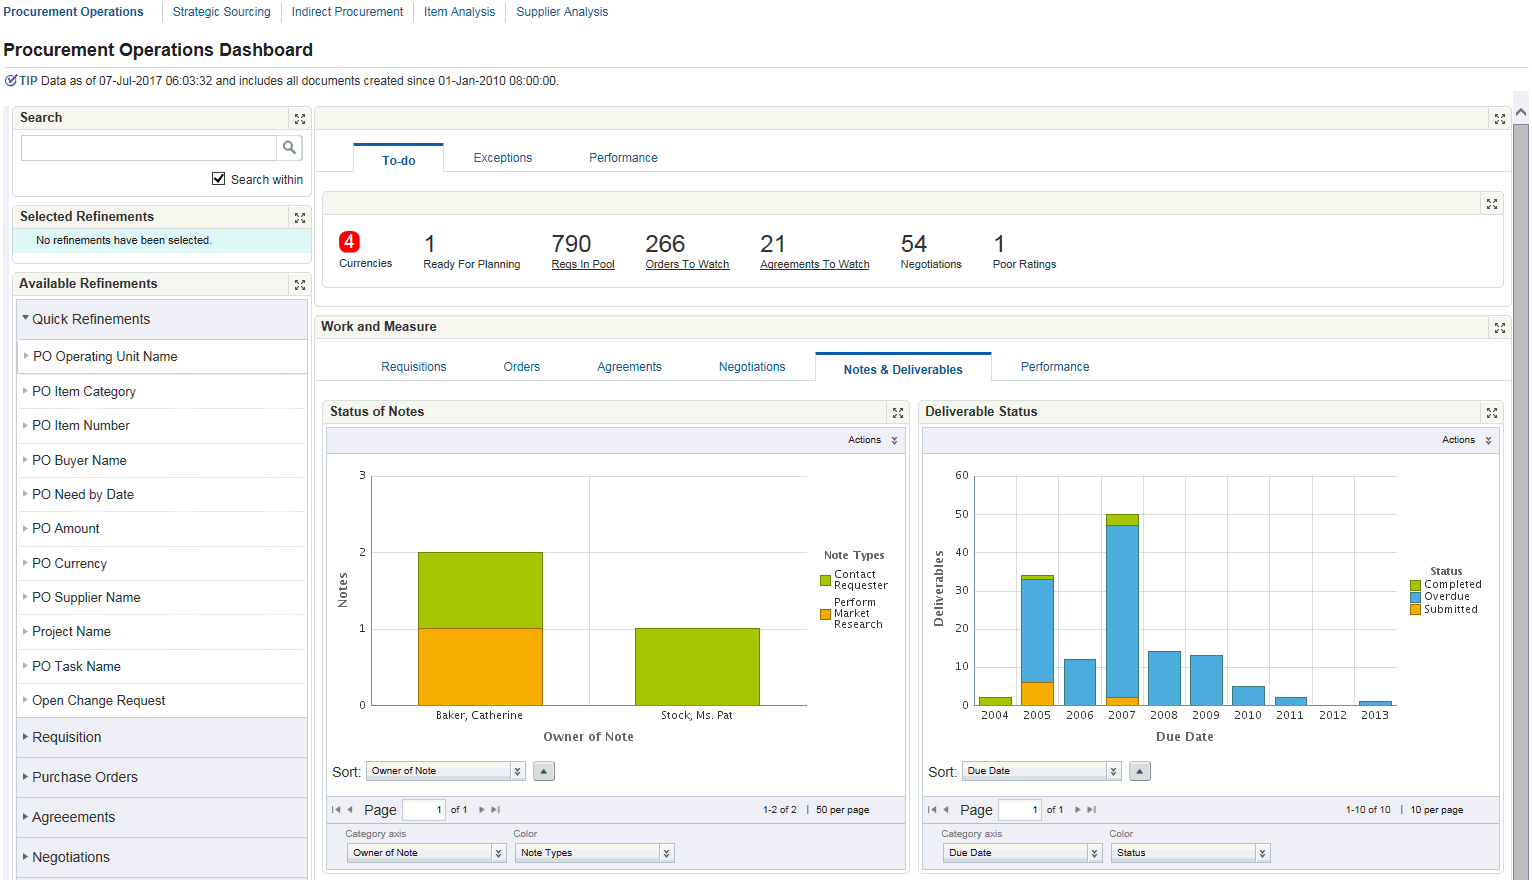
Header Region
This region displays the date and time stamp of the last ETL update.
Search Region
The Search component allows you to submit keyword searches and provides type-ahead suggestions displaying attribute values that match the typed text. When you perform a search, the search term is added to the Selected Refinements component. As you type, you may be prompted to select a matching attribute value, or simply search for the entered text.
Partial record search is enabled for specific attributes. Attributes for partial record search include:
-
PO Item Description
-
PO Description
-
Requisition Item Description
-
Requisition Description
-
Agreement Description
-
Agreement Item Description
-
PO Supplier
-
Agreement Supplier
-
Note type
-
Note Description
-
PO Number
-
Requisition Number
-
Agreement Number
-
Deliverable Name
-
Negotiation Item Description
Selected Refinements
The Selected Refinements component displays all values that you have selected to filter data, and allows you to quickly make adjustments to the current refinement by removing items or clearing all filters from the list.
Bookmarks
The Bookmarks component allows you to save a given navigation and component state and return to it at a later time.
Available Refinements
The Available Refinements component allows you to filter data based on the currently available values or value ranges for selected attributes that are displayed within attribute groups. Expand the attribute groups to view and select attribute names.
Metrics
Metrics are displayed in the following tabs:
-
To-Do
-
Exceptions
-
Performance
To-Do
The To-Do tab displays the following metrics based on the filters applied on the page.
If the value of a metric is zero, then the metric is automatically hidden.
| Metric Display Title | Description |
|---|---|
| Ready for Planning | Number of Project Procurement Plan lines in the Ready for Planning status. Click to navigate to Oracle Project Procurement Command Center Plus. This metric is displayed only if Oracle Project Procurement Command Center Plus is installed and procurement plan lines exist in the application. |
| Reqs in Pool | Number of approved requisition lines in the buyer's pool |
| Negotiations | Number of negotiations that are not completed or cancelled |
| Orders to Watch | Number of purchase orders with open action items or in any of the following statuses: Incomplete, In-process, Pre-approved, or Pending Change Request |
| Agreements to Watch | Number of purchase orders with open action items or in any of the following statuses: Draft, In-process, Pre-approved, Pending change-requests, Approaching Amount Limit, Approaching End Date, Amount Limit reached, or End-date Reached |
| Poor Ratings | Number of poor ratings (two stars or below). Click to navigate to the Indirect Procurement dashboard and filter down to review comments. |
| Feedback Lines | Number of feedback items that are currently open. Click to navigate to the Indirect Procurement dashboard and filter down to view the feedback items with the Not Closed status. |
| Open Initiatives | Number of Sourcing Initiatives that are currently open. Click to navigate to the Strategic Sourcing Dashboard. |
Exceptions
The Exceptions tab displays the following metrics based on the filters applied on the page.
If the value of a metric is zero, then the metric is automatically hidden.
| Metric Display Title | Description |
|---|---|
| Urgent Requisitions | Number of requisition lines in the pool that are marked Urgent. Requisition lines must be in the pool. |
| Overdue Shipments | Number of purchase order lines with open quantity on shipments and a need-by-date in the past |
| Rejected Shipments | Number of purchase order lines on which quality rejections have been reported during receiving |
| Overdue Deliverables | Number of open deliverables with a due date in the past |
| Invoices On Hold | Number of purchase order lines which are referenced by an Accounts Payable (AP) Invoice with a payment hold |
| Overdue Notes | Number of open notes on which a delay is marked |
| Change Requests | Number of purchase orders or agreements with open change requests |
Performance
The Performance tab displays the following metrics based on the filters applied on the page.
If the value of a metric is zero, then the metric is automatically hidden.
| Metric Display Title | Description |
|---|---|
| Currency | Select a currency to view currency-specific information. Some of the elements on this dashboard are dependent on currency. |
| Suppliers | Number of different suppliers in the current view. |
| On-Time Delivery | On-Time Delivery The following default color key indicates the percentage of shipments received on-time:
|
| Quality | The percentage of shipments with no quality rejections The following default color key indicates the percentage of shipments with no quality rejections:
|
| Price Compliance | The ratio of the price demanded on the invoice and the agreed-upon price agreed on the agreement or order, expressed as a percentage The following default color key indicates the price compliance percentage:
|
| Procurement Cycle Time | The average time taken from Requisition Approval to Purchase Order Approval. The following default color key indicates the average time taken:
|
| Savings Achieved | The ratio of savings negotiated and savings targeted, expressed as a percentage. The percentage of negotiated savings is calculated as: Average Offer Price - Start Price)/ Targeted Savings (Target Price - Start Price) - Weighted by Negotiation Amount) The following default color key indicates the savings achieved in percentage:
|
Work and Measure Region
The Work and Measure region displays the following charts and graphs:
Wherever the chart shows amount or price, the chart will render only when there is only one currency in the current view.
| Tab | Chart Title | Details |
|---|---|---|
| Requisitions | Requisition Status | This stacked bar chart shows the number of requisitions in each status. The Category axis values are Need By Date (month, drill down to date – default), Approved Date (month, drill down to date), approval date, Buyer Name (drill down to month / date), Next Action Owner, and Next Action Type. The Value Axis shows the Number of Requisition Lines and Requisition Amount. Each requisition line status is represented by a different color, which shows the following (evaluated top-down, if one condition is satisfied, then that condition is considered):
Note that the chart does not consider requisition lines which are in incomplete, in-process, cancelled or returned status. |
| Requisitions | Requisition Analysis | This pie chart shows requisition amount by buyer, category, requisition number, and ship-to. |
| Orders | Order Lifecycle Tracker | This comparative bar chart shows how much has been ordered, received and invoiced, in terms of amounts. The Category axis values are PO need-by-year, drill-down to month, drill-down to date. The Value axis is shown as the Total Amount (that is the sum of PO amounts for all POs - exclude cancelled quantities / amounts) Each bar represents the following: Ordered Amount, Received Amount, and Invoiced Amount. |
| Orders | Order Status | This bar chart provides a summary of order status. The Value axis values are Orders (number of orders) and PO Amount (excluding cancelled amounts). The Category axis values are Promised Date, Creation Date, Group Status, Buyer Name, Approved Date, Next Action Type, and Sub Status. Each purchase order sub status is represented by a different color. View an enhanced PO Status / Sub-status structure that describes the current status of the PO. The chart uses the following structure:
|
| Agreements | Agreement Utilization | This balloon chart shows how well the agreement is being utilized over the lifecycle. The X-axis value is Lifecycle Time, which is expressed as a percentage of time consumed or the overall duration of the agreement. Time Consumed = sysdate – agreement start date Overall duration = Agreement end-date – Agreement start date The Y-axis value is the Utilization Gap%, calculated as planned utilization – actual utilization. Planned utilization = (sysdate – agreement start date)/(agreement end date – agreement start date) Actual utilization = Amount released / agreed amount The bubble size represents the Amount Agreed – one bubble per agreement |
| Agreements | Agreement Status | This bar chart provides a summary of agreement status. The Category axis values are Agreement Approved Month / Year, Last changed month / year, Buyer, Status (default). The Value axis shows the Agreements (number of orders) and Agreement Amount. Each agreement sub-status is represented by a different color. View an enhanced agreement Status or Sub status structure that describes the current status of the agreement. The chart uses the following structure:
|
| Negotiations | Savings Analysis | This bubble chart helps compare projected savings on each negotiation with the actual savings achieved on that negotiation. The X-axis values is Projected Savings shown as:
The Y-axis value is Negotiated Savings shown as:
The bubble size represents the Negotiation Amount, which is calculated as Current Price * Quantity. The chart displays one balloon per negotiation. |
| Negotiations | Negotiations Status | This bar chart shows a summary of negotiation statuses. The Category axis values are Negotiation Published Year / or Month (default), Negotiation Buyer, and Negotiation Status. The Value axis shows the Negotiations (count of negotiations) and Negotiation Amount Each negotiation status is represented by a different color. |
| Notes & Deliverables | Status of Notes | This stacked bar chart shows the status of a note and the action to be taken. The Category axis values are Owner of Note (default - drill down to note entities), Note Entity Type (drill down to assignee), and Note Target Date. The Value axis shows the number of open notes. Each Note Type and Note Status is represented by a different color. |
| Notes & Deliverables | Deliverable Status | This stacked bar chart provides details on the status of the deliverables. The Category axis values are Delivery due month (default) – drill down to date, Owner, Document Type, and Responsible Party. The Value axis value shows the number of deliverables (deliverable count). This stacked bar chart provides details on the status of the deliverables. The Category axis values are Delivery due month (default) – drill down to date, Owner, Document Type, and Responsible Party. The Value axis value shows the number of deliverables (deliverable count). |
| Performance | Supplier Performance | This bubble chart is similar to the bubble chart in the Supplier Analysis page. The X-axis values are Delivery Rating (default), Quality Rating, and Price Compliance. The application uses the following calculation:
The Y-axis values are Delivery Rating (default), Quality Rating, and Price Compliance. The bubble size represents the purchase order amount of that supplier. The chart does not display data when there are multiple functional currencies. |
| Performance | Procurement Cycle-Time | The bubble size represents the purchase order amount of that supplier. The chart does not display data when there are multiple functional currencies. The chart displays the Performance Evaluation Score, which is calculated by averaging out the score for all purchase orders and agreements in the visible data set. The X-axis value is Time. The Y-axis values are Category, Buyer, and Ship-to. Different colors indicate the following cycle times:
|
Procurement Documents Region
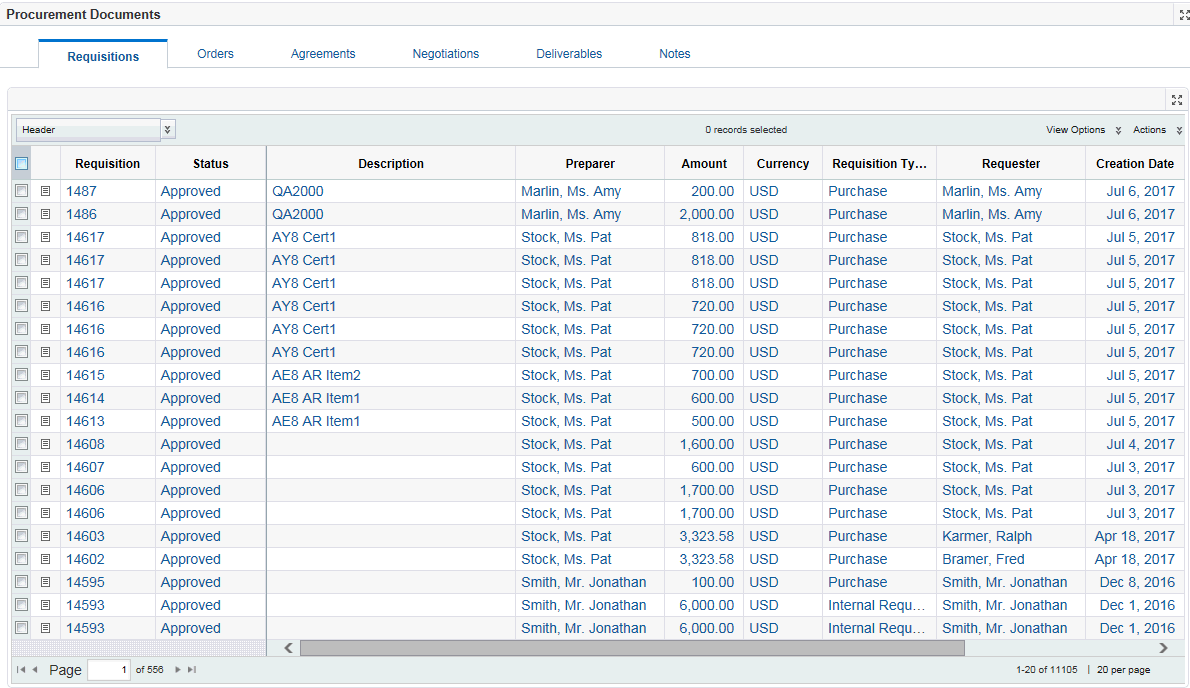
The Procurement Documents region displays a summary of the item within the following tabs:
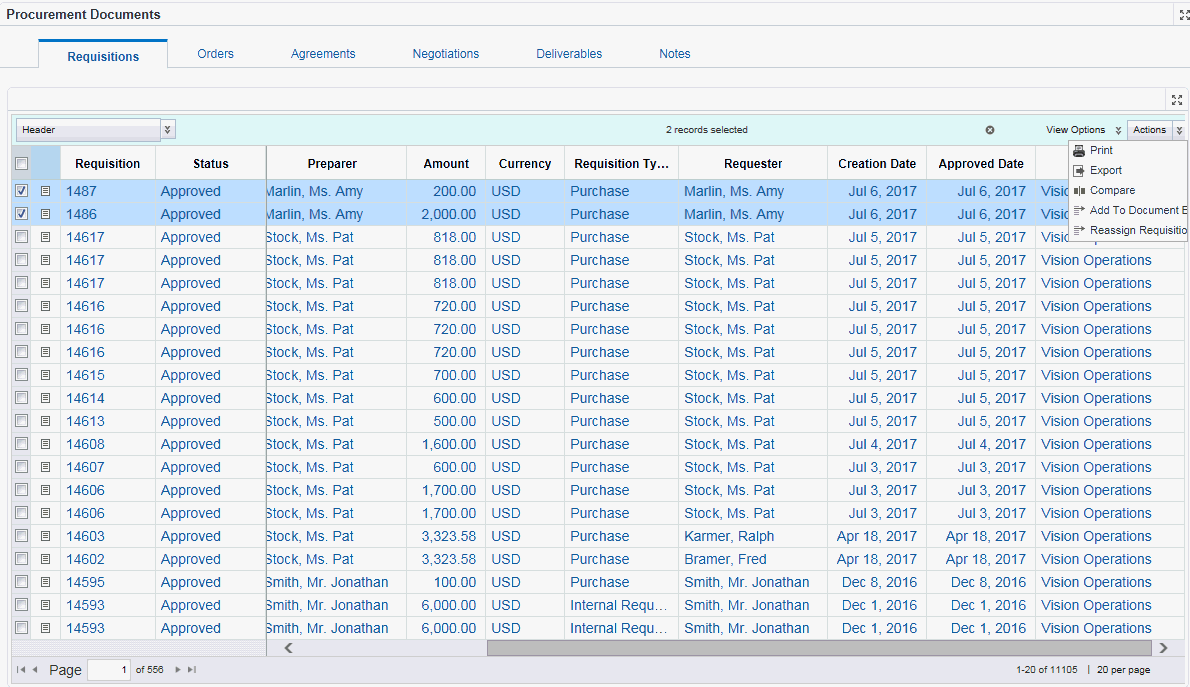
Requisitions tab
The Requisitions tab displays the following options:
-
The Header option displays relevant details such as the requisition number, the status, the description, the requester, the requisition type, and the amount.
-
The Lines option displays the requisition line number, type, the item number, the revision information, and the unit price.
-
The Additional Details option displays the tax information, the requisition task name, the deliver to location, and the destination type.
-
The Action option enables you to perform certain actions for requisitions. For more information, see: Performing Actions for Requisitions.
You can perform the following actions using the Actions list on the right side of the tab:
-
Print
-
Export
-
Compare
-
Add to Document Builder
-
Reassign Requisitions
For more information, see:
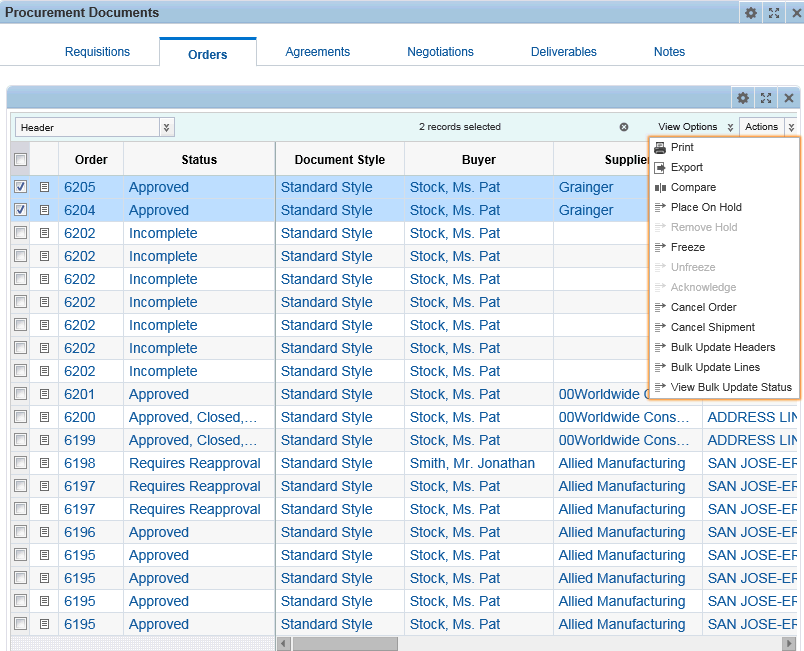
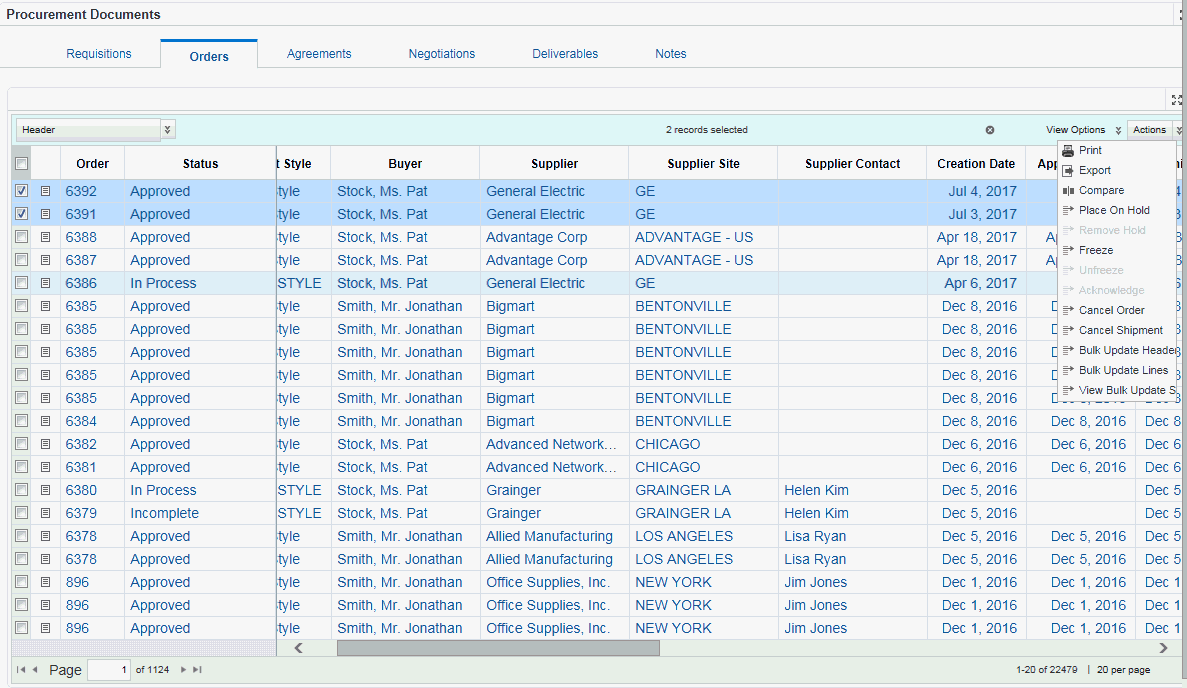
Orders tab
The Orders tab displays the following options:
-
The Header option displays details such as the order number, the status, the supplier, the open change request count, the work confirmation count, and the payment terms.
-
The Lines option displays details such as the order line type, the item number, the category, the unit price, the need by date, the promised date, and the line status.
-
The Performance Tracker option displays details such as the delivery rating, the quality rating, and the price compliance rating. You can view the subjective performance score, which is an average performance score received by a supplier on all evaluations linked to an order.
-
The Line Quantity Tracker option displays details such as the line number and the line quantity( ordered, shipped, received, rejected, invoiced, and cancelled) quantity. You can also view if the shipment is overdue.
-
The Line Amount Tracker option displays details such as the line number, the unit price, and the amount (ordered, shipped, received, rejected, and invoiced).
-
The Distribution option displays details such as the destination type, the destination subinventory, the charge account, the project name, the task name, the expenditure type and item date, the distribution requester, and the ship to location.
-
The Actions option. For more information, see: Performing Actions for Orders.
You can perform the following actions using the Actions list on the right side of the tab:
-
Print
-
Export
-
Compare
-
Place On Hold
-
Remove Hold
-
Freeze
-
Unfreeze
-
Acknowledge
-
Cancel Order
-
Cancel Shipment
-
Bulk Update Headers
-
Bulk Update Lines
-
View Bulk Update Status
For more information, see:
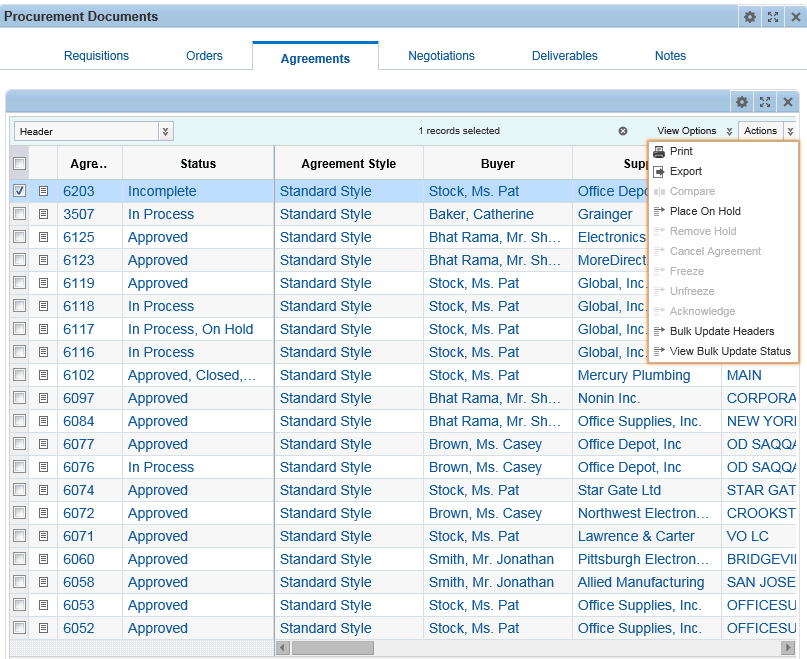
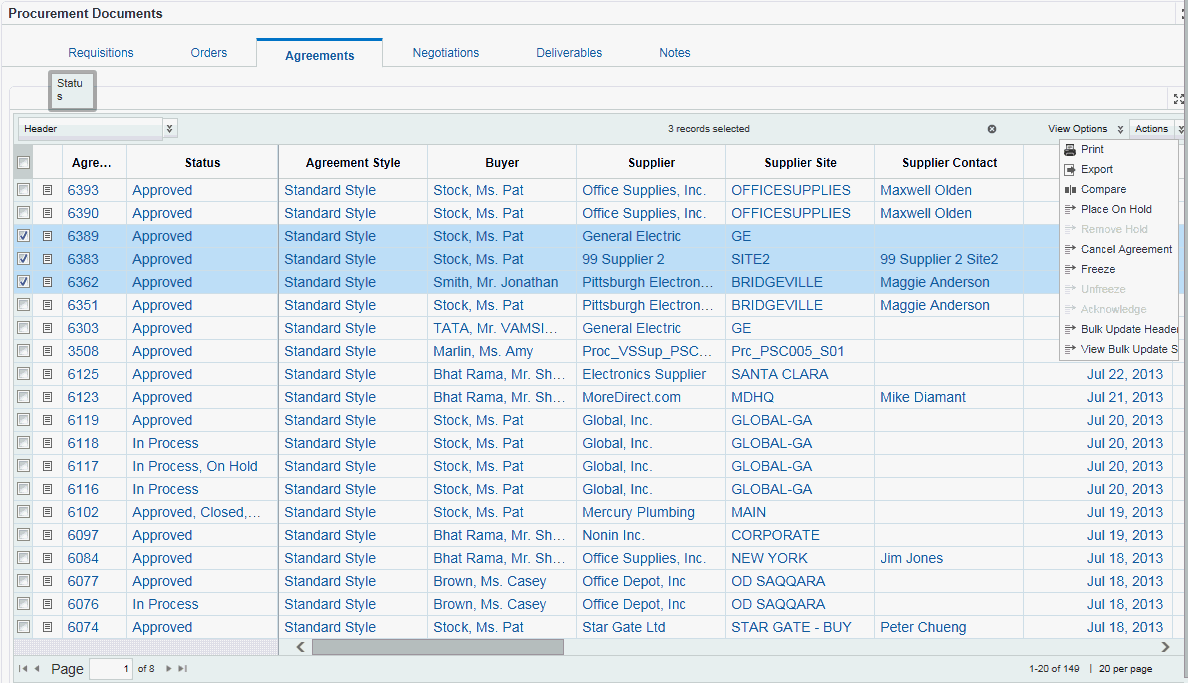
Agreements tab
The Agreements tab displays the following options:
-
The Header option displays details such as the agreement number, the status, the style, the buyer, the supplier, the revision, and the currency, payment term. You can view if a change request exists for an agreement.
-
The Lines option displays details such as the agreement line number, the line type, the lead time, the supplier item number, the price break count, and the next action date.
-
The Actions option. For more information, see: Performing Actions for Agreements.
-
The Header Amount Tracker option displays details such as the agreement line number agreement amount (released, shipped, received, invoiced) and the currency.
-
The Performance Tracker option displays details such as the delivery rating, quality rating, and price compliance rating. The price compliance rating is the summary of all orders referencing the agreement.
-
The Line Amount Tracker option displays details such as the agreement line number, the currency, and the amount (released, shipped, received, invoiced).
-
The Line Quantity Tracker option displays details such as the agreement line number, the unit price, and the quantity (released, shipped, received, rejected, and invoiced).
-
The Line Performance Tracker option displays details such as the line number, the delivery rating, and the quality rating.
You can perform the following actions using the Actions list on the right side of the tab:
-
Print
-
Export
-
Compare
-
Place On Hold
-
Remove Hold
-
Cancel Agreement
-
Freeze
-
Unfreeze
-
Acknowledge
-
Bulk Update Headers
-
View Bulk Update Status
For more information, see:
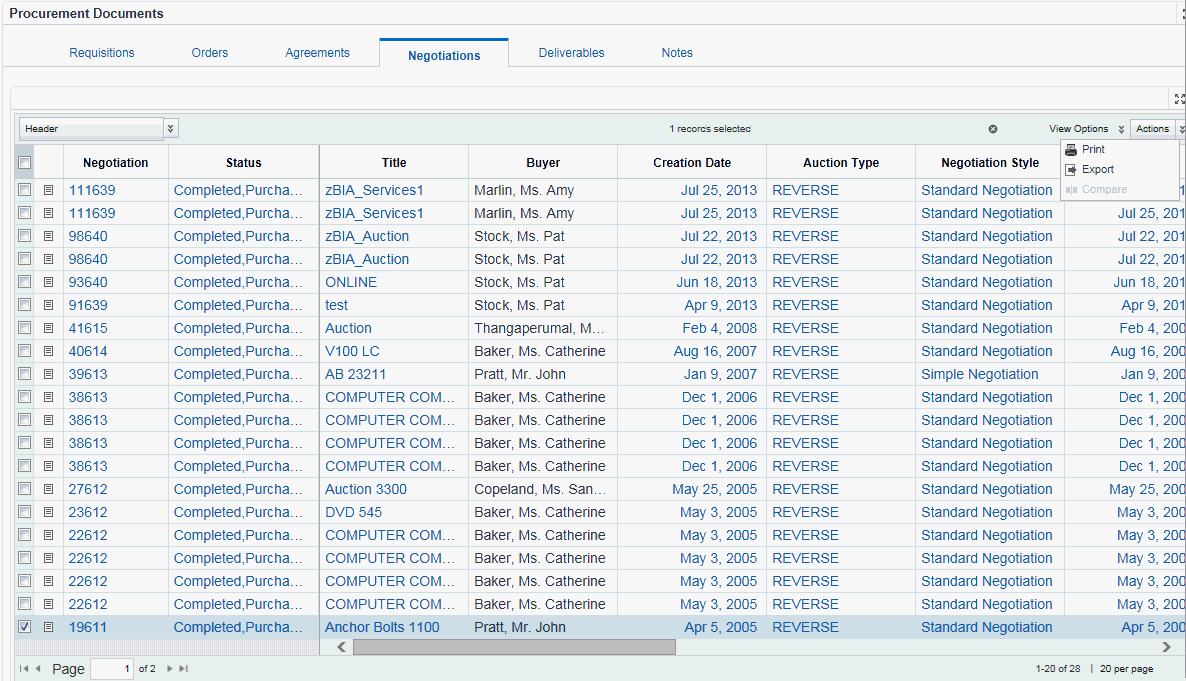
Negotiations tab
The Negotiations tab displays the following options:
-
The Header option displays details such as the negotiation number, the title, the status, the type, the style, the invited supplier count, and the active offers count offers count.
-
The Lines option displays details such as the item number, the item revision, the need by date, the negotiation currency, the negotiation quantity, and the number of responses.
-
The Actions option. For more information, see: Performing Actions for Negotiations.
-
The Responses option displays details such as the response received date, the supplier, the supplier site, and the response value.
You can perform the following actions using the Actions list on the right side of the tab:
-
Print
-
Export
-
Compare
For more information, see:
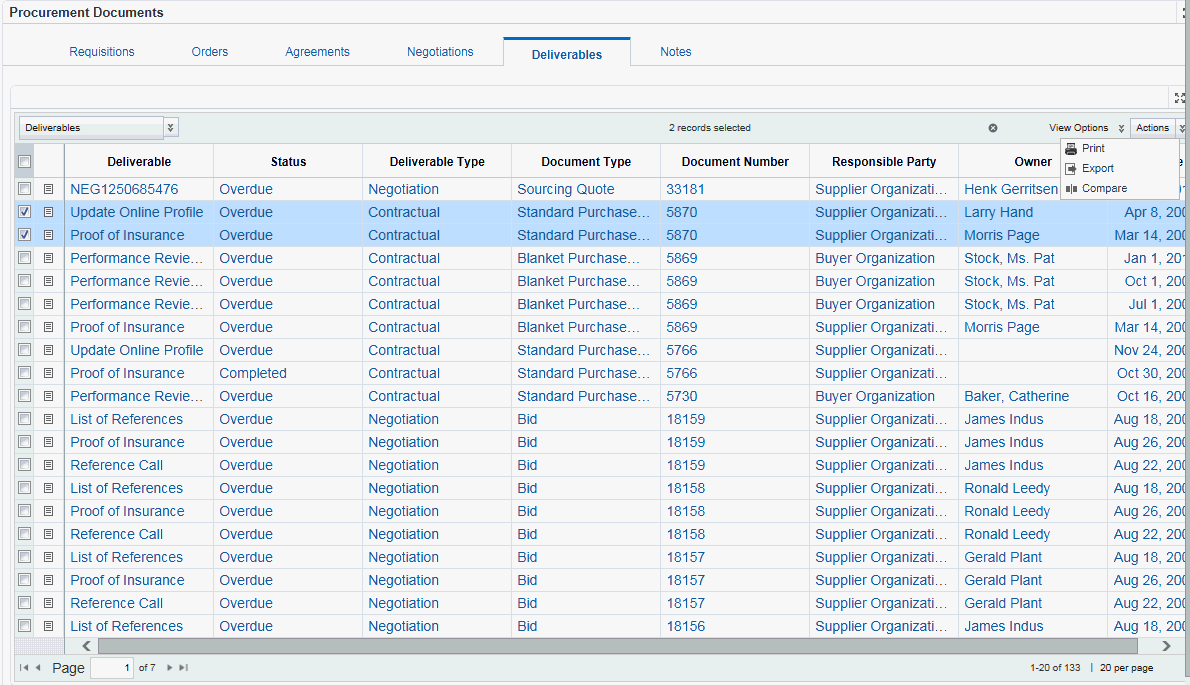
Deliverables tab
You can perform the following actions using the Actions list on the right side of the tab:
-
Print
-
Export
-
Compare
For more information, see:
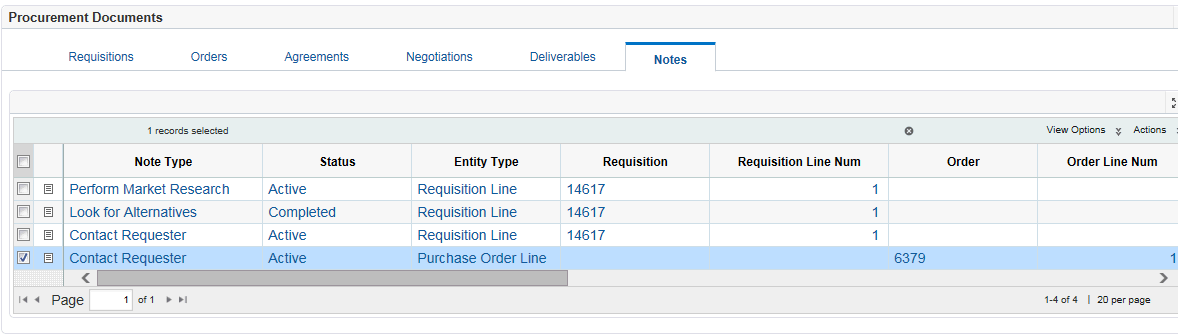
Notes tab
The Notes tab displays information such as the note type, the status, the entity type (the type of purchasing document), and the assignee for each note. You can click the View/Update link for the corresponding note to perform further action.
You can perform the following actions using the Actions list on the right side of the tab:
-
Print
-
Export
-
Compare
For more information, see:
Using Oracle Web ADI in Oracle Procurement Command Center Plus
The Oracle Web Applications Desktop Integrator (Web ADI) integration with Microsoft Excel in Oracle Procurement Command Center Plus enables buyers and procurement managers to update data for multiple purchasing documents at a time. Buyers and procurement managers can select headers, lines, or shipments from multiple purchase orders, make changes in bulk using a spreadsheet interface, and upload the modified data to Oracle Procurement Command Center Plus. Oracle Purchasing automatically submits approval workflows and notifies suppliers of approved changes simultaneously for all modified purchasing documents.
For information about how Oracle Web ADI works, refer to Oracle Web Applications Desktop Integrator Implementation and Administration Guide.
Features
To enable you to add or modify existing purchase order data using Web ADI, Oracle Procurement Command Center Plus delivers the following components in the Procurement Operations dashboard:
-
Orders
The following actions are available on the Orders tab:
-
Bulk Update Headers
-
Bulk Update Lines
-
View Bulk Update Status
-
-
Agreements
The following actions are available on the Agreements tab:
-
Bulk Update Headers
-
View Bulk Update Status
-
View Bulk Update Status
After performing bulk update actions for orders and agreements, you can view the status of your updates using the View Bulk Update Status action. This action is available in the Actions list on the Orders tab and on the Agreements tab, Orders tab, Actions list.
When you click the View Bulk Update Status action, the View Bulk Update Requests page appears. Use this page to view the status of the bulk update.
For more information, see: Performing Bulk Update of Purchase Order Data Using Oracle Web ADI
Performing Bulk Update of Purchasing Data Using Oracle Web ADI
This topic explains how to update data of multiple purchase orders at a time using Oracle Procurement Command Center Plus.
Prerequisite: Before you modify orders or agreements using Oracle Web Applications Desktop Integrator (Web ADI), you must complete the following setup steps based on the versions of Microsoft Excel and Microsoft Internet Explorer versions that you use.
-
Open Microsoft Excel.
-
Select Options and then Trust Center.
-
Select Trust Settings and then Macro Settings.
-
Select Developer Macro Setting.
-
Select Developer Macro Setting.
-
-
Select the macro security settings to enable the macros used by Oracle Web ADI.
-
Select the Microsoft Internet Explorer settings so that you can download the spreadsheets created by Oracle Web ADI to your desktop.
For more information about how to complete the prerequisite steps, refer to Oracle Web Applications Desktop Integrator Implementation and Administration Guide.
Performing Bulk Update of Purchase Order Data
Important: When you select multiple orders or agreements for update, they must belong to the same operating unit. If you select orders or agreements that belong to different operating units, then the application displays an error.
As a buyer:
-
Navigate to one of the following tabs in the Procurement Operations Dashboard:
-
Orders tab
-
Agreements tab
-
-
Select multiple orders or agreements and then select any of the following actions in the Actions list:
-
Orders tab
-
Bulk Update Headers
-
Bulk Update Lines
-
-
Agreements tab
-
Bulk Update Headers
-
The application invokes the Web ADI function.
-
-
Select the integrator viewer. For example, select Excel 2007.
-
Ensure that the Reporting check box is not selected.
-
Download the Microsoft Excel spreadsheet.
-
Enter or modify records in the spreadsheet. The following tables provide information about the fields that you can modify in the spreadsheet for order and agreement headers:
Order Header Fields Column Description Document Style Read-only Operating Unit Read-only Order Number Read-only Supplier Read-only Supplier Site Read-only Buyer Editable list Total Read-only Description Editable, free text Bill to Location Editable list Payment Terms Editable list Default Ship To Editable list Ship Vid Editable list Freight Terms Editable list Note to Supplier Editable, free text Note to Receiver Editable, free text Descriptive Flexfields (DFFs) If your system administrator has configured DFFs, then the DFFs are available. Agreement Header Fields Column Description Document Style Read-only Operating Unit Read-only Order Number Read-only Supplier Read-only Supplier Site Read-only Buyer Editable list Amount Agreed Editable number field. The application validates this information. Effective From Editable date. The application validates this information. Effective To Editable date. The application validates this information. Description Editable, free text Bill to Location Editable list Payment Terms Editable list Amount Limit Editable number. The application validates this information. Default Ship To Editable list Ship Vid Editable list Freight Terms Editable list Note to Supplier Editable, free text Note to Receiver Editable, free text Descriptive Flexfields (DFFs) If your system administrator has configured DFFs, then the DFFs are available. -
Select Upload in the Oracle menu to upload records to the database.
If there are errors during the upload, then the error details can be seen in the Microsoft Excel spreadsheet. Oracle Web Applications Desktop Integrator returns messages to the spreadsheet identifying all rows that contain invalid values. By default, if the data in any row is invalid, then Oracle Web Applications Desktop Integrator does not upload any of the data in the spreadsheet. You must correct all errors to successfully upload the spreadsheet. However, if the integrator provides the Commit Rows upload parameter and you chose the Each Row option, then Oracle Web Applications Desktop Integrator does upload the valid rows. You can correct the errors in any invalid rows and retry the upload for those rows. During the upload process, the Purchase Orders Spreadsheet Import program automatically runs in the background to validate the orders or agreements data that is being imported. The import validation errors can be viewed using the View Bulk Update Status action.
-
Use the View Bulk Update Status action to track the status of the upload and to view any import errors.
Overview of Procurement Manager Actions
Procurement teams and procurement managers can perform actions from the tabs in the Procurement Documents region:
For more information, see:
Performing Actions for Requisitions
From the Procurement Operations dashboard, Procurement Documents region, the procurement team and procurement managers can perform actions for requisitions.
The following actions are available for requisitions:
-
View Requisition: This is a single-row action, which takes you to the Requisition Details page.
-
Analyze Item: This is a single row action, which takes you to the Item Analysis page from where the item on the requisition line can be replaced with another.
-
Analyze Supplier: This is a single row action, which takes you to the Supplier Analysis page from where suppliers or agreements can be selected and the requisition can be completed.
-
Manage Notes: Click View/Update for a requisition to navigate to the Notes page for the requisition line. See: Using Notes in Oracle Procurement Command Center Plus.
You can perform the following actions using the Actions list on the right side of the tab:
-
Print
-
Export
-
Compare
-
Add to Document Builder: This is a multiple row action that adds selected requisitions to the document builder. When you perform this action, the application displays a confirmation message.
-
Reassign Requisitions: This is a multiple row action that reassigns a set of requisition lines from one user to another. When you select this action, the Reassign Requisition Lines page appears.
For more information, see:
Performing Actions for Orders
From the Procurement Operations dashboard, Procurement Documents region, the procurement team and procurement managers can perform actions for orders.
The following actions are available for requisitions:
-
View Order: This is a single row action, which takes you to the Order page in Buyer Work Center.
-
Manage Order Notes: This is a single-row action that takes you to the header-level Notes page. From that page you can perform the required action for the purchase order header. See: Using Notes in Oracle Procurement Command Center Plus.
-
Manage Line Notes: This is a single-row action that takes you to the line-level Notes page. From that page you can perform the required action for the purchase order line. See: Using Notes in Oracle Procurement Command Center Plus.
You can perform the following actions using the Actions list on the right side of the tab:
-
Print
-
Export
-
Compare
-
Place On Hold: This is a multiple row action that places selected orders or shipments on hold.
-
Remove Hold: This is a multiple row action that removes hold on selected orders or shipments.
-
Freeze: This is a multiple row action that places a freeze on the selected shipments or orders. When you select this action, the Freeze page appears.
-
Unfreeze: This is a multiple row action that removes freeze on orders or shipments.
-
Acknowledge: This is a multiple row action that enables you to enter surrogate acknowledgement on behalf of the supplier.
-
Cancel Order: This is a multiple row action that cancels multiple orders of the selected shipments. When you select this action, the Cancel page for order or orders appears.
-
Cancel Shipment: This is a multiple row action that cancels selected shipments. When you select this action, the Cancel page for order or orders appears.
For more information, see:
Performing Actions for Agreements
From the Procurement Operations dashboard, Procurement Documents region, the procurement team and procurement managers can perform actions for agreements.
The following actions are available for requisitions:
-
View Agreement: This is a single row action, which takes you to the Agreement page in Buyer Work Center.
-
Manage Order Notes: This is a single-row action that takes you to the header-level Notes page. From that page you can perform the required action for the purchase order header. See: Using Notes in Oracle Procurement Command Center Plus.
-
Manage Line Notes: This is a single-row action that takes you to the line-level Notes page. From that page you can perform the required action for the purchase order line. See: Using Notes in Oracle Procurement Command Center Plus.
You can perform the following actions using the Actions list on the right side of the tab:
-
Print
-
Export
-
Compare
-
Place On Hold: This is a multiple row action that places selected agreements on hold.
-
Remove Hold: This is a multiple row action that removes hold on selected agreements.
-
Cancel Agreement: This is a multiple row action that cancels selected agreements. When you select this action, the Cancel page for agreement or agreements appears.
-
Freeze: This is a multiple row action that places a freeze on the selected agreements. When you select this action, the Freeze page appears.
-
Unfreeze: This is a multiple row action that removes freeze on orders or shipments.
-
Acknowledge: This is a multiple row action that enables you to enter surrogate acknowledgement on behalf of the supplier.
For more information, see:
Performing Actions for Negotiations
From the Procurement Operations dashboard, Procurement Documents region, the procurement team and procurement managers can perform actions for negotiations.
The following actions are available for requisitions:
-
View Negotiation: This is a single-row action, which takes you to the Negotiation page in Buyer Work Center.
You can perform the following actions using the Actions list on the right side of the tab:
-
Print
-
Export
-
Compare
For more information, see:
Performing Actions for Deliverables
From the Procurement Operations dashboard, Procurement Documents region, the procurement team and procurement managers can perform actions for deliverables.
The following actions are available for deliverables:
View: This is a single-row action, which takes you to the View or Update deliverable page in Buyer Work Center.
You can perform the following actions using the Actions list on the right side of the tab:
-
Print
-
Export
-
Compare
For more information, see:
Performing Actions for Notes
From the Procurement Operations dashboard, Procurement Documents region, the procurement team and procurement managers can perform actions for notes.
The following actions are available for notes:
View/Update: This single-row action takes you to the Notes page for the purchasing document. From that page you can view or update the document. See: Using Notes in Oracle Procurement Command Center Plus.
You can perform the following actions using the Actions list on the right side of the tab:
-
Print
-
Export
-
Compare
For more information, see: