A script enabled browser is required for this page to function properly.
Skip to main content
STA User Interface Guide, v1.0.2
E28380-03
Table of Contents Previous Next Index


Graph Displays : Types of Graphs : Pie Charts

Pie Charts

Pie charts are used to compare percentage values for two or more resources at a point in time. Each section of the pie represents a resource (drive or media) or other category of data, and the size of the section represents the resource’s percentage of the total. To be meaningful, pie charts require graphing at least two resources, as only one resource will take up all of the pie.

Action

Description

Display detailed values

Move the mouse over a section of the pie to display the percentage value in a tooltip. Other sections of the pie are dimmed.

Link to an Overview screen

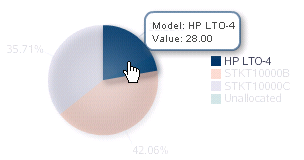
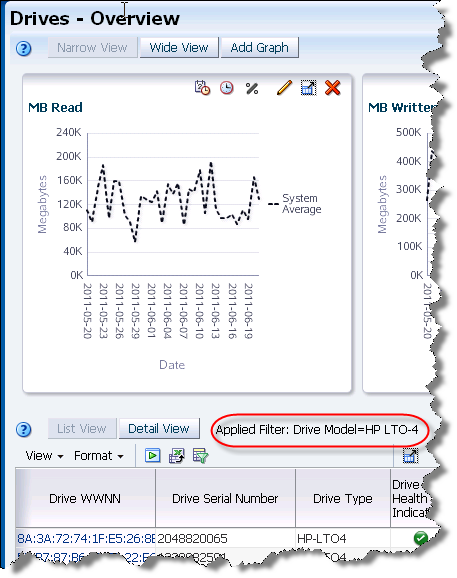
Note – This action is available on the Dashboard only.

Click a pie section to link to the Overview screen for that resource type; in this example, the link is to the Drives – Overview screen. The List View table on the screen indicates that a filter has been applied:

Highlight values

Move the mouse over an area of the legend to highlight that entry in the pie chart. All other entries remain on the chart but are dimmed.

Hide values

Clear a legend key to remove that section from the pie chart. In this example, the “HP LTO‑4” key on the legend is empty to indicate that the section is hidden on the chart.

Restore hidden values

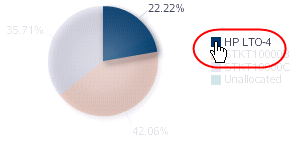
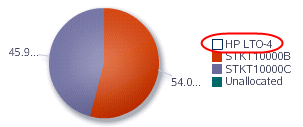
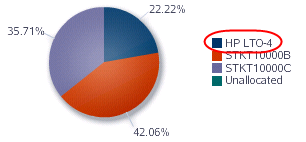
Select an empty legend key (“HP LTO‑4”, in this example) to restore the section to the chart.


Table of Contents Previous Next Index Link to documentation
Copyright © 2012 Oracle and/or its affiliates. All rights reserved.