The Graphics Area of Overview screens consists of the Graphics Area Toolbar and one or more graph panes. Each graph pane also has a Graph Pane Toolbar. When multiple graph panes are displayed, they are tiled, up to three per row. You can display up to 15 graph panes at a time.
You can modify the data displayed on individual graph panes through any of the following actions:
Each graph pane displays values for exactly one drive or media attribute. You can change the displayed attribute by clicking the Change Graphed Attribute icon on the Graph Pane Toolbar and then selecting any of the available attributes for that resource type.
See “Change the Graphed Attribute” for detailed instructions.
By default, most graph panes display values for the previous 30 days. This is a rolling time period which is updated daily. The exception to this is the graph panes on the Libraries – Exchanges screen, which display values for the current date only.
You can change the date range by clicking the Choose Date Range icon on the Graph Pane Toolbar. You can then specify new start and ending dates for the range or a point in time (one day). Date ranges longer than one day are displayed as line graphs. Point-in-time graphs are displayed as bar charts. See “Change the Date Range” for detailed instructions.
Once you have specified a new date range for an individual graph, you can apply that range to all graphs on the screen by clicking the Synchronize Date Range icon. See “Synchronize a Date Range Across All Graphs” for detailed instructions.
By default, the graph panes display actual data values. You can optionally switch to a percentage display, which shows individual resource values as a percentage of the whole. Actual values are displayed as a line graph, and percentage values are displayed as an area graph.
You can switch between actual and percentage value displays by selecting the Show Percentages icon on the Graph Pane Toolbar.
See “Switch Between Actual and Percentage Values – Overview Screens” for detailed instructions.
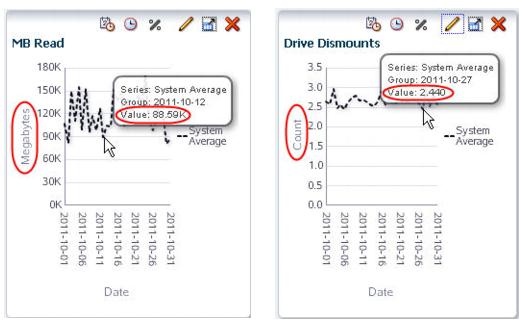
Units of measure are identified on the horizontal and vertical axes of each graph pane. On line and area graphs, which show values over time, time is always shown on the horizontal axis, and the attribute values are shown on the vertical axis. The scale of both axes automatically adjust to provide a useful amount of detail for the values included in the graph.
If the graphed attribute includes a unit of measure, such as MB Read, then the total value of a given data point is the product of the unit of measure included in the attribute multiplied by the unit of measure of the vertical axis. For example, the graph panes shown below use different units of measure on their vertical axes.

When you first bring up an Overview screen, the graph panes display only the system average for their selected attribute. You can compare individual resources to each other and the system average by adding the resources to the graphs. You add individual resources by selecting them on the List View table, and then applying the selection to the graphs. The individual values are then highlighted on the graph, and the system average is ghosted.
You can change the displayed resources simply by selecting different ones and re-applying the selection. If there is no data for a selected resource, no values will appear on the graph, but the resource will be added to the graph key to indicate that it has been selected. When you leave the Overview screen, the selections are cleared, so that when you return, the graph panes again display the system average only.
To clear all resources from the graphs without exiting the screen, you can deselect all resources on the List View table, and then re-apply the selection to the graphs.
See “Add Library Resources to Graphs” for detailed instructions.