 To run the Tornado Chart tool:
In Microsoft Excel with Crystal Ball loaded, open the workbook Reliability.xls.
If you have any other spreadsheets open, close them first, because the tool gathers all Crystal Ball definitions from all open workbooks.
Select Run, then More Tools, then Tornado Chart. (In Microsoft Excel 2007 or later, select More Tools in the Tools group.)
The Specify Target panel opens. All of the forecasts from Reliability.xls are displayed in the list.
The Specify Input Variables panel opens.
You can include any value cell in the tornado chart calculations, using cell names if available. However, the cells are usually defined as one of the following types:
Assumptions — Cells defined as assumptions in Crystal Ball. For more information about assumptions, see About Assumptions and Probability Distributions.
Decision variables — Cells defined as decision variables in Crystal Ball. For more information about defining decision variables, see Defining Decision Variable Cells.
Precedents — All cells within the active worksheet that are referenced as part of the formula or a sub-formula of the target cell. Precedents for this tool are handled differently than standard Microsoft Excel precedents in that they cannot trace beyond the active worksheet. Therefore, you can only use precedents on the active worksheet as input variables.
Available assumptions are displayed in the panel.
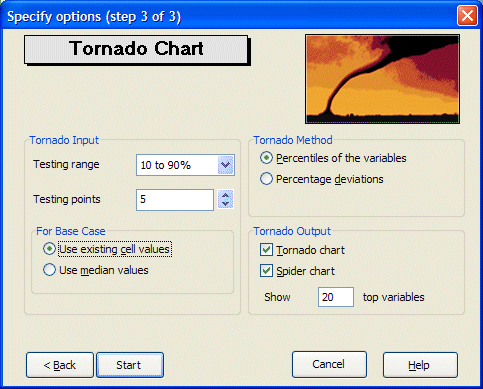
The Specify Options panel opens, similar to Figure 68, Specify Options panel, Tornado Chart tool.
Set the following options as shown in Figure 68, Specify Options panel, Tornado Chart tool:
Testing Range = 10% to 90%.
Testing Points = 5.
For Base Case = Use Existing Cell Values.
Tornado Method = Percentiles Of The Variables.
Tornado Output = Tornado Chart and Spider Chart.
Show __ Top Variables = 20.
The tool creates the tornado and spider charts in their own workbooks with data tables as shown in Figure 69, Tornado Chart with Data and Figure 70, Spider chart with Data.
For more information about the Tornado Chart panels, click Help in a panel.
