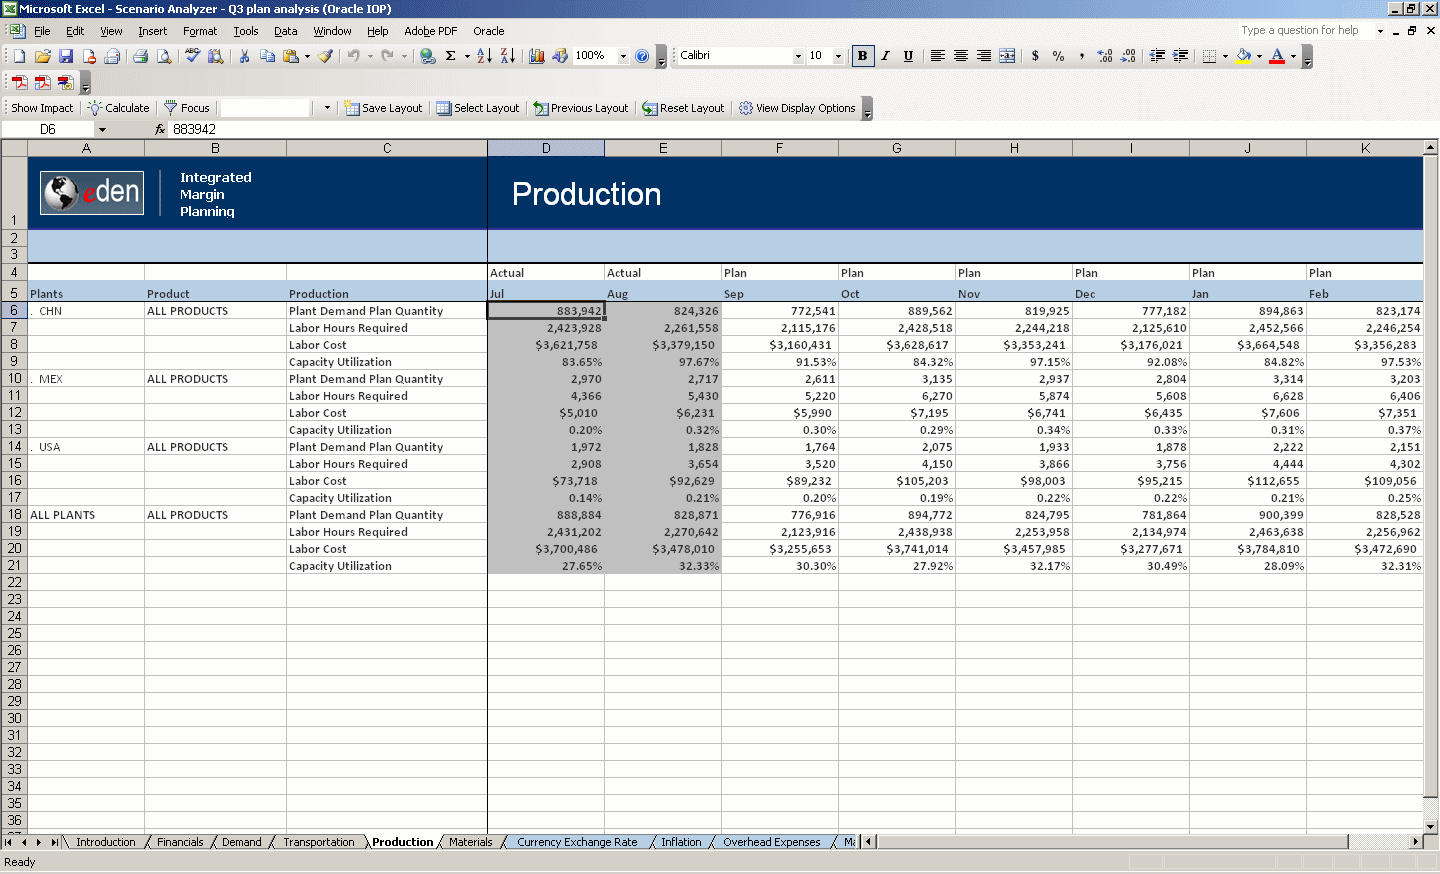
The Production analysis sheet shows finished goods labor costs and capacity plans. The default view shows the following measures:
Plant Demand Quantity—Demand quantity by finished good, plant, and week
Labor Hours Required—Projections on labor hours required based on the plant demand quantity
Labor Cost—Projections on labor cost based on the labor hours required
Capacity Utilization—Projections on capacity used to available capacity
Note: | See Production Cube for detailed information about the predefined content in the Production analysis sheet. |
Right-click an item to change the data display. Table 4 describes the display options available for the items in the Production analysis sheet.
Table 4. Production Items and Their Display Options
| Item in Excel | Display Options |
|---|---|
| Plants | Zoom In Zoom Out Include Parent Show Description |
| Product | Zoom In Zoom Out Include Parent Show Summary Show Product Family Show Product Line Show Product Model Show Description |
| Production | Select Measures Show Summary Show Labor Cost Details Show Capacity Details Show Details Show Debug Measures (available only when you log in as the administrator and user with the IOP Administrator provision) Show Description Show Formula |
| Time Period | Insert/Edit Comment Add to Key Metrics Capacity Details Inventory Details Labor Details Labor Rates Material Details Overhead Cost Breakdown Clear Report |