Analyzing discover Reports
The discover report provides you with information to effectively pinpoint and fix the problems in your source code.
By default, the report is written in HTML format to output-file.html, where output-file is the basename of the instrumented binary. The file is placed in the working directory where you run the instrumented binary.
When you instrument your binary, you can use the –H option to request that the HTML output be written to a specified file, or the –w option to request that it be written to a text file.
After your binary is instrumented, if you want to write the report to a different file for a subsequent run of the program, you can change the settings of the –H and –w options for the report through the SUNW_DISCOVER_OPTIONS environment variable. For more information, see SUNW_DISCOVER_OPTIONS Environment Variable.
Note - If you specify the –a option while instrumenting your code, you must use Code Analyzer or the codean command to read the report.
Analyzing the HTML Report
The HTML report format provides interactive analysis of your program. The data in HTML format can easily be shared between developers using email or placement on a web page. Combined with JavaScript interactive features, this format provides a convenient way to navigate through the discover messages.
This section describes the HTML report, which includes the following tabs:
The Errors tab, Warnings tab , and Memory Leaks tab let you navigate through error messages, warning messages, and the memory leak report, respectively.
The control panel on the left enables you to change the contents of the tab that is currently displayed on the right. See Using the Control Panel.
Using the Errors Tab
When you first open an HTML report in your browser, the Errors tab is selected and displays the list of memory access errors that occurred during execution of your instrumented binary:
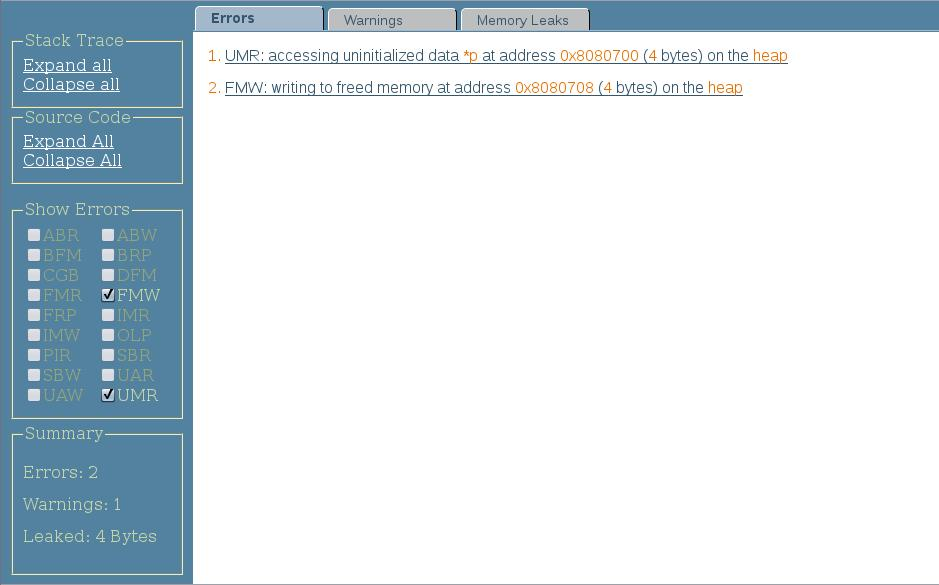
When you click an error, the stack trace at the time of the error is displayed:
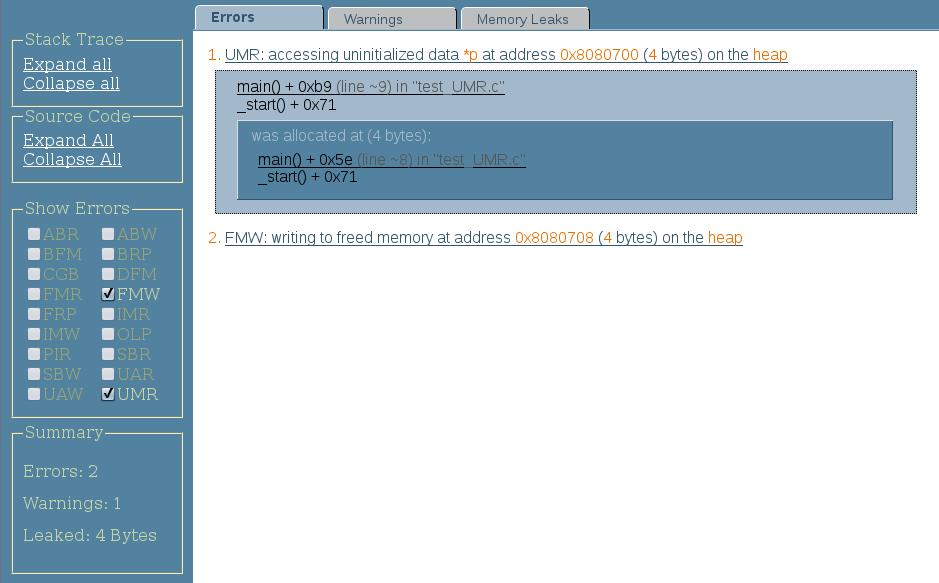
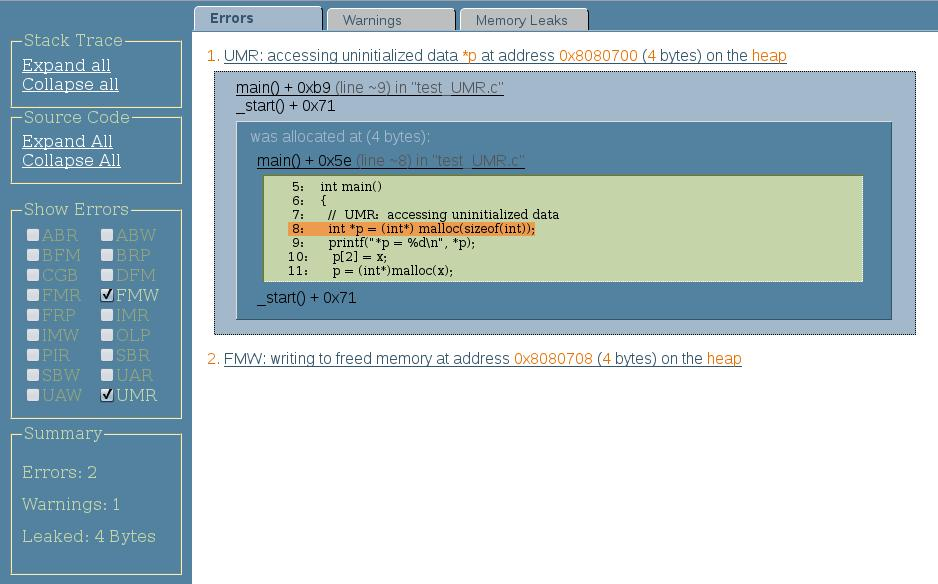
If you compiled your code with the –g option, you can see the source code for each function in the stack trace by clicking the function:
Using the Warnings Tab
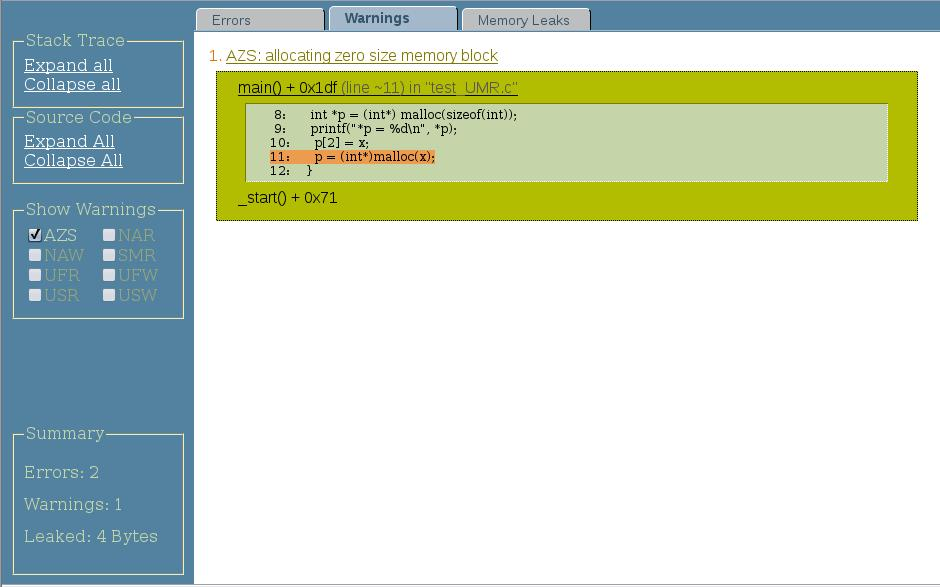
The Warnings tab displays all of the warning messages for possible access errors. When you click a warning, the stack trace at the time of the warning is displayed. If you compiled your code with the –g option, you can see the source code for each function in the stack trace by clicking the function:
Using the Memory Leaks Tab
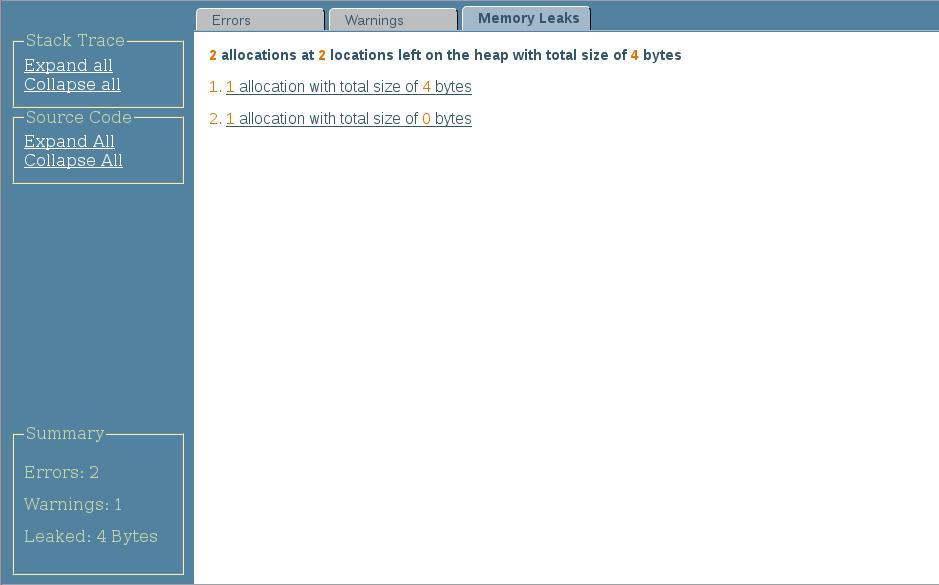
The Memory Leaks tab displays the total number of blocks remaining allocated at the end of the program's run at the top, with the blocks listed below.:
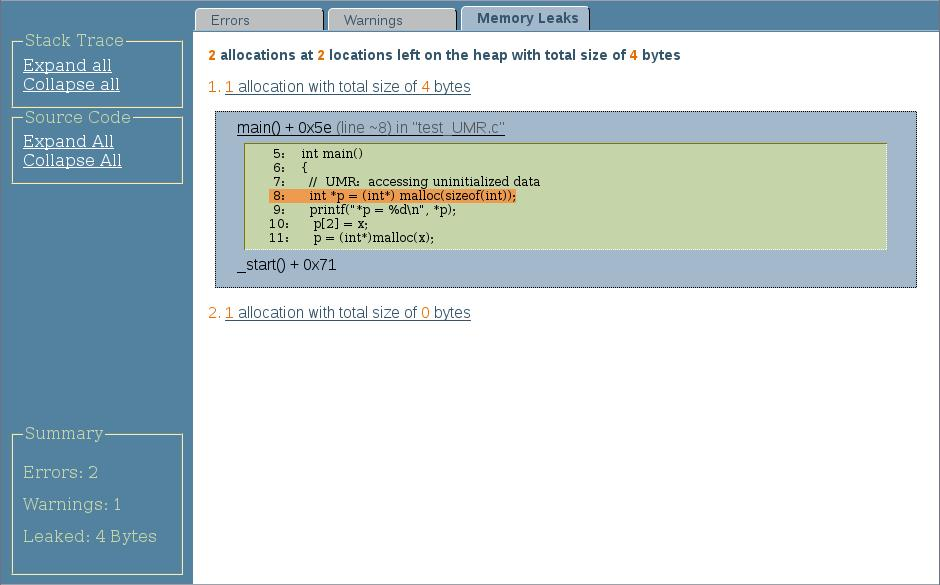
When you click a block, the stack trace for the block is displayed. If you compiled your code with the –g option, you can see the source code for each function in the stack trace by clicking the function:
Using the Control Panel
To see the stack traces for all of the errors, warnings, and memory leaks, click Expand All in the Stack Traces section of the control panel. To see the source code for all of the functions, click Expand All in the Source Code section of the control panel.
To hide the stack traces or source code for all of the errors, warnings, and memory leaks, click the corresponding Collapse All.
The Show Errors or Show Warnings sections of the control panel is displayed when the relevant tab is selected. By default, the options for all of the detected errors or warnings are checked. To hide a type of error or warning, deselect it.
A summary of the report listing the total numbers of errors and warnings, and the amount of leaked memory, is displayed at the bottom of the control panel.
Analyzing the ASCII Report
The ASCII (text) format of the discover report is suitable for processing by scripts or when you do not have access to a web browser. The following example shows a sample ASCII report.
$ a.out

ERROR 1 (UAW): writing to unallocated memory at address 0x50088 (4 bytes) at:
main() + 0x2a0  <ui.c:20>
17:     t = malloc(32);
18:     printf("hello\n");
19:     for (int i=0; i<100;i++)
20:=>    t[32] = 234; // UAW
21:     printf("%d\n", t[2]);   //UMR
22:     foo();
23:     bar();
_start() + 0x108
ERROR 2 (UMR): accessing uninitialized data from address 0x50010 (4 bytes) at:
main() + 0x16c  <ui.c:21>$
18:     printf("hello\n");
19:     for (int i=0; i<100;i++)
20:      t[32] = 234; // UAW
21:=>   printf("%d\n", t[2]);   //UMR
22:     foo();
23:     bar();
24:    }
_start() + 0x108
was allocated at (32 bytes):
main() + 0x24  <ui.c:17>
14:     x = (int*)malloc(size); // AZS warning
15:    }
16:    int main() {
17:=>   t = malloc(32);
18:     printf("hello\n");
19:     for (int i=0; i<100;i++)
20:      t[32] = 234; // UAW
_start() + 0x108
0
WARNING 1 (AZS): allocating zero size memory block at:
foo() + 0xf4  <ui.c:14>
11:    void foo() {
12:     x = malloc(128);
13:     free(x);
14:=>   x = (int*)malloc(size); // AZS warning
15:    }
16:    int main() {
17:     t = malloc(32);
main() + 0x18c  <ui.c:22>
19:     for (int i=0; i<100;i++)
20:      t[32] = 234; // UAW
21:     printf("%d\n", t[2]);   //UMR
22:=>   foo();
23:     bar();
24:    }
_start() + 0x108

***************** Discover Memory Report *****************

1 block at 1 location left allocated on heap with a total size of 128 bytes

1 block with total size of 128 bytes
bar() + 0x24  <ui.c:9>
6:           7:    void bar() {
8:     int *y;
9:=>   y = malloc(128);  // Memory leak
10:    }
11:    void foo() {
12:     x = malloc(128);
main() + 0x194  <ui.c:23>
20:      t[32] = 234; // UAW
21:     printf("%d\n", t[2]);   //UMR
22:     foo();
23:=>   bar();
24:    }
_start() + 0x108

ERROR 1: repeats 100 times
DISCOVER SUMMARY:
unique errors   : 2 (101 total, 0 filtered)
unique warnings : 1 (1 total, 0 filtered)
The report consists of error and warning messages followed by a summary.
ASCII Warning and Error Message Descriptions
The error message starts with the word ERROR and contains a three-letter code, an ID number, and an error description (writing to unallocated memory in the example). Other details include the memory address that was accessed and the number of bytes read or written. Following the description is a stack trace at the time of the error that pinpoints the location of the error in the process life cycle.
If you compiled the program with the –g option, the stack trace includes the source file name and line number. If the source file is accessible, the source code in the vicinity of the error is printed. The target source line in each frame is indicated by the ⇒ symbol.
When the same kind of error at the same memory location with the same number of bytes repeats, the complete message including the stack trace is printed only once. Subsequent occurrences of the error are counted and a repetition count, as shown in the following example, is listed at the end of the report for each identical error that occurs multiple times.
ERROR 1: repeats 100 times
If the address of the faulty memory access is on the heap, then information on the corresponding heap block is printed after the stack trace. The information includes the block starting address and size, and a stack trace at the time the block was allocated. If the block was freed, the report includes a stack trace of the deallocation point.
Warning messages appear in the same format as error messages except that they start with the word WARNING. In general, these messages alert you to conditions that do not affect application functionality but provide useful information that you can use to improve the program. For example, allocating memory of zero size is not harmful but if it happens too often, it can potentially degrade performance.
ASCII Memory Leak Report
The memory leak report contains information about memory blocks allocated on the heap but not released at program exit. The following example shows a sample memory leak report.
$ DISCOVER_MEMORY_LEAKS=1 ./a.out
...
***************** Discover Memory Report *****************

2 blocks left allocated on heap with total size of 44 bytes
block at 0x50008 (40 bytes long) was allocated at:
malloc() + 0x168 [libdiscover.so:0xea54]
f() + 0x1c [a.out:0x3001c]
<discover_example.c:9>:
8:    {
9:=>    int *a = (int *)malloc( n * sizeof(int) );
10:      int i, j, k;
main() + 0x1c [a.out:0x304a8]
<discover_example.c:33>:
32:      /* Print first N=10 Fibonacci numbers */
33:=>    a = f(N);
34:      printf("First %d Fibonacci numbers:\n", N);
_start() + 0x5c [a.out:0x105a8]
...
The first line following the header summarizes the number of heap blocks left allocated on the heap and their total size. The reported size is from the developer's perspective, that is, it does not include the bookkeeping overhead of the memory allocator.
ASCII Stack Trace Report
After the memory leak summary, detailed information is provided on each unfreed heap block with a stack trace of its allocation point. The stack trace report is similar to the one described for error and warning messages.
ASCII Report Summary
The discover report concludes with an overall summary. It reports the number of unique warnings and errors and, in parentheses, the total numbers of errors and warnings, including repeated ones. For example:
DISCOVER SUMMARY:
unique errors   : 3 (3 total)
unique warnings : 1 (5 total)