Collecting and Displaying Static Error Data
When you build a binary using the –xprevise compiler option, the compiler automatically extracts static errors and puts the data in a static subdirectory in a binary-name.analyze directory in the same directory as the source code. For a list of the types of static errors found by the compiler, see Static Code Issues.
-
In your sample directory, build the application by typing the following:
Note - The –xprevise option is synonymous with –xanalyze=code, which is being deprecated.-
On Oracle Solaris:
$ cc -xprevise main.c previse*.c sample1.c sample2.c sample3.c
-
On Oracle Linux:
$ cc -xannotate -xprevise main.c previse*.c sample1.c sample2.c sample3.c
Note - You are not compiling sample4.c for this portion of the tutorial.The static error data is written to the sample/a.out.analyze/static directory.
-
-
Start the Code Analyzer GUI to view the results:
$ code-analyzer a.out &
-
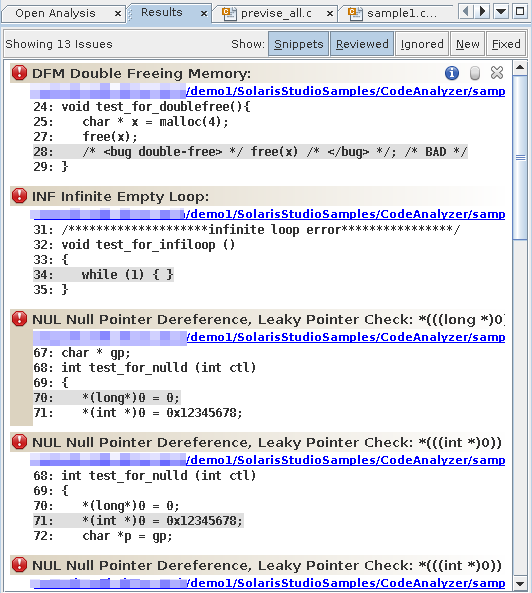
The Code Analyzer GUI opens and the Results tab displays the static code issues found during compilation. The text at the top left of the Results tab indicates that thirteen static code issues were found.

For each issue, the tab displays the issue type, the path name of the source file in which the issue was found, and a code snippet from that file with the relevant source line highlighted.
-
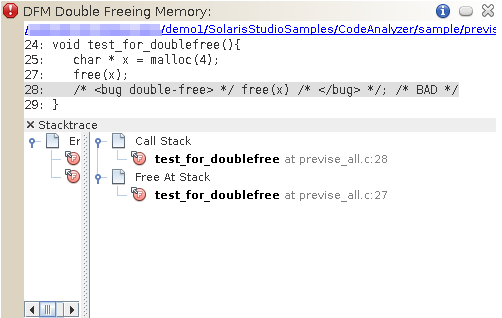
To see more information about the first issue, a Double Freeing Memory error, click the error icon
 .
.The stack trace for the issue opens displaying the error path:

Notice that when you opened the stack trace, the icon in the upper right corner of the issue changed from
 to
to  to indicate that you have reviewed the issue.
Note - You can hide the issues you have reviewed by clicking the Reviewed button at the top of the Results tab. Clicking the button
again unhides the issues.
-
Click the same error icon to close the stack trace.
-
Click the warning icon
 of one of the Uninitialized Memory Read warnings to
open the stack trace.
of one of the Uninitialized Memory Read warnings to
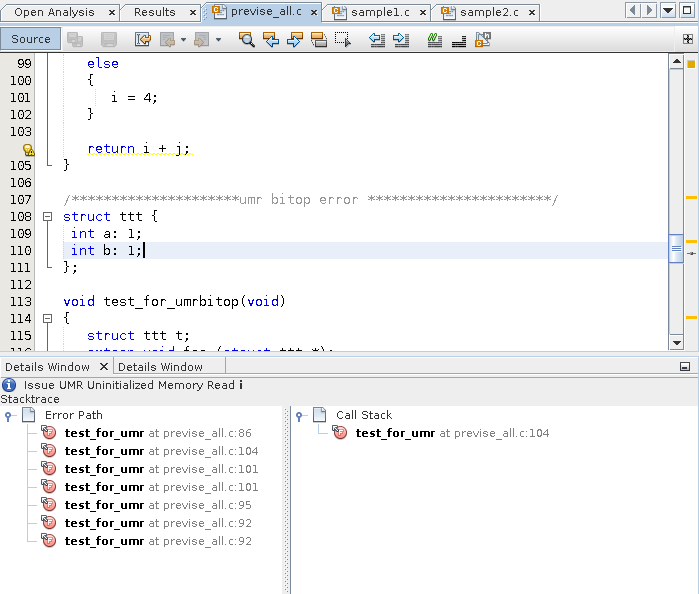
open the stack trace.The error path for this issue contains many more function calls than the one for the Double Freeing Memory issue.
-
Double click the first function call.
The source file opens with that call highlighted. The error path is displayed in a Details Window below the source code.

-
Double-click the other function calls in the error path to follow the path through the code that leads to the error.
-
Click the Info button
 to the left of the issue description to see more
information about the UMR error type.
 A description of the error type, including a code example and possible causes, is displayed in the online help browser.
-
Close the Code Analyzer GUI by pressing the X in the upper right corner.