Collecting and Displaying Code Coverage Data
Regardless of whether you have collected static data or dynamic memory access data, you can compile, instrument, and run your application to collect code coverage data. Note that when you built application with the –g option before you collected dynamic memory error data, you saved a copy of the binary before instrumenting it.
-
Copy the saved binary to instrument for coverage data collection.
$ cp a.out.save a.out
-
Instrument the binary with uncover.
$ uncover a.out
-
Run the instrumented binary to collect the code coverage data.
$ ./a.out
The code coverage data is written to an a.out.uc directory in your sample directory.
-
Run uncover on the a.out.uc directory.
$ uncover -a a.out.uc
The code coverage data is written to the sample/a.out.analyze/uncover directory..
-
Start the Code Analyzer GUI to view the results:
$ code-analyzer a.out &
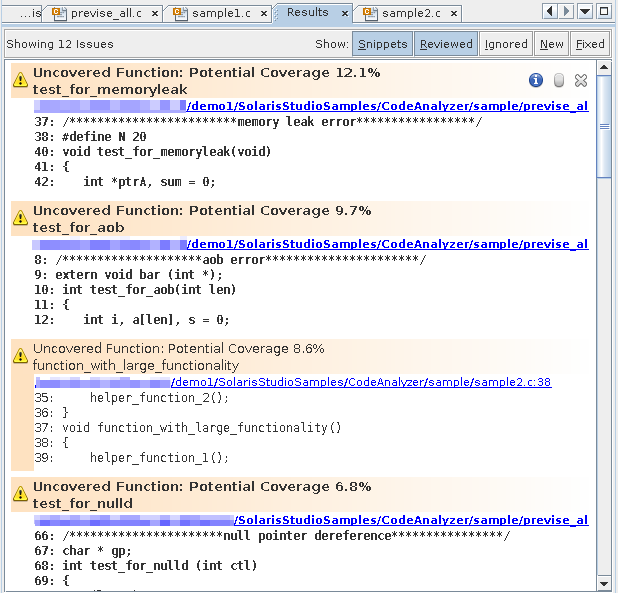
The Results tab shows static issues, dynamic memory issues, and code coverage issues.
-
To filter the results and show just the code coverage issues, select the Coverage option in the Issues tab.
The Results tab now shows just the twelve code coverage issues. The description of each issue includes a potential coverage percentage, which indicates the percentage of coverage that will be added to the total coverage for the application if a test covering the relevant function is added.

Tip - To see all the issues without scrolling up and down, click the Snippets button at the top of the Results tab to hide the code
snippets.
In the Issues tab, nine of the coverage issues are in the previse_all.c source file, three are in sample2.c, and one is in previse_1.c.
-
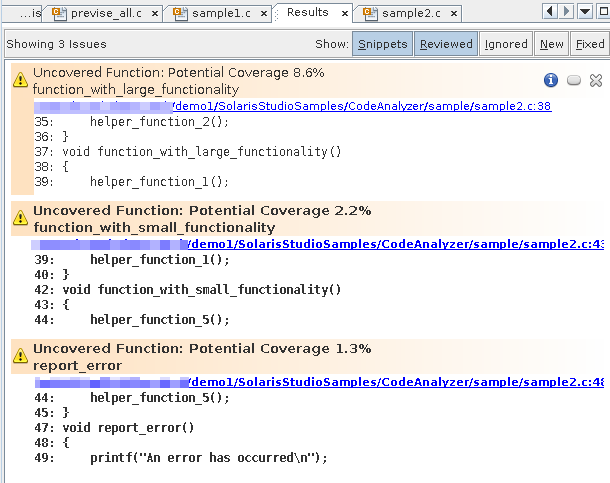
To show just the issues for the sample2.c file, select the option for that file on the Issues tab.
The Results tab now shows just the three code coverage issues found in sample2.c.

-
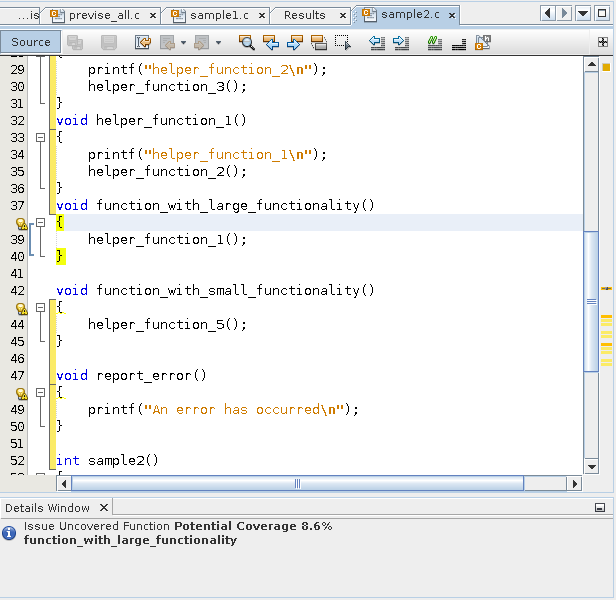
Open the source file by clicking the source file path link in one of issues. Scroll down in the source file until you see the warning icons in the left margin.

Code that is not covered is marked with a yellow bracket.
The coverage issues found in the file are marked with warning icons
 .
.