The maximum number of rows and columns that you can insert depends on the version of Excel you are using. See Microsoft Excel documentation for worksheet size limits.
 To insert a table or pivot table:
Place the cursor at the point in the Excel worksheet, PowerPoint slide, or Word page where you want the table or pivot table to begin.
In the Oracle BI EE Presentation Catalog, right-click a table or pivot table.
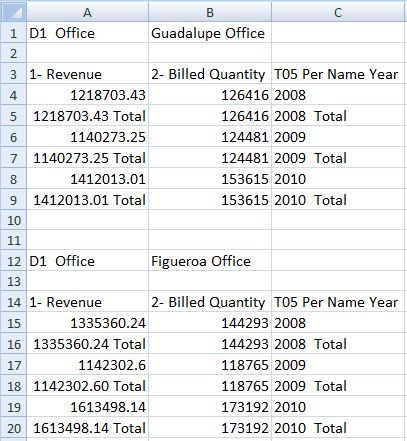
Insert—The selected table view or pivot table view is inserted in the format defined in BI Answers. See Figure 28, Table View Inserted as Table with Formatting from BI Answers and Figure 29, Pivot Table Inserted as a Pivot Table with Formatting from BI Answers,
If prompts are defined for the table or pivot table in BI Answers, the Prompt Selector dialog box is displayed where you make selections on the data to display (otherwise, the table or pivot table is inserted directly). After the initial insert, you may edit the prompts by clicking the Edit Prompts icon in the Oracle BI EE ribbon. See Working with Prompts for more information.
If page prompts are defined for the table or pivot table (view prompts in BI Answers), you may edit them by clicking the Edit Page Prompts icon in the Oracle BI EE ribbon. See Working with Page Prompts.
In Smart View clients, the table is displayed in the form a grid.
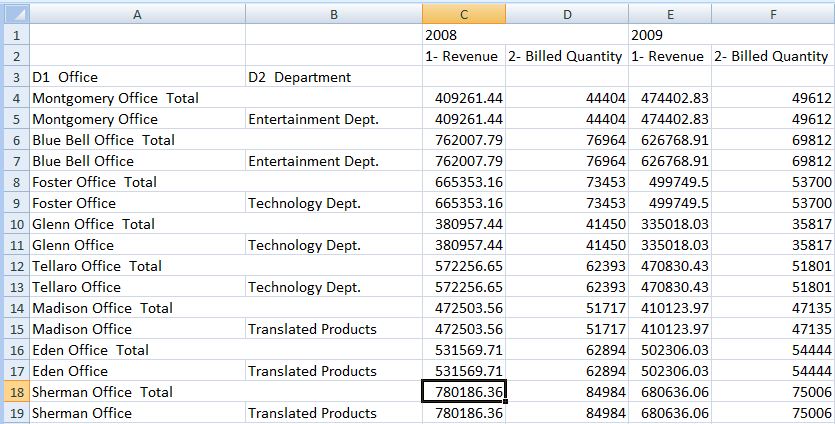
Insert as Excel Table (table views only)—The selected table view is inserted as an Excel table. Columns in the page prompt edge and section edge, if present, are moved to the top of the table as drop-down headings. Select this option when you want to use Excel operations to filter, define formulas, sort, and perform other Excel tasks.
When a table view is inserted as an Excel table, prompts that are defined in BI Answers are not available.
The selected table is inserted on the worksheet. See Figure 30, Portion of a Table View Inserted as an Excel Table.
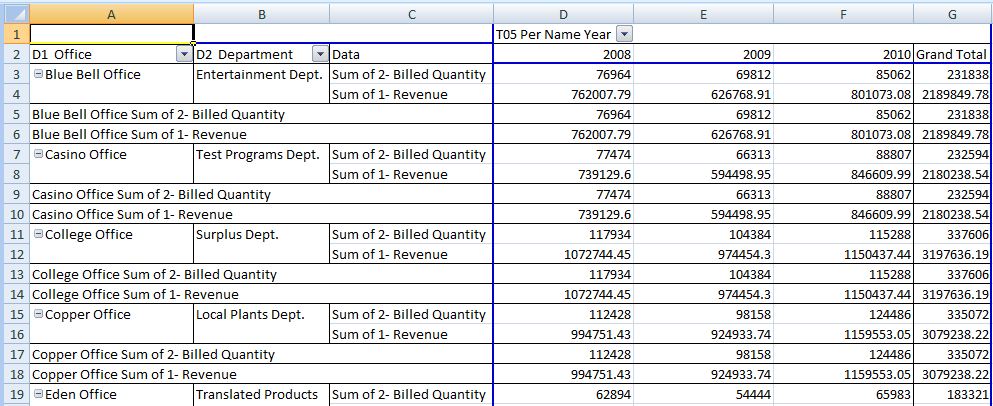
Insert as Excel Pivot (pivot table views only)—The selected pivot table view is inserted as an Excel pivot table. Columns in the page edge and section edge, if present, are mapped to the report filters area, and columns in the measures edge are moved to the values area. Select this option when you want to perform further analysis, such as aggregating, pivoting, drilling, sorting, and filtering.
When a pivot table view is inserted as an Excel Pivot table, prompts that are defined in BI Answers are not available.
The selected table or pivot table is inserted on the worksheet. See Figure 31, Pivot Table Inserted as an Excel Pivot Table.

You can edit tables and pivot tables as described in Editing Views.