Cash flow properties Summary Curves
A summary cash flow curve displays a sub-set of cash flow data from your project or shell. For example, you can aggregate and view:
|
•
|
Forecast data across all commitment curves in a project or shell. |
|
•
|
Data from contracts and schedule sheets. |
|
•
|
Baseline, actuals, and forecast information from contracts and commitments. |
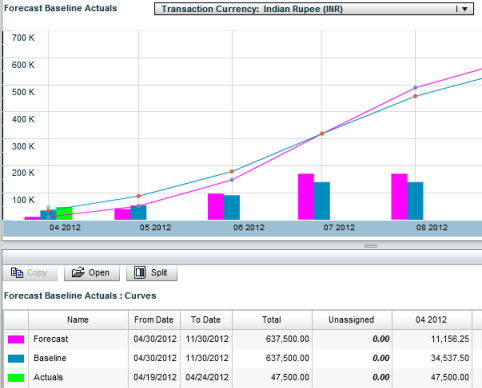
In summary curves, Primavera Unifier aggregates cost data by cash flow data sources, for example, Baseline, Actuals, Forecast, and Portfolio Manager. Primavera Unifier displays summarized cost data in a cash flow worksheet. The main window charts summary data, and the curves window lists each cost data source. You can open a data source and see the source cash flow curves.
You can quickly create cash flow summary curves in the project/shell Cash Flow log. You can manage summary curves in the Manage Summary Curves window.
There are no additional permissions for summary curves; if you can see a cash flow curve, you can add it to a summary curve. After you save it, anyone with View permission can see your summary curve.
To create a summary curve quickly
|
1
|
Open the project or shell where you want to create a summary curve. |
|
2
|
Click Cost Manager > Cash Flow. The Cash Flow log opens. |
|
3
|
In the log, select cash flow curves you want to summarize, and click the Summary button. The Cash Flow worksheet opens. |
If you wish to save the summary curve, proceed to the next step, 4.
Note: When you group commitment curves with different transaction currencies, the summary curve will fall back to the project currency. There may be differences between the value shown in the summary curve and the original curve’s details.
|
4
|
From within the Summary Curve Worksheet window, click File > Save Summary Curve. The Create Summary Curve window opens. |
|
5
|
Enter a name and click the OK button. |
To open a summary curve cash flow window
|
1
|
Open the project or shell where the summary curve exists. |
|
2
|
Click Cost Manager > Cash Flow. The Cash Flow log opens. |
|
3
|
On the Cash Flow log toolbar, click the Summary button drop-down arrow, and select any previously created summary curves listed below Manage Summary Curves. |
Clicking a listed summary curve opens the Cash Flow Worksheet for that summary.
In the cash flow worksheet, in the Curves detail window you can open a data source to see its source cash flows. Data in this mode is read-only.
|
4
|
Click the Close Window button when ready. |
To create a new summary curve using Manage Summary Curves
|
1
|
Open the project or shell where you want to manage a summary curve. |
|
2
|
Click Cost Manager > Cash Flow. The Cash Flow log opens. |
|
3
|
On the Cash Flow log toolbar, click the Summary button drop-down arrow, and select Manage Summary Curves. |
The Manage Summary Curves window opens. You can create new summary curves, or manage existing summary curves.
|
4
|
Click the New button. A new line appears in the Name column of the Manage Summary Curves window. If you have no summary curves, click New to create line 1. |
|
5
|
Enter a name for the summary curve. The default status is Active; you can change this by un-checking the box in the Active column. |
|
6
|
Click the Add button. The Details Curve log opens. The log displays cash flow curves in the project or shell, both active and inactive. |
|
7
|
Highlight the curves you want to include in the summary curve and click Select. Primavera Unifier lists the selected cash flow curves in the Detail Curves window. |
For each curve listed in the Names column you can see the data sources in the Details Curves log.
|
8
|
Click Save to retain changes to summary curves, and click Close Window when finished. |
To manage summary curve content
|
1
|
Open the project or shell where you want to manage summary curve content. |
|
2
|
Click Cost Manager > Cash Flow. The Cash Flow log opens. |
|
3
|
On the Cash Flow log toolbar, click the Summary button drop-down arrow, and select Manage Summary Curves. |
|
4
|
In the Name column, select a summary curve. In the Detail Curves log you can see all source detail curves included in the summary. Add or remove data sources for a summary curve as needed. |
|
5
|
Click Save to retain changes to summary curves, and click Close Window when finished. |
To rename a summary curve
|
1
|
Open the project or shell where you want to rename a summary curve. |
|
2
|
Click Cost Manager > Cash Flow. The Cash Flow log opens. |
|
3
|
On the Cash Flow log toolbar, click the Summary button drop-down arrow, and select Manage Summary Curves. |
|
4
|
Double-click the name of the curve to activate editing, and enter the new name. |
|
5
|
Click the Save button to save changes, and click the Close Window button when ready. |
To copy a summary curve
|
1
|
Open the project or shell where you want to rename a summary curve. |
|
2
|
Click Cost Manager > Cash Flow. The Cash Flow log opens. |
|
3
|
On the Cash Flow log toolbar, click the Summary button drop-down arrow, and select Manage Summary Curves. |
|
4
|
Select a summary curve from the list and click the Copy button. |
|
5
|
Enter a name for the copied curve. |
|
6
|
Click the Save button to save changes, and click the Close Window button when ready. |
To delete a summary curve
|
1
|
Open the project or shell where you want to delete a summary curve. |
|
2
|
Click Cost Manager > Cash Flow. The Cash Flow log opens. |
|
3
|
On the Cash Flow log toolbar, click the Summary button drop-down arrow, and select Manage Summary Curves. |
|
4
|
Select a summary curve from the list and click the Delete button. |
|
5
|
Click the Save button to save changes, and click the Close Window button when ready. |
Oracle Corporation
Primavera Unifier 9.10 • Copyright © 1998, 2012, Oracle and/or its affiliates. All rights reserved.
Copyright Information
Open topic with navigation