| Oracle® Health Sciences Data Management Workbench User's Guide Release 2.3.1 Part Number E35217-02 |
|
|
View PDF |
| Oracle® Health Sciences Data Management Workbench User's Guide Release 2.3.1 Part Number E35217-02 |
|
|
View PDF |
You can view data and discrepancies in three pages:
The following actions are available on all three Listings pages:
In the Listings pages you can view clinical data, create discrepancies identifying possibly flawed data, and view existing discrepancies imported from InForm (queries) or raised by validation (edit) checks or other people. You can create your own custom listings. If necessary, and if you have the required privileges, you can amend clinical data in a controlled way.
To see data listings:
On the Home page, select the study and lifecycle mode if necessary and click Listings.
Under Listings, select the name of the clinical data model you want to view.
In the right-hand panel, select the type of listing you want to view:
Default Listings for access to all study data to which you have access.
Custom Listings to create your own listings.
VC Listings to see discrepancies identified by validation (edit) checks.
Note:
The links for Custom and VC Listings are located at the bottom of the panel.Model Name: Select the clinical data model you want to view. The system displays the tables in that model.
A clinical data model is a set of tables grouped by your company for a purpose. Each study has several data models that store data in exactly the form loaded from the source—InForm or a lab. People in your company then combine and transform that raw data as required for review and analysis in sequence, creating a data model for each purpose and perhaps intermediate data models as well.
Your role may have access to only one model.
Select the table whose data you want to view. The system displays the data, with table column names (items) across the top and a row for each record.
Default listings show all data in all tables in a clinical data model with the exception of blinded, masked data. The most current data in the system is always displayed.
InForm queries are converted to discrepancies and displayed and tracked along with discrepancies created manually or by validation checks.
Records with one or more discrepancies have a yellow rectangle on the left and the word Yes in the DISCREPANCY_EXISTS column. Each data point in the row with a discrepancy is highlighted in yellow.
You can select multiple records using Ctrl+click or Shift+click at the beginning of each row.
You can do all of the following tasks in any Listings page:
Validation checks (edit checks) identify faulty or questionable data; for example, missing or out-of-range values, or values that do not make sense when compared to related values. Validation checks generate a discrepancy against each data point they identify, give the discrepancy a status of either Open or Candidate, and may apply a tag identifying the discrepancy as requiring medical review first. Validation checks may be set up to automatically close discrepancies they created if the underlying data point is fixed. If not, manual resolution is required.
Each validation check tests for a single problem and writes all the open or candidate discrepancies it finds to a single table, which is displayed in VC Listings.
Select a Validation Check under VC Listings to see its results in the main pane.
Validation checks run in batches on a regular basis, set up in the Activities page; see "Viewing and Running Validation Check Batches".
You can do all of the following tasks in any Listings page:
You can view custom listings saved as public and create ad hoc listings.
To view a saved listing, select it in the Custom Listing pane. The system displays the data on the right. The most current data in the system is always displayed, regardless of when the listing was created.
Click the + icon in the Custom Listing pane to create your own listing; see "Using the Query Builder to Create Custom Listings".
You can do all of the following tasks in any Listings page:
To create a new custom listing:
In the Source pane, select the clinical data model whose data you want to view.
Click the Add + icon to create a new custom listing. The Query Details pane appears.
Enter a name and description for the query. The name is displayed on the Listings page; the description is not. The Listings page can display about 25 characters of the name without requiring scrolling to see the whole name. You may want to use a naming convention to make it easier to find queries later.
Select Mark as Public if you want all users with the required security access to the data model and to the Listings pages to be able to view the custom listing produced by this query. The query is not public until you save it.
Select Authorize access to this listing for users without Blind Break rights if you know that only nonblinded data will be displayed in the listing. This option is available only if at least one source table contains blinded data and if you have the required blinding-related privileges.
If any source table is blinded at any level and this attribute is not selected, the system automatically blinds the entire target table, so that by default no data is displayed on the Custom Listings page for this listing. Only a user with the required Blind Break privileges can view the data.
Select Use a Custom Program if you need more complex logic than you can create in the Expression Builder. Then click the Edit icon to select the custom program. See "Defining a Custom Program".
Specify the columns to display; see "Selecting Columns to Display in Custom Listings".
If you need to use data in two or more tables, create joins between the tables; see "Creating Joins".
Specify query criteria; see "Specifying Criteria".
In the Select Columns tab, identify the columns you want to display for each record retrieved by the query. You can give columns a different header for display and combine or write expressions on one or more columns as required. The system creates a SELECT clause for the query based on your specifications.
In the Source pane, expand the node for the table or tables whose data you want to display. in the Custom Listings page for each record retrieved.
Select the columns you want to display. You can use Ctrl+click and Shift+click to select multiple columns at a time. You can also select table to add all its columns, and then remove the ones you do not want to display.
Click the Add (+) icon. The system displays the columns you selected under Selected Columns.
If you want to display a heading for the column different from the column name, enter it in the Alias field.
Expression: Enter the expression, if any, to operate on the column.
To write an expression that operates on multiple columns you must add each column to the same row:
After moving one column into Selected Columns, highlight it there.
Select the second column in the Source pane and click the arrow icon in the Source pane. The system adds the second column to the same row. If you need a third column for your expression, add it the same way.
Enter an alias for the column that will display the results of the expression.
For example, you may want to display the red blood cell count collected three times in a visit and then display the average of the three results. To do this, select the column for red blood cell count in the Source pane four times and add it to Selected Columns. Then select the last one under Selected Columns, select it again under Source and click the arrow icon, and then repeat. All three are now in the same row. Enter an alias such as "RBC Avg" in the row with all three. Then write an expression for each row to populate the first three columns with data from each sample and the last to calculate and display the average. See "Using the Expression Builder".
If you write an expression for multiple columns, the columns must be either in the same table or in joined tables. To create a join, select and add the tables to be joined in the Source pane and then:
Go to the Joins tab and click the Add (+) icon in the Joins pane. The system adds a row.
Click in the row. The system displays two drop-down lists containing the tables in the join.
Select the tables to be joined.
Specify if it is to be an outer join on either the left or right side. Leave the checkbox unselected to create an inner join.
An inner join writes rows to the target table from all source tables only if the rows' data meets the join condition.
An outer join extends the result of a simple join. An outer join returns all rows that satisfy the join condition and also returns some or all of those rows from one table for which no rows from the other satisfy the join condition.
A left outer join returns returns all rows from the first table and only rows meeting the join condition from the second table.
A right outer join returns returns all rows from the second table and only rows meeting the join condition from the first table.
A full outer join returns all rows from both or all tables.
Click the Add (+) icon in the Join Details pane. The system adds a row.
Click in the row. The system displays two drop-down lists containing the columns for each table and another for operators.
Create the Join condition for the Where clause by selecting a column from each table and the operator required. For example, where both tables have a column called USUBJID, select those columns and select an operator of equals (=).
To specify additional Join conditions, click the Add (+) icon in the Join Details pane again as many times as required.
Click OK.
In the Criteria tab, identify the table(s) whose columns you want to operate on to determine which rows to retrieve. The system creates a WHERE clause based on your specifications.
Select the table or tables you need in the Source pane and click the Add icon. If you need to operate on columns from two or more tables in the same expression, add them to the same row:
After moving one table into the Criteria tab, highlight it there.
Select the second table in the Source pan and click the arrow icon in the Source pane. The system adds the second table to the same row in the Criteria tab. If you need a third table for your expression, add it the same way.
Click the edit icon to open the Expression Builder. See "Using the Expression Builder".
You can test the query or view the generated code at any time using these buttons:
Test: The system generates PL/SQL code and displays the records retrieved in the Test Results pane. If the code is invalid, read the log file to find out why.
View Source: The system generates and displays the PL/SQL code resulting from the query you define in the query builder.
Save: The Save process includes validating the code. If the code is invalid, read the log file. The Save process creates a custom program behind the scenes and may take some time. Until you save, the query is a temporary view.
Saved queries are available under Custom Listings. They are available to all users with the required privileges if you mark them as Public.
Note:
In Release 2.3.1 you can only validate a query if you save it, at which point it becomes publicly available. In addition, saved queries cannot be versioned. You must create a new query.Update Status: Select either QC (Quality Control) or Production if you want to see data in those lifecycle areas. When you first save a Custom Listing, the system puts it in the Development lifecycle area.
Delete Query: You can select a query and delete it.
You can edit a query to modify your custom listing. In this case the original version is no longer available for use. If you want to keep the old version as well as the new version, copy the query first; see "Copying Custom Listings".
To edit an existing query, select and click the Edit (pencil) icon.
To use an existing query as the starting point for a new one without losing the original query, select it and click the Save As (floppy disk) icon.
You can use filters to limit the data you see in the Listings pages by setting criteria for the data you want to see.
To open the main Filters window, click the Filter icon in a Listings page: ![]() . Then:
. Then:
Select the filter(s) you want to apply. The drop-down list for each type of filter displays all the public and private filters to which you have access.
To include shared filters, check the Show Filters Shared by Others check box. Shared filters you created are always displayed in the drop-down list, even if this box is unchecked.
Add filters if existing ones do not meet your needs. Click the Add (+) icon for the filter type. Filters you create are private filters unless you make them shared or public. Creating and modifying public filters requires special privileges.
Edit filters: Select the filter from the drop-down list and click the Edit (pencil) icon to see the filter criteria or modify them. You can edit private and shared filters you created, and public filters anyone created if you have special privileges.
Delete saved filters if you no longer need them by selecting a filter and clicking the Delete (X) icon. You can delete filters you created and, if you have special privileges, public filters.
Make your private filters Shared or Public by selecting them and changing the value of the other drop-down list to Shared or Public. Special privileges are required to make filters public. Shared and public filters are available to everyone with the privileges required to view data in the study.
Select Keep Active to keep the filters in effect until you change studies or lifecycle modes, or log out. If you do not select Keep Active and leave the Listings pages, it is no longer in effect when you return. Filters apply only on the Listings pages.
Note:
To save a filter for use after you log out, edit it, give it a name, and save.Filter names must be unique across all private, shared, and public filters that you can see in a particular study and lifecycle.
Click OK to save your changes for the session, Reset to change all filters to Not Set, or Cancel to leave filters in the state they were when you opened the window.
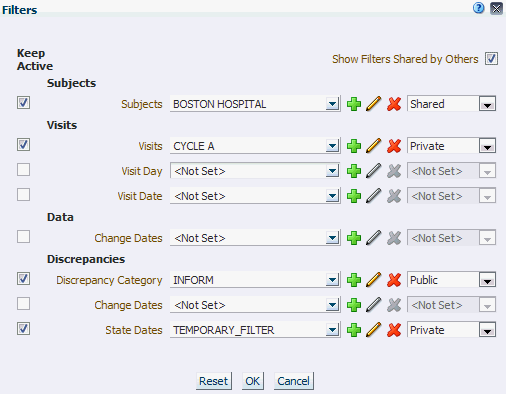
The screenshot below shows the main Filters window with four filters selected. Two are private filters created by the current user, one is a shared filter created by another user, and one is a public filter created by another user with special privileges:
The shared Subjects filter named BOSTON HOSPITAL filters for subjects in the Boston Hospital site.
The private Visits filter named CYCLE A filters for records collected in visits that are part of Cycle A. This private filter has a name and is saved for future use.
The public Discrepancy Categories filter called INFORM filters for discrepancies on data that originated in InForm.
The private Discrepancy State Dates filter is unnamed and unsaved. It filters for records whose discrepancy state changed between specific dates that you can see if you click the Edit icon.
All these filters are applied to the data at the same time, so that the system displays only data that satisfies the criteria for all filters. In the case of the discrepancy filters, the system displays only records with discrepancies that meet the criteria for state change date range and have the InForm category applied.
All filters in the example are set to Keep Active so that as long as the current user stays in the current study and lifecycle, the filters apply, if possible. If the user views data in a table that does not have a column required for the filter—such as a Visit column or Site column in this example—the system ignores that filter.
The following sections describe how to create and edit each type of filter.
See "Defining Tables to Support Filtering in the Listings Pages" for information on filtering requirements.
Subject filters can be defined only in the context of a data model with a Subject Visit Table table. To create a Subject filter:
Filter Driver Data Model: (Required) Select the clinical data model that contains the Subject Visit table that you want the filtering logic to use.
Filter Type: The system displays as many of the following as are included in the Subject Visit table in the selected Driver Data Model. Select one:
Countries—includes or excludes all subjects in one or more countries
Sites—includes or excludes all subjects at one or more clinical sites
Site IDs—includes or excludes all subjects at one or more clinical sites
Investigator Names—includes or excludes all subjects based on their Investigator's name
Investigator IDs—includes or excludes all subjects based on their Investigator's ID
Subject IDs—includes or excludes one subject based on an ID that is unique within the current study
Unique Subject IDs—includes or excludes one subject based on an ID that is unique across all studies
The system displays the column you select and all the columns above it in the list, with the selected column's distinct values.
You can type in all or part of a value above any of the columns to filter the choices displayed.
Select one or more rows to be the filter value.
Enter additional values as required:
Check Exclude Based On Criteria if you want to filter out records that satisfy the criteria rather than displaying only the records that satisfy the criteria. This is the equivalent of adding a "Not" to the query logic.
Filter Availability:
Study Level makes the filter available in all data models in the current study and lifecycle.
Data Model Level makes the filter available only in the current data model and lifecycle.
Filter Name: Enter a name for the filter if you want to save it to use in another session; that is, after you log out or work in a different study. Give it a descriptive name so that you will know if you want to use it or not.
Save. You must save the filter even if you want to use it temporarily.
Visit filters can be defined only in the context of a data model with a table that meets all requirements for a Subject Visit Table. To create a filter for a single visit:
Filter Driver Data Model: (Required) Select the clinical data model that contains the Subject Visit table that you want the filtering logic to use.
Select a filter subtype. The options are:
Visit Cycle
Visit Number
Visit Name
The system displays all three columns with a row for each visit.
You can type in all or part of a value above any of the columns to filter the choices displayed; for example, type the name of a visit cycle to see only visits in that cycle.
Select a row to be the filter value.
Enter additional values as required:
Check Exclude Based On Criteria if you want to filter out records that satisfy the criteria rather than displaying only the records that satisfy the criteria. This is the equivalent of adding a "Not" to the query logic.
Filter Availability:
Study Level makes the filter available in all data models in the current study and lifecycle.
Data Model Level makes the filter available only in the driving data model and lifecycle.
Filter Name: Enter a name for the filter if you want to save it to use in another session; that is, after you log out or work in a different study. Give it a descriptive name so that you will know if you want to use it or not.
Save. You must save the filter even if you want to use it temporarily.
To create a filter based on the visit day in the study design:
In the Condition drop-down, select an operator to be used to select the visit days. The options are:
< Less than
<= Less than or equal to
<> Less than or greater than
= Equal to
> Greater than
>= Greater than or equal to
Between—a time duration between two dates
Is Not Null—has any date value
Is Null—has no date
The system displays 0, 1, or 2 fields depending on which operator you select. Enter visit day numbers as required.
Select a clinical data model that contains a Subject Visit table. This does not restrict you to using the filter only in that model. As you browse data in different models and tables, if the current table does not have a Visit column, the system ignores this filter.
Enter additional values as required:
Check Exclude Based On Criteria if you want to filter out records that satisfy the criteria rather than displaying only the records that satisfy the criteria. This is the equivalent of adding a "Not" to the query logic.
Filter Availability: Study is the only option. The filter is available in all clinical data models that support it in the study, in all life cycle modes.
Filter Name: Enter a name for the filter if you want to save it to use in another session; that is, after you log out or work in a different study. Give it a descriptive name so that you will know if you want to use it or not.
Click OK to save. You must save the filter even if you want to use it temporarily.
To create a filter based on the actual visit date:
In the Condition drop-down, select an operator to be used to select the visit dates. The options are:
< Less than
<= Less than or equal to
<> Less than or greater than
= Equal to
> Greater than
>= Greater than or equal to
Between—a time duration between two dates
Is Not Null—has any date value
Is Null—has no date
The system displays 0, 1, or 2 date fields depending on which operator you select. Enter values as required.
Select a clinical data model that contains a Subject Visit table. This does not restrict you to using the filter only in that model. As you browse data in different models and tables, if the current table does not have a Visit column, the system ignores this filter.
Enter additional values as required:
Check Exclude Based On Criteria if you want to filter out records that satisfy the criteria rather than displaying only the records that satisfy the criteria. This is the equivalent of adding a "Not" to the query logic.
Filter Availability: Study is the only option. The filter is available in all clinical data models that support it in the study, in all life cycle modes.
Filter Name: Enter a name for the filter if you want to save it to use in another session; that is, after you log out or work in a different study. Give it a descriptive name so that you will know if you want to use it or not.
Click OK to save. You must save the filter even if you want to use it temporarily.
Available only on the Default Listings page, the Data Change Date filter displays records whose most recent update occurred during the time period specified. To create a Data Change Date filter:
In the Condition drop-down, select an operator to be used to select the dates. The options are:
< Less than
<= Less than or equal to
<> Less than or greater than
= Equal to
> Greater than
>= Greater than or equal to
Between—a time duration between two dates
Is Not Null—retrieves all records; there is always a value for last-changed-date. If the record has not been updated, it is the same as the creation date.
Is Null—retrieves no records
The system displays 0, 1, or 2 date fields depending on which operator you select. Enter values as required.
Enter additional values as required:
Check Exclude Based On Criteria if you want to filter out records that satisfy the criteria rather than displaying only the records that satisfy the criteria. This is the equivalent of adding a "Not" to the query logic.
Filter Availability: Study is the only option. The filter is available in all clinical data models that support it in the study, in all life cycle modes.
Filter Name: Enter a name for the filter if you want to save it to use in another session; that is, after you log out or work in a different study. Give it a descriptive name so that you will know if you want to use it or not.
Click OK to save. You must save the filter even if you want to use it temporarily.
Available only in the Default Listings page, the Discrepancy Category filter displays only records that have one or more discrepancies of the categories specified.
To create a Discrepancy Category filter:
In the Discrepancy Categories drop-down, select one or more categories to be used to filter, or click All and then deselect categories you do not want to use.
Your company defines the categories that are available.
Check Include *(No Category)* if you want the filter to include or exclude discrepancies with no assigned category.
Enter additional values as required:
Check Exclude Based On Criteria if you want to filter out records that satisfy the criteria rather than displaying only the records that satisfy the criteria. This is the equivalent of adding a "Not" to the query logic.
Filter Availability: All Studies is the only option. The filter is available in all clinical data models that support it in all studies, in the current life cycle mode.
Filter Name: Enter a name for the filter if you want to save it to use in another session; that is, after you log out or work in a different study. Give it a descriptive name so that you will know if you want to use it or not.
Click OK to save. You must save the filter even if you want to use it temporarily.
Available only in the Default Listings page, the Discrepancy Change Date filter displays records that have one or more discrepancies whose most recent update ocurred during the time period specified. To create a Discrepancy Change Date filter:
In the Condition drop-down, select an operator to be used to select the dates. The options are:
< Less than
<= Less than or equal to
<> Less than or greater than
= Equal to
> Greater than
>= Greater than or equal to
Between—a time duration between two dates
Is Not Null—retrieves all records; there is always a value for last-changed-date. If the record has not been updated, it is the same as the creation date.
Is Null—retrieves no records
The system displays 0, 1, or 2 date fields depending on which operator you select. Enter values as required.
Enter additional values as required:
Check Exclude Based On Criteria if you want to filter out records that satisfy the criteria rather than displaying only the records that satisfy the criteria. This is the equivalent of adding a "Not" to the query logic.
Filter Availability: All Studies is the only option. The filter is available in all clinical data models that support it in the study, in all life cycle modes.
Filter Name: Enter a name for the filter if you want to save it to use in another session; that is, after you log out or work in a different study. Give it a descriptive name so that you will know if you want to use it or not.
Click OK to save. You must save the filter even if you want to use it temporarily.
Available only in the Default Listings page, the Discrepancy State Date filter displays only records that have one or more discrepancies whose most recent state change occurred during the time period specified. To create a Discrepancy State Date filter:
In the Condition drop-down, select an operator to be used to select the dates. The options are:
< Less than
<= Less than or equal to
<> Less than or greater than
= Equal to
> Greater than
>= Greater than or equal to
Between—a time duration between two dates
Is Not Null—retrieves all records; there is always a value for last-changed-date. If the record has not been updated, it is the same as the creation date.
Is Null—retrieves no records
The system displays 0, 1, or 2 date fields depending on which operator you select. Enter values as required.
Enter additional values as required:
Check Exclude Based On Criteria if you want to filter out records that satisfy the criteria rather than displaying only the records that satisfy the criteria. This is the equivalent of adding a "Not" to the query logic.
Filter Availability: All Studies is the only option. The filter is available in all clinical data models that support it in the study, in all life cycle modes.
Filter Name: Enter a name for the filter if you want to save it to use in another session; that is, after you log out or work in a different study. Give it a descriptive name so that you will know if you want to use it or not.
Click OK to save. You must save the filter even if you want to use it temporarily.
On the Listings pages you can use the Find feature to search on values in the columns of the current table.
Click the Find icon: ![]() . The Find window opens, displaying an enterable field for all searchable columns in the table currently displayed in the Listings page.
. The Find window opens, displaying an enterable field for all searchable columns in the table currently displayed in the Listings page.
Enter or select the values you want to search for, and click one:
Any: finds records that satisfy at least one Find criterion.
All: finds only records that satisfy all Find criteria.
Alternatively, click Advanced. Any values you have already entered remain in effect. Advanced Find allows you to use operators on each column:
Number operators: Equals, Does not equal, Less than, Less than or equal to, Greater than, Greater than or equal to, Between, Not between, Is blank, Is not blank.
Character (alphabetic) operators: Starts with, Ends with, Equals, Does not equal, Less than, Less than or equal to, Greater than, Greater than or equal to, Between, Not between, Contains, Does not contain, Is blank, Is not blank.
Date operators: Equals, Does not equal, Before, After, On or before, On or after, Between, Not between, Is blank, Is not blank.
Then enter a value or values to search on.
Click:
Search to find the criteria you have specified.
Reset to remove all criteria.
Add Fields (available in the Advanced window only): If you want to search for additional values in the same column, you can add another listing for the column and specify an operator and value in both the originally displayed field and the new one; for example, Site Country contains US or (Any) Site Country contains CANADA.
If you find faulty or questionable data, you can create a discrepancy against it in any of the Listings pages. If you build a query that detects multiple data points with the same flaw, you can select all of them and create a discrepancy against them all at the same time.
Once created, a discrepancy is visible everywhere its underlying data point is visible, including in other data models and listings. Discrepancies against lab data can be exported to a file and sent to the lab.
To create a discrepancy:
In the Listings page, select the record or records against which you want to create a discrepancy. Select records with the same type of problem so that the discrepancy text can be the same for all selected records.
Click Create Discrepancy.
Enter values:
Discrepancy:Enter text that describes the problem with the data or the action required; for example, "Diastolic blood pressure is not within the specified range. Please confirm or correct."
The system generates an ID beginning with "DMW" followed by numbers and adds it to the beginning of this text when you save. This ID is required for internal processing.
Category: Select from the list, according to your company's policy. You can use the category as a filter in the Discrepancies page.
State: Select Open or Candidate, according to your company's policy. Candidate discrepancies require manual review before being moved to an Open status and then being resolved.
Data Model: The system displays the current data model.
Discrepancy Count: They system displays the number of discrepancies currently open on the same data point.
Append User Name: Select the check box to append your username to the discrepancy text, which ensures that it is visible in InForm and at labs. Your username is stored in the database regardless of this setting and is displayed in the History pane of the Discrepancies page.
This check box may be inactive, depending on a systemwide profile setting; see the Oracle Life Sciences Data Hub System Administrator's Guide.
Click OK.
To see all discrepancies associated with a particular data point, select the data point and click Show Discrepancies. For each discrepancy the system displays:
Icon showing the current state of the discrepancy:
Discrepancy ID
Discrepancy: Text that describes the problem with the data or the action required.
Tag: The tag currently applied to the discrepancy, if any.
Latest Comment: People can communicate with comments about a discrepancy. The latest one is displayed.
To see the complete discrepancy history and to take action on discrepancies, go to the Discrepancies page.
Records that have at least one flag assigned have a Flag icon displayed to the left of the row:
To see all flags assigned to a record and their values, select the record and click Show Flags. You can click the Name column header to order the flags alphabetically by name or the Value column header to order the flags by value.
InForm form and section states are imported as flags. You cannot change these flag assignments in Oracle DMW. Each InForm flag has two states: Yes and No (Y and N). They have the same names that they do in InForm plus the prefix "Inf_":
Inf_SDVReady
Inf_SDVPartial
Inf_SDVComplete
Inf_Locked
Inf_Frozen
Inf_Signed
Inf_Complete
Inf_MissingItem
Inf_HasQueries
Inf_HasComments
Inf_HasData
Inf_NotDone
Inf_Deleted
Inf_DeletedDynamicForm
Flags that do not being with "Inf" are custom flags created by your company. You can apply these flags to records as required. Validation checks can also apply them.
Use flags to filter data and to track data states. You can apply any number of flags to a record, but only one flag value at a time. Your company creates flags as needed; see "Creating and Using Flags".
Assign Flag To assign a flag to a record:
Select a record and click Assign Flags.
Select the flag to assign.
Select the flag state value to assign.
The system does not preserve a history of flag assignments.
Note:
The Assign Flag button is active only if flags have been defined for the current data model type and if you have the privileges required to assign flags to data.Select a record and click Assign Flags.
Select the flag to remove.
Select Clear Flag at the bottom of the list of flag states.
A single data point—for example, a subject's weight—appears first as loaded from InForm or a lab and then in subsequent downstream clinical data model. The column name may change from one model to the next—for example, from WT to WEIGHT—and the value may be converted to different units and used to derive other values, such as Body Mass Index (BMI). You can trace each data point's trail; for example, from the WEIGHT value in kilos in the Review model you can see the same value as WT in pounds in the InForm input model upstream and the BMI in the Analysis model downstream.
Note:
You can create a discrepancy against a data point in any clinical data model and the system will immediately display the discrepancy against the corresponding data points upstream and downstream. See "How the System Tracks Data Lineage" for more information.To view data lineage of a data point:
Select the data point.
Select one:
View Source Data to see upstream data that contributed to the selected data point. The system traces back as far as the input data model that receives data in the same structure as in the source system.
View Target Data to see downstream data that the selected data point contributes to.
View Preferred Path to see upstream data designated as the preferred path for sending related discrepancies back to the source system. If there are multiple source data points, one must be designated as preferred when the discrepancy is created. The system displays the discrepancy on the data points in the preferred path.
Click Trace Data Lineage. A pop-up window displays the selected data point in the top row. Expand its node to see the immediate source (upstream) or target (downstream) data point. Expand that node to see its immediate source or target data point, and so on.
If there are multiple immediate source or target data points, they are all displayed at the same level of indentation.
Trace Data Lineage Display For each data point in the path, the window displays:
Name: The item or column name preceded by its table name and data model name: data_model_name.table_name.column_name.
Unlabeled Blinding Column: If a dollar sign ($) is displayed, the data point may show mask values instead of real data.
Unlabeled Incomplete Lineage Column: If an asterisk (*) is displayed, the system cannot display a data point and the rest of its path. This may be because:
The data point has been deleted or unmapped.
You do not have the privileges required to view the data point, either because you do not have access to view its table at all or because the table is fully or partially blinded and you do not have the required blinding-related privileges.
Data Type: show the item's data type
Preferred Path: Yes if the data point is on the preferred path or the only path; No if there are multiple paths and this data point is not on the preferred one.
Primary Key: displays the primary key values of the record, in column order as column1_name:column1_value,column2_name:column2_value,column3_name:column3_value and so on.
Sensitive data in certain columns, rows, cells, or whole tables may be blinded and require special privileges to view. If you have the required privileges, the View Sensitive Data button is active. If you click the button you see the real data. The system records each such blind break in a non-modifiable audit trial.
When you select Export All to Excel the system generates an .xls file including all records currently displayed, and puts it in the location you specify. You can send the file to the lab as is or open it first in Microsoft Excel.
Sort and filter records as required onscreen before exporting.
Note:
In the Listings page, Export All to Excel includes all data currently displayed. This is different from the Discrepancies page, where the Export to Excel button includes all discrepancies.When you select Export All to CSV the system generates a .csv (comma-separated values) file including all records currently displayed, and puts it in the location you specify. You can send the file to the lab as is or open it first in Microsoft Excel.
Sort and filter records as required onscreen before exporting.
|
Copyright © 2013, Oracle and/or its affiliates. All rights reserved. Legal Notices |
|