| Oracle® Retail Assortment and Space Optimization User Guide Release 14.1 E59122-01 |
|

 Previous |
 Next |
| Oracle® Retail Assortment and Space Optimization User Guide Release 14.1 E59122-01 |
|
Previous |
Next |
This chapter describes the use of the Assortment List tab.
The Assortment List tab has one table that presents a list of all available assortments in ASO. You can use this information to view descriptive information and the status of each of the listed assortments. Use the Refresh icon to update the display.
You can also access the Assortment Analysis functionality from the Assortment List tab. You use the Assortment Analysis screen to determine how much of an assortment has or has not been optimized, to analyze the results of the optimizations, and to finalize and export your work.
The Assortment List is shown in Figure 2-1.
It contains the following columns.
Table 2-1 Assortment List
| Field | Description |
|---|---|
|
Name |
The display name for the assortment. |
|
Goal |
The goal of the assortment. |
|
Role |
The role of the assortment. |
|
Tactic |
The tactic of the assortment. |
|
Received On |
The date the assortment was received. |
|
Last Updated By |
The user ID of the person who most recently updated the assortment. |
|
Last Update |
The date when the assortment was most recently updated. |
|
Location Level |
The location level for the assortment (Cluster Assortment, Store Assortment, or Space Cluster). This is the level at which the assortment data is delivered. Products are delivered once for all stores within a cluster (Cluster assortment) or once for every store (Store assortment) |
|
Status |
The status of the assortment in terms of space optimization. Values include Finalized, Exported, Ready for SO, and POG mapping needs review. Select any assortment with a status of Finalized or Ready for SO in order to display that assortment in Assortment Analysis. |
|
Run Count |
The total number of existing optimization runs (regardless of status) that have occurred, based on a planogram set that is included in the assortment. |
|
Trading Area |
The trading area for the assortment. |
|
Product Category |
The product category for the assortment. |
The Rollback functionality is available from the Action drop-down menu.
If the current status of the assortment is Exported, the status rolls back to Finalized. After the rollback from Exported, the assortment is not available to external application (as it was when it had a status of Exported).
You cannot roll-back any run. If an assortment is in Finalized status, you will not be able to create any new runs based on POG sets within that assortment so you must roll the assortment back to Ready for SO status, create more optimization runs, and finalize again if necessary.
An assortment cannot be part of an assortment set that has been finalized. In such cases, the rollback menu option is disabled.
When you roll back an assortment to Ready for SO, you cannot export it but you can finalize eligible runs that are associated with the assortment that were not finalized before. In addition, once you have rolled the assortment back to Ready for SO, you can create new runs that are based on planogram sets associated with the assortment, something you cannot do when the assortment is in status of Finalized or Exported.
Assortment Analysis is available for an assortment if one or more of the runs associated with that assortment have been approved. Such runs have a status of Approved or Finalized. Category Management users and SO analysts have permission to conduct this analysis. The SO Super User can access this screen as read-only.
The Assortment Analysis screen can be used to:
determine how much of a specific assortment has not been optimized
examine the aggregated results of the approved runs for a specific assortment
finalize the optimized results
export the results
To access Assortment Analysis, select an assortment from the Assortment List that has a status of Ready for SO or Finalized. You see the Assortment Analysis screen. This screen consists of three distinct areas.
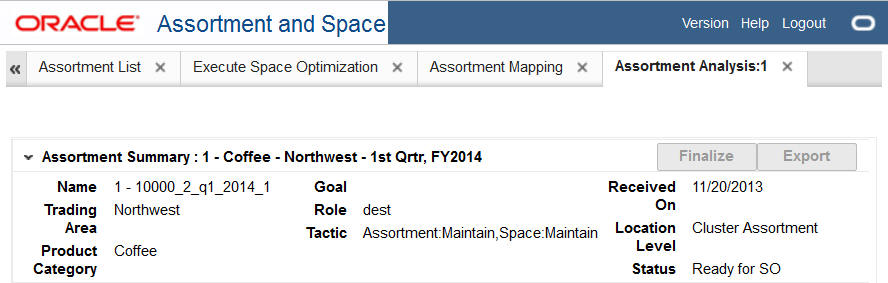
Assortment Summary
This section of the Assortment Analysis screen, shown in Figure 2-2, displays a subset of the information contained in the Assortment List. The information describes the assortment you selected.
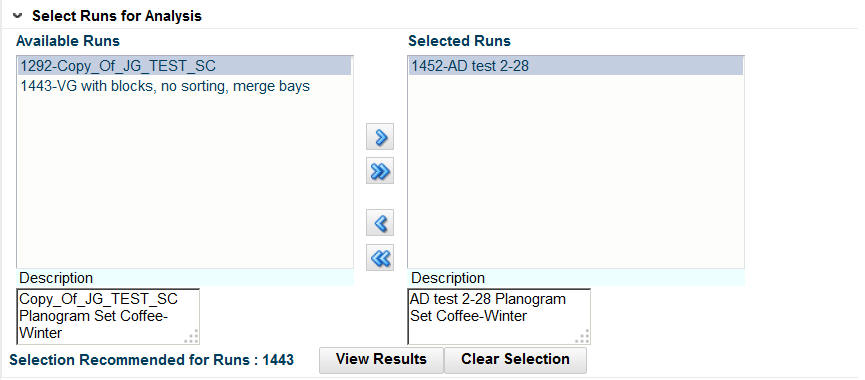
Select Runs for Analysis
This section, shown in Figure 2-3, displays the runs for the assortment you selected. The Available Runs lists all the runs associated with the assortment whose status is Approved or Finalized. Only approved or finalized runs appear here. The Selected Runs lists the runs whose results you are interested in viewing. are interested to be considered to generate the assortment optimization results. Overlaps may exist across selected runs. In that case, results from the most recently approved or finalized run take precedence over other runs with the same sku/store combination.
The Selected Runs list is also used to control which runs become finalized. If you select more than a run that covers the same product/location, you will only see results from the run with the most recent results data.
To move all runs from the Available Runs list to the Selected Runs list, click the double arrow.
To move a select group of runs from the Available Runs list to the Selected Runs list, highlight the run or runs you want in the Available Runs list and click the single arrow.
To moves runs from the Selected Runs list to the Available Runs list, you should reverse this process.
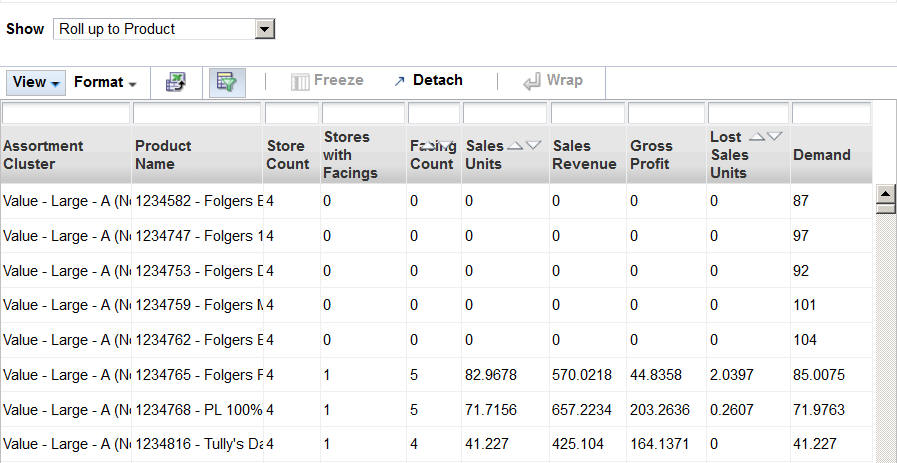
Run Results
To display the results of a run in the Run Results table, shown in Figure 2-4, highlight the run and click the View Results button. (Note that some columns are hidden so that the figure fits on the page.)
By default, the results are displayed for all data. To display the data at different levels of aggregation, use the Show drop-down list. You can choose from the following options:
All data
Roll up to Assortment Cluster (a single line is displayed for the entire cluster)
Roll up to Product. Product: Results are displayed at the Assortment Cluster/Product level. You see one line for each product within each cluster.
Roll up to Planogram Set. Results are displayed at the Assortment Cluster/Product/Planogram Set level. You see one line for each planogram set that a product belongs to within an assortment cluster.
To clear the display, click the Clear Selection button. This clears the results from the results table and moves all of the runs in the Selected Runs list back into the Available Runs list (resets the user selection).
Results Table
The Results Table displays the following information at the aggregation level you selected. Note that each aggregation level displays only a subset of the information listed in Table 2-2.
Table 2-2 Results Table
| Column Name | Description | Displayed at Aggregation Level |
|---|---|---|
|
Assortment Cluster |
The name that identifies the cluster. |
All, Cluster, Product, Planogram Set |
|
Product Code |
The code assigned to the product. |
All, Product, Planogram Set |
|
Product Name |
The name that identifies the product. |
All, Product, Planogram Set |
|
Planogram Set |
The name that identifies the planogram set. The name is a concatenation of the subcategory name and the season name. |
All, Planogram Set |
|
Store Code |
The code assigned to the store. |
All |
|
Store Name |
The name that identifies the store. |
All |
|
Run ID |
The ID that identifies the specific run. This is useful for assortments with more than one run. |
All |
|
Store Count |
Tells the user how many stores the data from that row represents. |
Product, Planogram Set |
|
Stores with Facings |
The number of stores whose facing count is greater than 0 (see Store Count description). |
Product, Planogram Set |
|
Facing Count |
The facing count. |
All, Cluster, Product, Planogram Set |
|
Sales Units |
The number of the standard sales category for a product. |
All, Cluster, Product, Planogram Set |
|
Sales Revenue |
The amount of revenue for the product. |
All, Cluster, Product, Planogram Set |
|
Gross Profit |
The difference between sales revenue and cost. |
All, Cluster, Product, Planogram Set |
|
Lost Sales Units |
The lost sales units. |
All, Cluster, Product, Planogram Set |
|
Demand |
The demand. |
All, Cluster, Product, Planogram Set |
Finalizing an Assortment
Which runs are finalized is based on which runs are used to generate the results data (the set of unique Run IDs in the View Results table). In order to determine the runs used to generate the data, the most current run for each product/store is determined. For example, when you view the results for All, you may see records that have different Run IDs.
The "Selection Recommended for Runs" should include all runs used to generate the results. A run must be in this list and in the Selected Runs list in order to become finalized when the assortment is finalized.
Once you are satisfied with the results and finalize an assortment, it is available for export to Category Management and Space Planning.
Once an assortment is finalized, the status as displayed in the Assortment List changes to Finalized.
To finalize an assortment, open it in the Assortment Analysis screen, select the runs you want to finalize, and click the Finalize button.
Exporting the Run Results
Once an assortment is finalized, the Export button is enabled and the Finalize button is disabled. Click the Export button in order to export the results. Once the assortment is exported, the results of the export are displayed in the Assortment Analysis table, as shown in Figure 2-5, and you can no longer select the runs for analysis. At this point, the Assortment Analysis display consists only of the Summary and the Results. The Select Runs for Analysis section is not displayed.
Once an assortment is exported, the status of the run as displayed in the Assortment List changes to Exported. The status is also shown on the Assortment Analysis screen, in the Summary section.
Once the assortment is finalized and exported, it is no longer available in the Select Planogram Set in Execute Space Optimization. See Chapter 4, "Execute Space Optimization" for more information about the Select Planogram Set.
An assortment cannot be part of an assortment set that has been finalized. In such cases, the export button is disabled.
The runs that are finalized may represent a subset of the group of approved runs.
Assortment Analysis Metrics
The metrics displayed in the Assortment Summary list and in the Run Results list can be different. This can occur when there is more than one run as the run results roll-up to Space Cluster or Store (optimization location) and the assortment analysis rolls up to Assortment Cluster.
Specifically, the metrics Units, Sales Revenue, Gross Profit and Lost Sales Units obtained from run results are summarized across all optimization location for all stores. These values match with the assortment analysis rollup to assortment cluster when that run is the only selected. The metrics Facing and Demand actually match but are presented at different levels within the two screens. The run results bottom panel - included products shows those values as an average per store, while the assortment analysis screen shows those values just as the other metrics: across all the stores within the cluster.