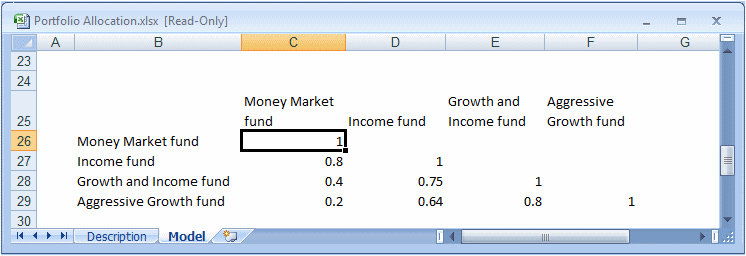
If you prefer, you can enter a matrix of correlations in a Microsoft Excel worksheet and link a group of assumptions to it (Figure 102, Matrix of Correlations in Example Spreadsheet).
In Figure 102, Matrix of Correlations in Example Spreadsheet, assumption names are entered beside each row of correlations in the matrix.
Note: | Notice that the value in the selected cell in Figure 102, Matrix of Correlations in Example Spreadsheet is 1 to show that the Money Market Fund assumption is correlated with itself. When you display a linked matrix in the Define Correlations dialog, such self-correlations always have the value of 1, regardless of the value entered into the spreadsheet. For this reason, it is not necessary to enter data on the diagonal because it is ignored. |
 To correlate the assumptions in the matrix and link correlations to the spreadsheet:
Enter a matrix of correlations into the worksheet (Figure 102, Matrix of Correlations in Example Spreadsheet).
Note:
You can use the same correlations for more than one matrix.
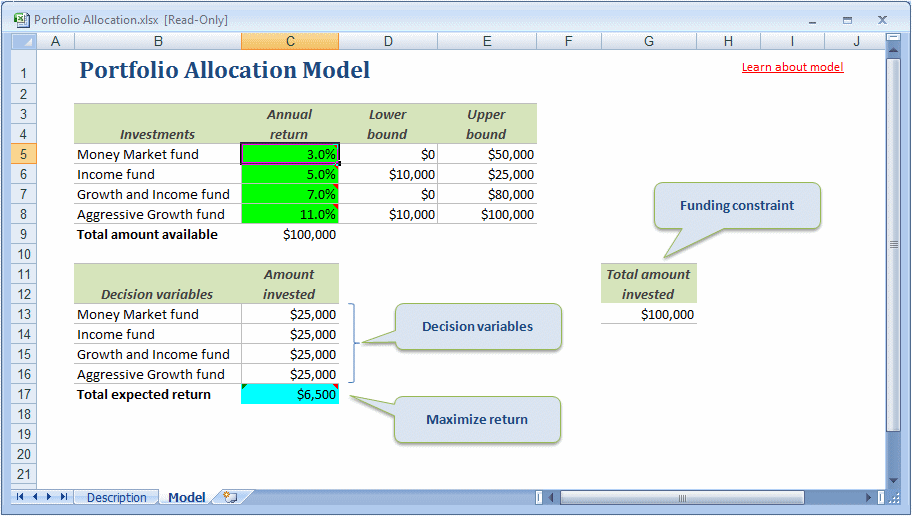
Select an uncorrelated assumption to correlate, for example Money Market fund, C5, in Figure 103, Portfolio Allocation.xlsx with Cell C5 Selected.
Note:
The examples in this section use Portfolio Allocation.xlsx, included as a sample with Crystal Ball.
In the Define Correlations dialog, confirm that Matrix View is selected in the View menu.
In the Define Correlations dialog, select Link to spreadsheet.
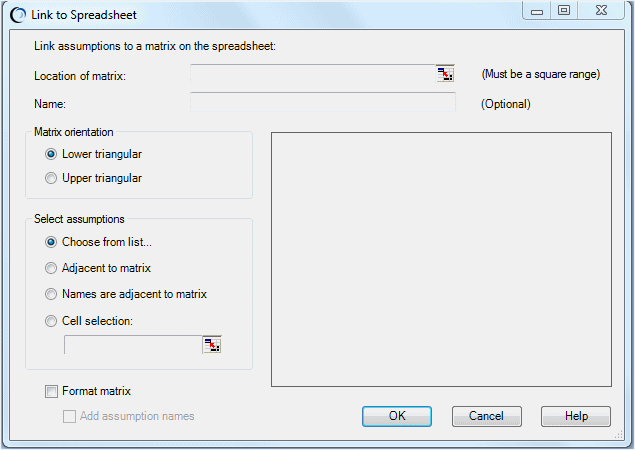
In the Link to Spreadsheet dialog, select the location of the matrix (cells C26 through F29 in this example, Figure 102, Matrix of Correlations in Example Spreadsheet, added by the user).
Note:
Named ranges are acceptable inputs and are included in the default matrix name.
For more about cell selection and correlation matrixes, see Cell Selection Rules for Smart Selection.
Indicate whether the matrix is in Lower triangular or Upper triangular orientation (in this case, Lower triangular).
Select assumptions to correlate. Select one of the following:
Choose from list—Offers a list of assumptions for selection
Adjacent to matrix—Indicates that the defined assumptions to be correlated are located next to the matrix, either to the left or above it
Names are adjacent to matrix—Indicates that the names of the assumptions to correlate are next to the matrix, either to the left or above it
Cell selection—When selected, enables you to select a range of defined assumptions to correlate
The preview box shows the matrix (the upper left corner for large matrixes), to help you with dialog entries.
In Figure 102, Matrix of Correlations in Example Spreadsheet, the names are adjacent to the matrix.
The matrix size is displayed to the right of the cell range box.
Optional: Select Format matrix to shade the diagonal of self-correlations and add borders to the cells with matrix values in the worksheet. Select Add assumption names to add adjacent names to the matrix.
Note:
If you select Choose from list or Cell selection, up and down arrow buttons are displayed to the left of the matrix grid when you click OK. You can use the arrows to rearrange the order of the assumptions.
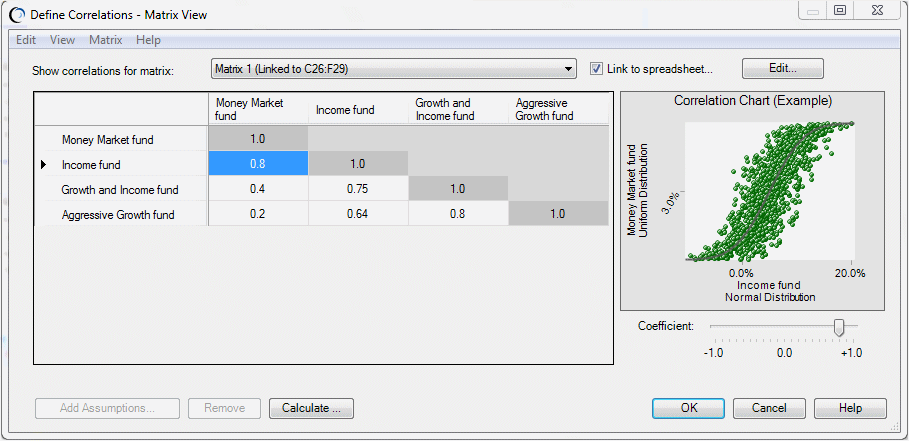
Figure 105. Define Correlations Dialog in Matrix View with a Linked Matrix Loaded from the Worksheet

The linked matrix is displayed in the Define Correlations dialog (Figure 105, Define Correlations Dialog in Matrix View with a Linked Matrix Loaded from the Worksheet). If you edit any of the correlations in a linked matrix, the new values are copied back to the matrix in the worksheet when you click OK.
Note: | If you attempt to unlink a linked matrix, a warning message is displayed. Unlinking the matrix deletes the entire matrix and all correlations defined in it. You can select View and then Open Scatter Chart to review the scatter plot associated with each correlation (Displaying Scatter Charts of Correlation Matrixes). The Add Assumptions and Remove buttons are not active. You can edit linked assumptions only by clicking the Edit button (Viewing and Editing Linked Matrixes). |
By default, a consistency check is performed when you click OK in the Define Correlation dialog (Checking Matrix Consistency).


