 To determine the certainty level for a specific value range using certainty grabbers:
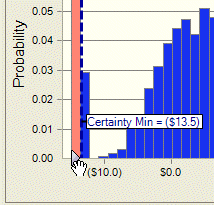
Move the certainty grabbers on the forecast chart (Figure 16, Moving a Certainty Grabber).
Click the grabber and then drag it when the cursor changes to a hand.
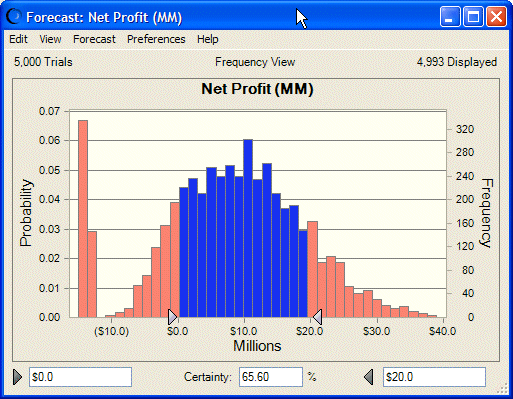
Crystal Ball shades the columns outside the certainty grabbers a different color to show that those values have been excluded (Figure 17, Certainty Level: Values $0 to $20 (in Millions)).
The Net Profit forecast chart in Figure 17, Certainty Level: Values $0 to $20 (in Millions) is the same as the example in Figure 15, Forecast Chart, except that the certainty grabbers have been moved to a minimum value of $0.0 and a maximum of $20.0. The certainty level is now 65.6%; you can be 65.6% confident of making a net profit between $0 and $20 million.

