The 2D Simulation analysis example uses a Crystal Ball example model, Toxic Waste Site.xlsx (Figure 63, Toxic Waste Site Spreadsheet Model). This model predicts the cancer risk to the population from a toxic waste site. This spreadsheet has two variability assumptions and two uncertainty assumptions.
To generate results, first the Crystal Ball run preferences are set for Monte Carlo simulation using the same sequence of random numbers with a seed value of 999. Then, the 2D Simulation tool is run with Risk Assessment as the target forecast, Body Weight and Volume of Water per Day included in the Variability list on the Assumption Types panel, and the following Options settings:
When run, the 2D Simulation tool first single-steps one trial to generate a new set of values for the uncertainty assumptions. Then it freezes these assumptions and runs a simulation for the variability assumptions in the inner loop.
The tool retrieves the Crystal Ball forecast information after each inner loop runs. The tool then resets the simulation and repeats the process until the outer loop has run for the specified number of simulations.
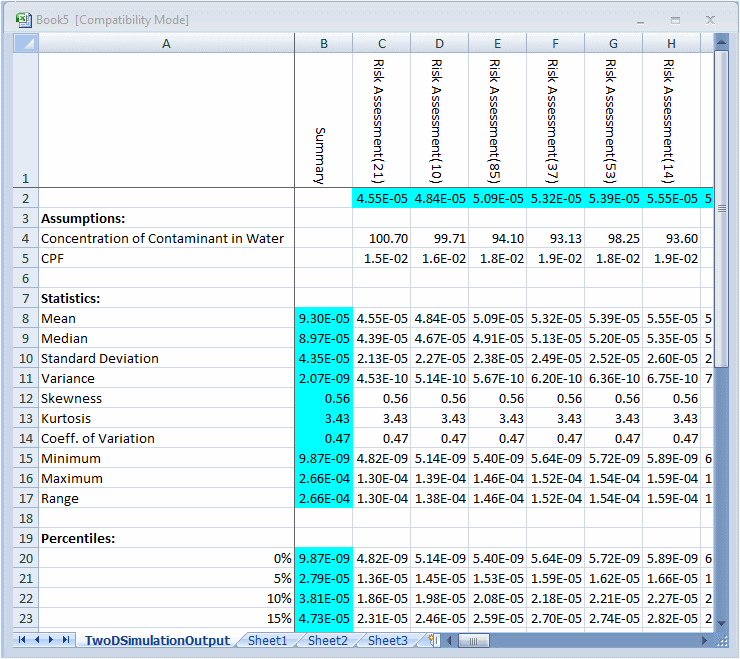
The results of the simulations are displayed in a table containing the forecast means, the uncertainty assumption values, and the statistics (including percentiles) of the forecast distribution for each simulation (Figure 66, 2D Simulation Results Table).
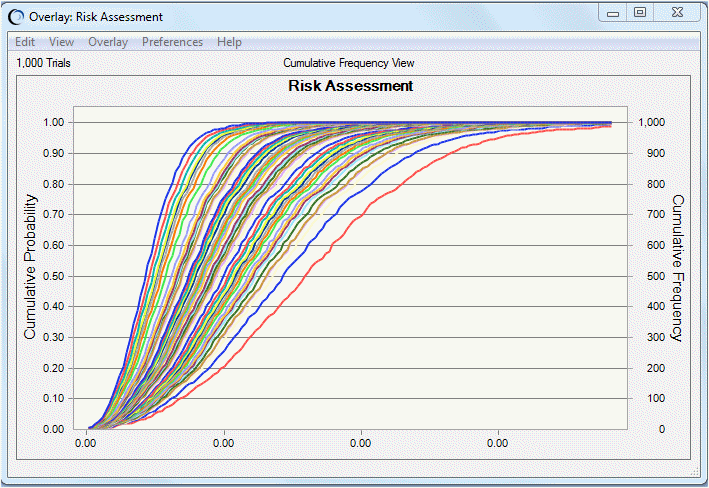
The tool also graphs the results of the two-dimensional simulations on an overlay chart and a trend chart.
The overlay chart preferences can be set to show the risk curves for the simulations for different sets of uncertainty assumption values. To do this, set the Chart Type for each series to Line and select Cumulative Frequency view. It is convenient to use the chart hotkeys — Ctrl+t for the chart type and Ctrl+d for view. Optionally, use Ctrl+n to move or remove the legend and Ctrl+m to cycle through central tendency marker lines.
For this example, Figure 67, Overlay Chart of Risk Curves shows that most of the risk curves are clustered densely toward the center while a few outlier curves are scattered toward the Cumulative Frequency axis, showing the small probability of having a much greater risk.
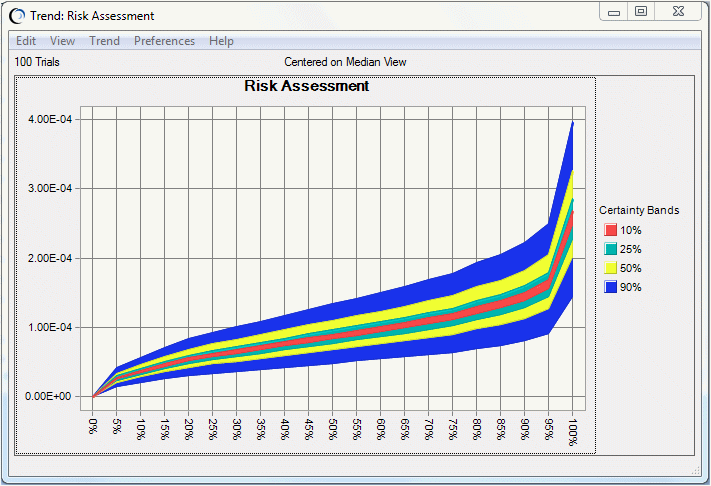
The trend chart (Figure 68, Trend Chart Certainty Bands) shows certainty bands for the percentiles of the risk curves. The band width shows the amount of uncertainty at each percentile level for all the distributions.
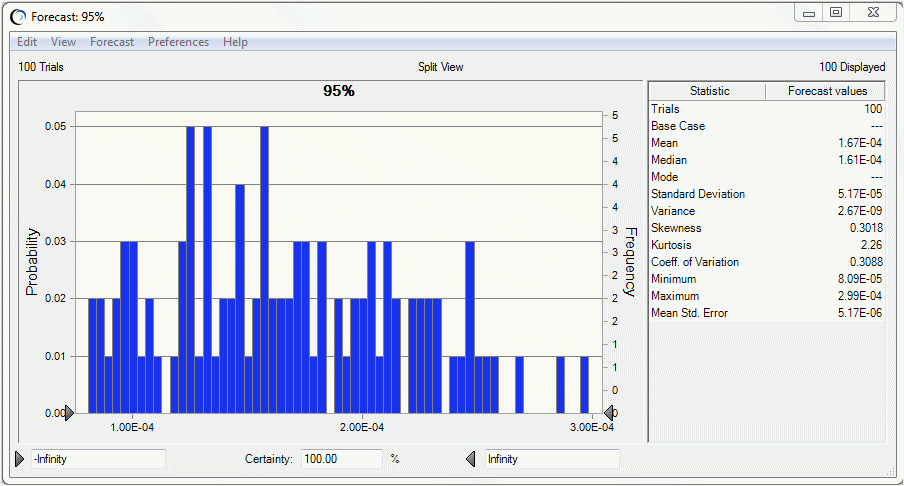
You can focus in on a particular percentile level, such as the 95th percentile, by viewing the statistics of the 95th percentile forecast, shown in Figure 69, 95th Percentile Forecast Statistics. For example, this figure shows 100 trials, the number of 95th percentiles in the forecast.
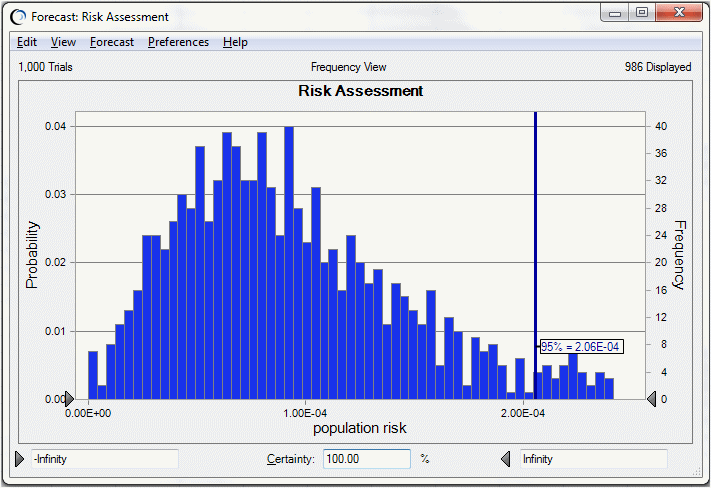
Compare the results of the two-dimensional simulation to a one-dimensional simulation (with both uncertainty and variability co-mingling together) of the same risk model, as in Figure 70, Forecast Chart for One-dimensional Simulation.
The mean of the 95th percentiles in Figure 69, 95th Percentile Forecast Statistics, 1.45E-4, is lower than the 95th percentile risk of the one-dimensional simulation shown in Figure 70, Forecast Chart for One-dimensional Simulation at 2.06E-4. This indicates the tendency of the one-dimensional simulation results to overestimate the population risk, especially for highly skewed distributions.
Often, the parameters of assumptions are correlated. For example, you would correlate a higher mean with a higher standard deviation or a lower mean with a lower standard deviation. Defining correlation coefficients between parameter distributions can increase the accuracy of the two-dimensional simulation. With data available, as in sample body weights of a population, you can use the Bootstrap tool to estimate the sampling distributions of the parameters and the correlations between them. |
Some assumptions contain elements of both uncertainty and variability. For instance, an assumption may describe the distribution of body weights in a population, but the parameters of the distribution may be uncertain. These types of assumptions are called second-order assumptions (also, second-order random variables; see Burmaster and Wilson, 1996, in the Bibliography). You can model these types of assumptions in Crystal Ball by placing the uncertain parameters of the distribution in separate cells and defining these cells as assumptions. You then link the parameters of the variability assumption to the uncertainty assumptions using cell references.
 To illustrate this for the Toxic Waste Site.xlsx spreadsheet:
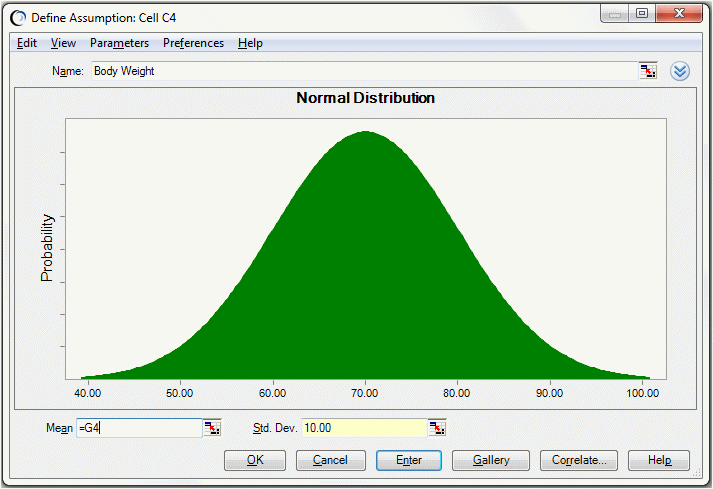
Enter the values 70 and 10 into cells G4 and H4, respectively.
These are the mean and standard deviation of the Body Weight assumption in cell C4, which is defined as a normal distribution.
Define an assumption for cell G4 using a normal distribution with a mean of 70 and a standard deviation of 2.
Define an assumption for cell H4 using a normal distribution with a mean of 10 and a standard deviation of 1.
Enter references to these cells in the Body Weight assumption (Figure 71, Assumption Using Cell References for the Mean and Standard Deviation).
When you run the tool for second-order assumptions, the uncertainty of the assumptions’ parameters is modeled in the outer simulation, and the distribution of the assumption itself is modeled (for different sets of parameters) in the inner simulation.