15 Working with Reports
This chapter describes how to open and work with the Oracle Privileged Account Manager reports by using the Console.
Note:
-
You must be an Oracle Privileged Account Manager administrator with the Security Auditor Admin Role to open and work with these reports.
-
You can also use the Oracle Privileged Account Manager's command line tool or RESTful interface to work with these reports.
For more information, refer to Appendix A, "Working with the Command Line Tool" and Appendix B, "Working with Oracle Privileged Account Manager's RESTful Interface" (respectively).
This chapter includes the following sections:
15.1 Overview
Oracle Privileged Account Manager's real-time reports provide information about the targets and accounts being managed by Oracle Privileged Account Manager. These reports include:
-
Deployment Reports: Provide information about how targets and privileged accounts are distributed within your deployment.
-
Usage Reports: Provide information about the privileged accounts that are currently checked out in your deployment.
-
Failure Reports: Provide information about any on-going target and privileged account failures.
-
Checkout History Reports: Provide information about the privileged account checkouts that have been performed over a specified period of time.
15.2 Working with Deployment Reports
A Deployment Report provides information about the current state of targets and privileged accounts within your deployment.
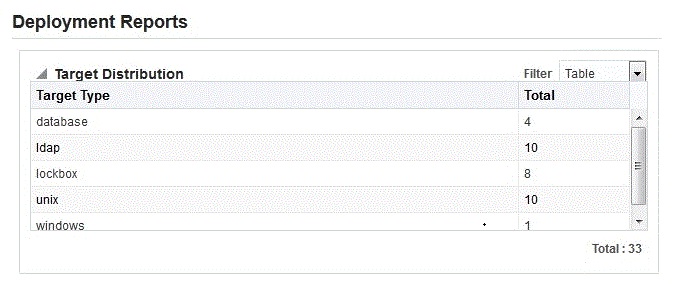
To open this report, select the Deployment Reports link in the Reports accordion. The Deployment Report page is displayed, similar to the example shown in Figure 15-1.
The information on this page is organized into the following portlets:
-
The Target Distribution and Account Distribution portlets provide information about how targets and accounts in a specific organization (or in all organizations) are distributed by target type.
-
The Target and Account portlets show a list of targets and accounts in a specific organization (or in all organizations) by target type.
In addition, you can use the following features on this page to change the data display:
-
Use the Show menu to manage how much data is displayed in the report:
-
Choose All (default) to view the deployment status of targets and accounts for all organizations.
-
Choose the name of an organization to view the deployment status of targets and accounts in that particular organization.
-
-
Use the Filter menus to view Target Distribution or Account Distribution data as a Bar Graph (default), Pie Chart, or Table.
For example, Figure 15-1 shows the Target Distribution data in Bar Graph format. Figure 15-2 and Figure 15-3 show that same data in Pie Chart and Table format (respectively).
-
Hover the cursor over individual pie segments or bars to see a pop-up (such as the one shown in Figure 15-2) with Series, Group, and Value information for that particular Target Type.
-
Series identifies which component of the report is reflected by that pie or bar.
-
Group indicates the organization (All, ModifiedOrg, Oracle, or ST_Users) on which the report results were based.
-
Value indicates how many items were included in that component.
-
-
Click individual pies or bars to limit the Target Deployment or Account Deployment results to a specific Target Type. For example, click the 24% pie in Figure 15-2 and only lockbox targets are displayed in the Target Deployment table.
Click Refresh to change the display back to all targets and all accounts.
-
Click a Target Name link or an Account Name link in the Deployment tables to open the configuration page for that target or account.
15.3 Working with Usage Reports
A Usage Report provides information about how privileged accounts are currently being used in your deployment.
To open this report, select the Usage Reports link in the Reports accordion. The Usage Report page is displayed, similar to the example shown in Figure 15-4.
The information on this page is organized into the following portlets:
-
The Current Checkouts portlet summarizes which accounts are currently checked out within your deployment.
-
The Current Checkout Distribution portlet compares how the current checkouts are distributed, based on checkout type (password or session) and target type.
-
The Current Account Usage portlet compares how many accounts are currently checked out in relation to the total number of accounts.
In addition, you can use the following features on this page to change the data display:
-
Use the Show menu to manage how much data is displayed in the report:
-
Choose All (default) to view the current account reservations for all organizations.
-
Choose the name of an organization to view the current account reservations for that particular organization.
-
-
Use the Filter menus to view the Current Checkout Distribution or Current Account Usage Status data as a Bar Graph (default), Pie Chart, or Table.
For example, Figure 15-4 shows the Current Account Distribution and the Current Account Usage Status data in the Bar Graph format. Figure 15-2 shows that same data in Pie Chart format.
-
Hover your cursor over individual pies or bars to see a pop-up with Series, Group, and Value information for that particular Target Type.
-
Series identifies which component of the report is reflected by that pie or bar.
-
Group indicates the organization (All, ModifiedOrg, Oracle, or ST_Users) on which the report results were based.
-
Value indicates how many items were included in that component.
-
-
Click a Target Name link or an Account Name link in the Deployment tables to open the configuration page for that target or account.
15.4 Working with Failure Reports
A Failure Report provides information about the current state of target and account failures in your deployment.
Generally, there are two kinds of failure in Oracle Privileged Account Manager:
-
Target failures occur when Oracle Privileged Account Manager cannot connect to the target, such as when the target server is down. In this situation, Oracle Privileged Account Manager cannot change passwords for any accounts on the failed target.
-
Account failures occur when Oracle Privileged Account Manager can connect to the account's target, but cannot change the password for that particular account. For example, this failure occurs when accounts get removed from a target.
To open this report, select the Failure Reports link in the Reports accordion. The Failure Report page is displayed, similar to the example shown in Figure 15-6.
The information on this page is organized into the following portlets:
-
The Targets and Accounts Failures portlet provides a list of targets, the target status, last error message, last failure date, and the total number of target and account failures.
-
The Target Failures portlet illustrates the distribution of failed targets by target type.
-
The Account Failures portlet illustrates the distribution of failed accounts by target type.
In addition, you can use the following features on this page to change the data display:
-
Use the Show menu to manage how much data is displayed in the report:
-
Choose All (default) to view all target and account failures.
-
Choose the name of a resource group to view the target and account failures for a particular resource group.
-
-
Use the Filter menus to view the Target Failures or Account Failures data as a Bar Graph (default), Pie Chart, or Table.
For example, Figure 15-6 shows the Target Failures data in Bar Graph Format and the Account Failures data in Table format. Figure 15-7 shows the Target Failures data in Pie Chart format.
-
Hover your cursor over individual pie segments or bars to see a pop-up (such as the one shown in Figure 15-7) with Series, Group, and Value information about that particular failure.
-
Series identifies which component of the report is reflected by that pie or bar.
-
Group indicates the organization (All, ModifiedOrg, Oracle, or ST_Users) on which the report results were based.
-
Value indicates how many items were included in that component.
-
-
Click a Target/Account link in the Targets and Accounts Failures table to open the configuration page for that target or account.
15.5 Working with Checkout History Reports
A Checkout History Report provides information about the account checkouts performed over a specified period of time.
Generally, there are three kinds of Checkout History reports in Oracle Privileged Account Manager:
-
Plain Text Transcripts:
The session checkout history recording is available in a plain text transcript format denoted by the (
 ) icon.
 -
Interactive Transcripts:
The session checkout history recording is available in an interactive transcript format denoted by the (
 ) icon. This transcript contains a region where the transcript text is loaded in plain text and another, which contains an outline of all the commands issued to the target system, along with their timestamps. Each command in the outline will link to a relevant region of the transcript, when clicked.
When you click a command on the "Command List", the session transcript will move to the position in the transcript where that command is executed.
-
Video Recordings:
The session checkout history recording is available in a video recording format denoted by the (
 ) icon. Video recordings are available for Windows targets only.
In the video recording re-play page, when you click an event in the "Event Index," the video move to part of the video where the event begins and pause there.
To open a Checkout History report,
-
Select the Checkout History Report link in the Reports accordion.
The Checkout History Report page is displayed, similar to the example shown in Figure 15-8.
-
Use the Search Checkout History portlet to configure your search parameters:
-
You must specify a Start Date and an End Date range in which to search for checkouts. Type a date and time into the blank fields or use the Calendar icons.
-
Enter information into one or more of the Account Name, User Name, Target Name, or Pattern fields to further narrow the search results. (Optional)
Note:
-
Use the Pattern field to search for a string in the session recording of a checkout event. For example, entering
rmdirnarrowed the search results in Figure 15-8 to the two entries as shown in Figure 15-9. -
Oracle Text indexes are used for pattern search. To maintain these indexes refer to Section 17.5.5, "Managing Oracle Text Index for Session Recordings."
-
If the recent session recordings are not listed in the pattern search results, refer to Section 20.3.22, "Checkout History Search Results for Pattern Search Do Not Include Recent Session Recordings" to troubleshoot this issue.
-
-
Enter a value into the Query field to limit the number of returned results.
-
-
Click Search and the results are displayed in a table that is organized into the following columns:
-
Start Date and End Date: Date that the account was checked out and checked back in, respectively.
-
Account Name: Name of the checked out account.
-
User Name: Name of the user who checked out the account.
-
Target Name: Name of the target associated with the account.
-
Recording: The recording icon or icons in this column indicate that the recording of the user's actions during the checkout is available for viewing. You must click the icon to view the specific type of recording.
For a unix target, the recording can be in the plain text transcript format denoted by the (
) icon, or the interactive transcript format denoted by the ( ) icon. For a windows target, the recording is available in the video format denoted by the ( ) icon.Note:
Only an administrator can view session recordings. Refer to Section 9.7, "Viewing a Session Recording" for more information.
-