16 Accessing Oracle Unified Directory Using ODSM
This chapter describes how to access Oracle Unified Directory by using Oracle Directory Services Manager (ODSM).
ODSM is an interface for managing instances of Oracle Unified Directory. ODSM enables you to configure the structure of the directory, define objects in the directory, add and configure users, groups, and other entries. ODSM is also the interface you use to manage entries, schema, security, and other directory features.
This chapter includes the following sections:
Additional information about using ODSM to manage Oracle Unified Directory is available in the following sections:
For information about using ODSM to manage proxy configurations, see Part IV, "Configuring Proxy, Distribution, and Virtualization Functionality."
16.1 Invoking ODSM
For information about supported browsers for ODSM, see System Requirements and Supported Platforms for Oracle Fusion Middleware 11gR2, at the following location:
http://www.oracle.com/technetwork/middleware/ias/downloads/fusion-certification-100350.html
To invoke ODSM, enter the following URL into your browser's address field:
http://host:port/odsm
where host is the name of the managed server on which ODSM is running and port is the managed server port number of the admin server. The default admin port is 7001.
Connect to the server as described in the following section.
Note:
If Oracle Unified Directory has recently been updated, you might encounter a problem on Oracle WebLogic Server when you try to invoke ODSM. During an Oracle Unified Directory update operation, ODSM is also updated, and the ODSM URL can change. This problem usually occurs if you used your browser to invoke the earlier version of ODSM.Therefore, to invoke the updated version of ODSM, first clear your browser's cache and cookies.
16.2 Connecting to the Server Using ODSM
The following image shows a portion of the main ODSM screen, from which you can connect to a specific Oracle Unified Directory instance.
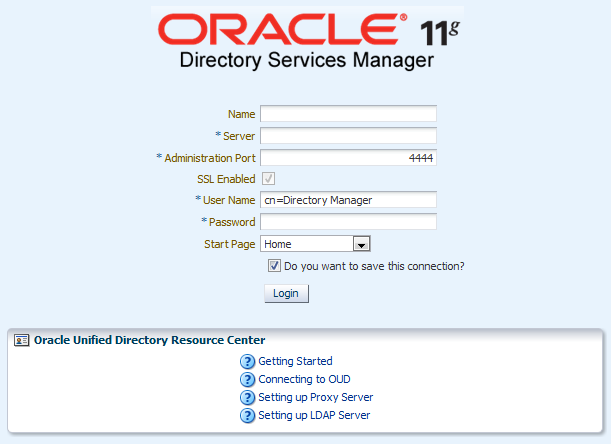
Enter the following information to connect to an Oracle Unified Directory instance:
-
Server. Enter the name of the directory server to which you want to connect.
-
Port. Enter the administration port number of the directory server to which you want to connect.
-
User name. Enter the bind DN to connect to the directory.
-
Password. Enter the bind password to connect to the directory.
If SSL is enabled, you are asked to trust the server certificate.
Note:
If you change the browser language setting, then you must update the session to use the new setting. To update the session, either reenter the ODSM URL in the URL field and press Enter or quit and restart the browser.16.3 Displaying Server Information Using ODSM
The Home tab and Metrics tab of each server instance in ODSM enables you to view specific information about the server.
This section describes how to view server information and contains the following topics:
16.3.1 Viewing the Server Role
The server role can be one or more of the following, depending on how the Oracle Unified Directory instance was set up.
-
Directory
-
Proxy
-
Load Balancer
-
Distributor
-
Replication Gateway
-
Replication Server
For more information, see "Selecting a Server Role" in Installing Oracle Unified Directory.
16.3.2 Viewing Version Information
The version information panel indicates the version number of the ODSM instance, the Oracle Unified Directory instance, and the version of the Java Runtime Edition (JRE).
16.3.3 Viewing Server Statistics
The OUD Statistics panel displays installation details and basic monitoring information for this server instances. The following information is displayed:
-
Server Start Time. The latest date and time on which the server was started successfully.
-
Installation Path. The network path to the installation files for this server instance.
-
Instance Path. The network path to the instance files for this server instance.
-
Administrative Users. The root user that was configured when the server was set up. For more information, see Chapter 29, "Managing Administrative Users."
-
Total LDAP Operations Completed (per sec) (since startup). The total number of LDAP operations performed on the server, divided by the number of seconds that have passed since server startup.
-
Average Elapsed Time per Operation (since startup) (ms). The average time taken to complete an LDAP operation.
-
Connection Rate (con/sec). The number of connections that the server is currently handling per second.
16.3.4 Viewing the Configured Connection Handlers
The Connection Handlers panel details of all the connection handlers that are configured for this server instance, including the type of connection handler, the port on which that connection handler is listening, and whether the connection handler is enabled.
For more information about connection handlers, see Section 17.1.5, "Configuring Connection Handlers Using dsconfig" and Section 17.4, "Managing Administration Traffic to the Server."
16.3.5 Viewing the Configured Naming Contexts
The Naming Contexts panel displays all naming contexts, or suffixes, that are configured on this server instance, including the network group to which that naming context belongs, the number of entries in the naming context and whether that naming context is replicated.
16.3.6 Viewing the Configured Data Sources
For proxy servers, the Data Sources panel displays all of the data sources, or back-end LDAP servers that are managed through that proxy instance.
16.3.7 Viewing the Server Metrics
The Metrics tab of each server instance in ODSM enables you to view specific performance metrics for the server. These metrics include the server start up time, its current time, and usage information.
The usage information is organized into three subtabs, which are described in the following topics:
By default, this page is configured to automatically refresh the displayed metrics every 20 seconds. To change the default refresh interval, click the Update link and enter a new value. You can disable this feature by clearing the Automatic Refresh box.
Icons indicate whether the metrics are up ![]() , down
, down ![]() , or unchanged
, or unchanged ![]() since the last refresh. In addition, a Help icon
since the last refresh. In addition, a Help icon ![]() indicates that additional information is available. Click the Help icon
indicates that additional information is available. Click the Help icon ![]() to view a pop-up with information related to that entry.
to view a pop-up with information related to that entry.
16.3.7.1 Viewing Usage Since Startup
The Usage Since Startup tab metrics are cumulative and they represent the sum of usage metrics since the server started up.
These metrics are provided on a server basis and on a connection handler basis. In each section, the header row shows the total metrics for the entire server and the tables show how the metrics are distributed across the connection handlers (or client ports).
The Usage Since Startup tab contains the following sections:
-
Opened Connections. Shows how many connections have been opened since startup, per connection handler.
-
Entries Sent to Clients. Shows how many entries have been sent to the clients since startup, per connection handler.
-
Megabytes Sent to Clients. Shows how many megabytes have been sent to clients since startup, per connection handler.
-
Operations Completed. Shows how many operations have been completed since startup, per connection handler.
-
Operations Initiated. Shows how many operations have been initiated since startup, per connection handler.
Expand the header row in each section to view a table with the following information:
| Parameter | Description |
|---|---|
| Connection Handler Name | Name of the connection handler that is managing this connection. |
| Port | Server port that the connection is using. |
| Since Startup | Absolute metric value since the server was started. |
| Avg/Sec Since Startup | Average metric value since the server was started. |
| Avg/Sec Since Previous Refresh | Average metric value between two refreshes.
Note: This value can be quite useful because it shows what is currently happening in the server. The two averages illustrate the evolution of a metric between refreshes, which enables you to see if things are going up or down. |
Note:
-
Click the Sort Ascending or Sort Descending icons
 to sort the information in each column.
 -
Click the Help icon
 to view more information about that entry.
16.3.7.2 Viewing Current Usage
The Current Usage tab displays metrics that represent how the Oracle Unified Directory server is currently being used, such as how many connections are currently open and the number of threads in the Java process.
The Current Usage tab contains the following sections:
-
Active Threads. Shows how many active threads are currently being used.
-
Databases in Use. Shows how many local database workflow elements are currently being used.
-
Open Connections. Shows how many connections are currently open.
Expand the header row to view a table with the following information:
Parameter Description Time Opened Time that the connection was opened. Bound As User (Bind DN) that the connection is using to bind to the server. Type Type of connection. Possible values are: -
LDAP for non-encrypted LDAP connections
-
LDAPS for SSL LDAP connections
-
Start TLS for LDAP connections using Start TLS
-
JMX for JMX connections
Connection ID Unique integer identifier that is assigned to the server connection. Connection Handler Name of the connection handler that is managing this connection. Port Server port that the connection is using. Client Address IP address of the client accessing the server. Server Address IP address of the server. Operations in Progress Number of operations that are currently being handled by the connection. The same connection can be used to perform several operations in parallel. Note:
To sort the information in each table column, click the Sort Ascending or Sort Descending icons. -
-
Remaining Available Connections. Shows how many connections can still be opened when the number of connections to the server is limited.
You can configure the server to limit the number of connections by using the
max-allowed-client-connectionsattribute. For more information about this attribute, see "Global Configuration" in the Configuration Reference for Oracle Unified Directory.
Note:
Icons indicate whether the metrics are up16.3.7.3 Viewing Cache Usage
The Cache Usage tab displays metrics about the database caches (one for each local database workflow element that is defined in the server) and the entry cache.
The Cache Usage tab contains the following sections:
-
Database Cache. Shows information about each database cache.
This table in this section provides the following information for the upper, bottom, and leaf nodes in the database.
Parameter Description Local DB Workflow Element Name Name of the element. Hits Number of hits since server startup. Tries Number of tries since server startup. Hit Ratio Since Startup Hit ratio since server startup. Hit Ratio Since Previous Refresh Hit ratio since the last server refresh (most relevant value). Note:
-
The higher the hit ratios, the better the database cache is being used.
-
Click the Help icon
next to a Database Cache Name to see information about the naming contexts associated with the local database workflow element.
-
-
Entry Cache. Shows information about each entry cache that is defined in the server.
The table in this section displays the following information about the entry cache configuration and hit ratio.
Parameter Description Name Name of the cache. Type Type of cache configuration. Possible values are: -
File System
-
FIFO
Hits Number of hits since server startup. Tries Number of tries since server startup. Hit Ratio Since Startup Hit ratio since server startup. Hit Ratio Since Previous Refresh Hit ratio since the last server refresh (most relevant value). DB Cache Max Size Maximum size that the file system entry cache can take. Note: This parameter is displayed only when the entry cache type is File System.
Max Entries Maximum number of entries that the cache can use. Note: This parameter is displayed only when the entry cache type is FIFO.
Max JVM Memory Percentage Maximum percentage of JVM memory that the cache can use. -
The expected hit ratio depends on how you defined the cache; in particular on the type of entries contained in the cache.
Note:
-
Icons indicate whether the metrics are up
 , down
  , or unchanged
  since the last refresh.
 -
Click the Help icon
next to an Entry Cache Name to see more information, such as the include and exclude filters that define which entries should go in the entry cache.