|
|
|
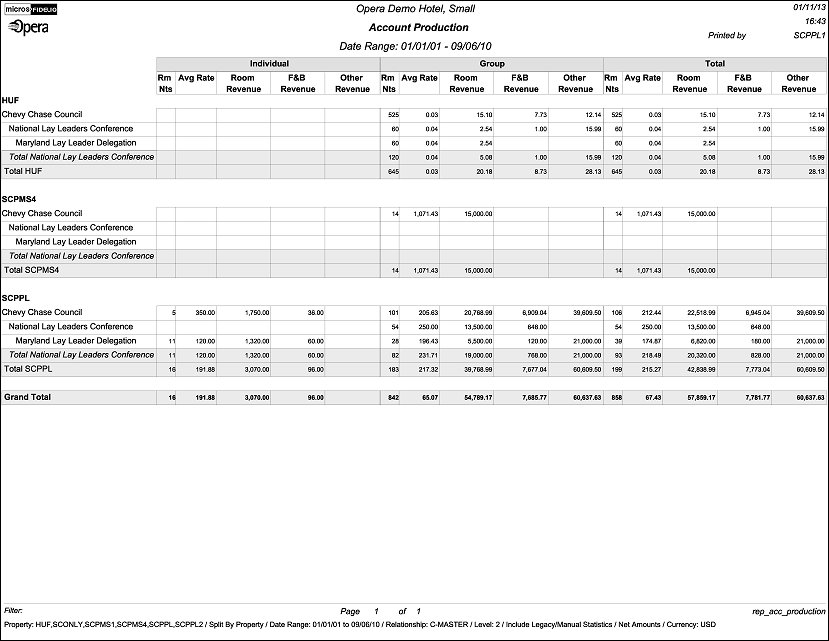
Account Production Report (REP_ACC_PRODUCTION.REP with REP_ACC_PRODUCTION.FMX)
The Account Production report is used to calculate and print actual production of the selected account separately for individuals and groups and as a total. Within each of these categories the revenue is split out into room revenue, F&B revenue and other revenue. The report order form gives an option to roll up revenues from subsidiaries and even allows selecting the level to which the revenue should be detailed for each master. The figures can be printed as net or gross.
For purposes of this report, the definition of a Master Account is any company, agent or source profile that has hierarchical relationships linked beneath it and does not have any hierarchical relationships linked above it.
Note: When printing this Report help topic, we recommend printing with Landscape page orientation.
Note: This report requires that the user be granted the ACCOUNT PRINT permission in the selected property to run the report. Also, the Property LOV in this report is further limited by the properties to which the user has the appropriate access granted.
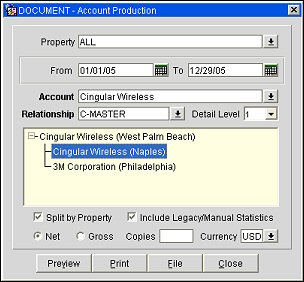
Property. Available when either the OPP_MHT2 or OPS_MHT2 license is active, or when the main license OPF_<version_number> is active; choose the property (or properties) for which production should be calculated.
From/To Date. Select the From and To dates for which production should be calculated.
Account. Use the down arrow to initiate the Account Search screen. From here you can search for accounts by account name, number or any of the other search features available from the Account Search screen.
Relationship. Select from a list of hierarchical relationship types that are attached to the selected account and where the From Type and the To Type equal the profile type of the selected Account. For example, if the selected account is a Company the LOV will only list Company to Company hierarchical relationships that are attached to the selected account. If the selected account has no hierarchical relationships, the Relationship LOV will be disabled.
Detail Level. Select the detail level for which production should be printed. 0 will print all revenue rolled up to master level only whereas 1-x will print details of produced revenue for each of the selected subsidiary levels.
Relationship Hierarchy Window. Displays the relationship hierarchy for the selected account.
Split by Property. Use this option to group and sort this report by property when selecting to print production in more than one property.
Include Legacy/Manual Statistics. Select this check-box to generate this report including any revenues that were manually added or that were migrated from a legacy system.
Net. Select this radio button to generate this report in net revenue.
Gross. Select this radio button to generate this report in gross revenue.
Copies. Determines the number of copies that will print, when the Print button is selected.
Currency. Select the currency in which the revenues on this report will display.
Preview. Use the preview option to view the generated output of this report in PDF format.
Print. Use the Print button to print the report to the selected output.
File. Prints the generated report output to an *.rtf file.
Close. Closes this report screen.
This report is printed in three main columns separating individual revenue, group revenue and a summary for total revenue. Within each of these sections room nights, average rate, room revenue, F&B revenue and other revenue will print.
This report does not consider DAY USE rooms in the Room Nights figures
Subsidiary data displays in the selected levels after the primary entries for the Master account, if an account with a Master/Sub relationship is selected. For example, if the relationship type selected on the report form is Master to Sub the following rows show revenues for the subsidiaries followed by the total row summarizing master and sub revenues. A subtotal rolled up to each subsidiary level will print.
Note: The figures for this report are calculated using three tables:
- profile_yearly_statistics - when the date range requested includes a full calendar year, this table is used.
- profile_monthly_statistics – when the date range requested includes full calendar months but not a complete calendar year, this table is used.
- company_stat_daily (or agent_stat_daily or source_stat_daily) – when the date range requested includes dates that are less than a full calendar month, this table is used for those dates.
Example 1:
If the requested date range is January 1, 2011 – December 31, 2011, then profile_yearly_statistics will be used.
Example 2:
If the requested date range is January 2, 2011 – December 31, 2011, then company_stat_daily will be used for January 2 – January 31 and profile_monthly_statistics will be used for February 1 – December 31.
If running this report in SFA for an interfaced property, then the reservation_stat_daily table must be exchanged via OXI and the application parameter General>POPULATE RESERVATION STATISTICS TABLES must be set to Y. The figures will only account for past data – not for any reservations and group bookings still on the books. The reservation/group must be checked in in order to get accounted for on this report.