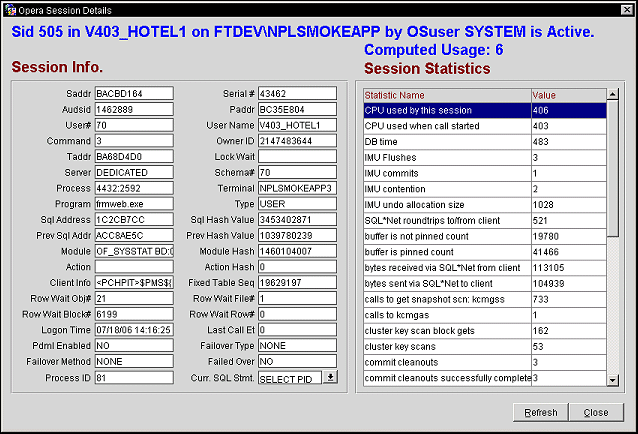
Session Statistic Details
Displays specific statistics pertaining to a session. Access this screen by Utilities>Tools>Session Statistics>Details button.

Saddr. Identifies a unique Oracle session address
Serial #. Session serial number. Used to uniquely identify a session's objects.
Audsid. Indicator for the current session's auditing session ID.
Paddr. Address of the process that owns the session.
User #. Oracle user identifier.
User Name. Name of the user.
Command. Command in progress. See Commands for the Command of the Number.
Owner ID. The column contents are invalid if the value is 2147483644. Otherwise, this column contains the identifier of the user who owns the migratable session. For operations using Parallel Slaves, interpret this value as a 4-byte value. The low-order 2 bytes of which represent the session number, and the high-order bytes the instance ID of the query coordinator.
Taddr. Address of transaction state object.
Lock Wait. Address of lock waiting for; null if none.
Server. Server type (DEDICATED, SHARED, PSEUDO, NONE)
Schema #. Schema user identifier.
Process. Operating system client process ID.
Terminal. Operating system terminal name.
Program. Operating system program name.
Type. Session type.
Sql Address. Used with SQL_HASH_VALUE to identify the SQL statement that is currently being executed.
Sql Hash Value. Used with SQL_ADDRESS to identify the SQL statement that is currently being executed.
Prev Sql Addr. Used with PREV_HASH_VALUE to identify the last SQL statement executed.
Prev Hash Value. Used with SQL_HASH_VALUE to identify the last SQL statement executed.
Module. Name of the currently executing module.
Module Hash. Hash value of the above MODULE.
Action. Name of the currently executing action.
Action Hash. Hash value of the above action name.
Client Info. Information that pertains to the client.
Fixed Table Seq. This contains a number that increases every time the session completes a call to the database and there has been an intervening select from a dynamic performance table. This column can be used by performance monitors to monitor statistics in the database. Each time the performance monitor looks at the database, it only needs to look at sessions that are currently active or have a higher value in this column than the highest value that the performance monitor saw the last time. All the other sessions have been idle since the last time the performance monitor looked at the database.
Row Wait Obj#. Object ID for the table containing the row specified in ROW_WAIT_ROW#.
Row Wait File#. Identifier for the datafile containing the row specified in ROW_WAIT_ROW#. This column is valid only if the session is currently waiting for another transaction to commit and the value of ROW_WAIT_OBJ# is not -1.
Row Wait Block#. Identifier for the block containing the row specified in ROW_WAIT_ROW#. This column is valid only if the session is currently waiting for another transaction to commit and the value of ROW_WAIT_OBJ# is not -1.
Row Wait Row#. Current row being locked. This column is valid only if the session is currently waiting for another transaction to commit and the value of ROW_WAIT_OBJ# is not -1.
Logon Time. Date and time of logon.
Last Call Et. If the session STATUS is currently ACTIVE, then the value represents the elapsed time in seconds since the session has become active. If the session STATUS is currently INACTIVE, then the value represents the elapsed time in seconds since the session has become inactive.
Pdml Enabled. This column has been replaced by column PDML_STATUS.
Failover Type. Indicates whether and to what extent transparent application failover (TAF) is enabled for the session:
Failover Method. Indicates the transparent application failover method for the session:
Failed Over. Indicates whether the session is running in failover mode and failover has occurred YES or not NO.
Process ID. ID assigned to the process.
Curr. SQL Stmt. Current SQL statement that is running for the session.
Statistics in the V$SYSSTAT and V$SESSTAT views show the total number of work areas executed with optimal memory size, one-pass memory size, and multi-pass memory size. These statistics are cumulative since the instance or the session was started.
Statistics are only displayed in this section if a value is present for the Statistic Name. If the Statistic Name does not have a value, then it is not displayed.
Click here to view all of the possible statistics that can appear in this section.
See Also